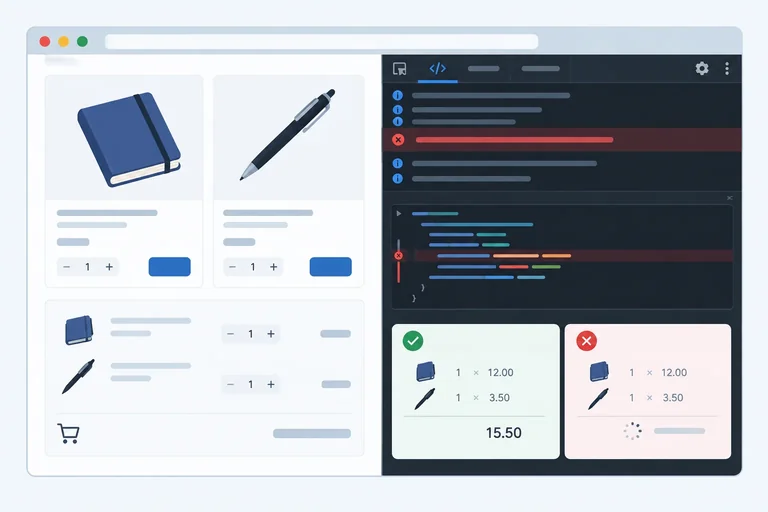
Step 1 of 8
Reproduce and Classify the Failure
Run a local cart script, record its expected and observed behavior, and classify its initial failure.

Learning path · Level 4 · Tutorial 9
Investigate a failing local script with console evidence and debugger controls, then verify that the correction addresses the actual cause.
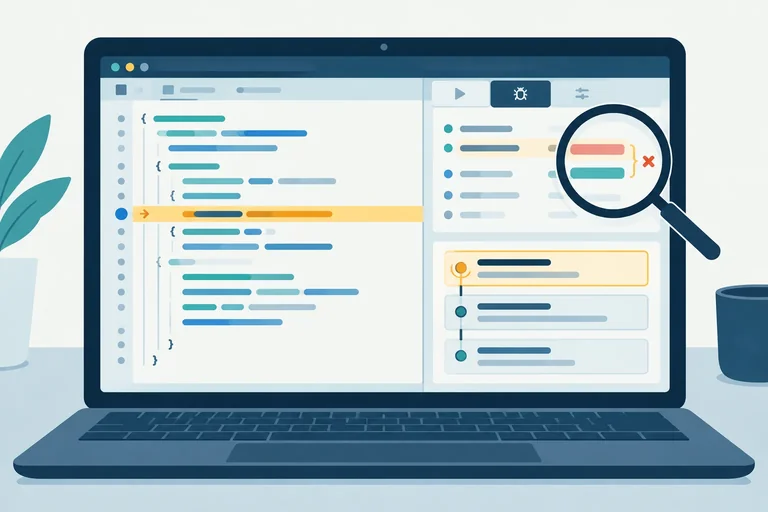
 Reproduce and Classify the Failure
Run a local cart script, record its expected and observed behavior, and classify its initial failure. 3 min
Reproduce and Classify the Failure
Run a local cart script, record its expected and observed behavior, and classify its initial failure. 3 min
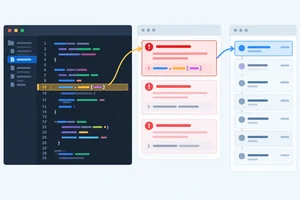 Follow the Error to Its Source
Use Console evidence, source links, and stack order to locate the failed helper and its callers. 2 min
Follow the Error to Its Source
Use Console evidence, source links, and stack order to locate the failed helper and its callers. 2 min
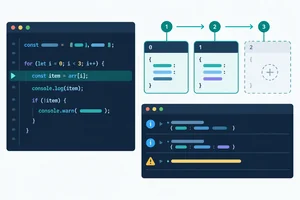 Collect Focused Console Evidence
Add a safe, targeted Console log to reveal the value reaching the failing cart helper. 2 min
Collect Focused Console Evidence
Add a safe, targeted Console log to reveal the value reaching the failing cart helper. 2 min
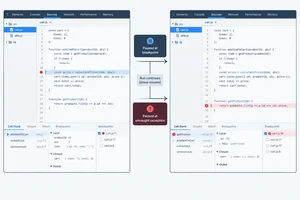 Pause Before or at the Failure
3 min
Pause Before or at the Failure
3 min
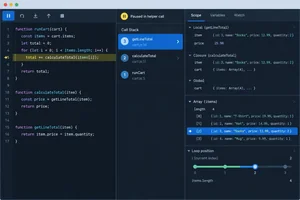 Inspect Values in the Right Frame
Inspect a paused runtime exception in Chrome DevTools, switch to the caller’s frame, and use Scope and Watch evidence to explain an undefined helper argument. 3 min
Inspect Values in the Right Frame
Inspect a paused runtime exception in Chrome DevTools, switch to the caller’s frame, and use Scope and Watch evidence to explain an undefined helper argument. 3 min
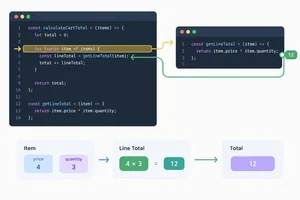 Trace Execution with Step Controls
Use Chrome debugger step controls to enter the cart helper, return to the loop, and observe one iteration's state changes. 3 min
Trace Execution with Step Controls
Use Chrome debugger step controls to enter the cart helper, return to the loop, and observe one iteration's state changes. 3 min
 Test an Explanation and Fix the Cause
Use paused evidence to make a minimal loop-boundary correction and verify that it prevents the invalid helper call. 2 min
Test an Explanation and Fix the Cause
Use paused evidence to make a minimal loop-boundary correction and verify that it prevents the invalid helper call. 2 min
 Apply the Debugging Cycle and Recheck
Independently diagnose a non-throwing logic error and verify the correction against the original input and relevant edge cases. 4 min
Apply the Debugging Cycle and Recheck
Independently diagnose a non-throwing logic error and verify the correction against the original input and relevant edge cases. 4 min
Step 1 of 8
Run a local cart script, record its expected and observed behavior, and classify its initial failure.
Create a folder named debug-cart. In your own editor, create the two files below inside it: index.html and script.js. This is a static local page: no server, project download, or DOM code is needed.
Save as debug-cart/index.html.
<!doctype html>
<html lang="en">
<head>
  <meta charset="utf-8">
  <title>Debug Cart</title>
  <script src="script.js" defer></script>
</head>
<body>
  <h1>Debug Cart</h1>
</body>
</html>Save as debug-cart/script.js. Keep this initial version unchanged while you reproduce the failure.
const cart = [{ name: 'Notebook', price: 6, quantity: 2 }, { name: 'Pen', price: 2, quantity: 3 }];

function getLineTotal(item) {
  return item.price * item.quantity;
}

function calculateTotal(items) {
  let total = 0;

  for (let index = 0; index <= items.length; index += 1) {
    const item = items[index];
    const lineTotal = getLineTotal(item);
    total += lineTotal;
  }

  return total;
}

function runCart(items) {
  const total = calculateTotal(items);
  console.log('Total:', total);
}

runCart(cart);Uncaught TypeError: Cannot read properties of undefined (reading 'price')
at getLineTotal (script.js:4:15)
at calculateTotal (script.js:12:23)
at runCart (script.js:20:17)
at script.js:24:1Chrome wording, indentation, and some stack formatting can vary. The important evidence is the uncaught TypeError and the absence of any final `Total:` line.
A useful bug report is reproducible: it records a specific input, the expected result, and the observed result.
Open index.html in Google Chrome. Open Chrome DevTools and select Console. Then refresh the page so the saved script runs again.
For this input, the two cart lines should produce Total: 18. Instead, Console reports an uncaught TypeError, and no final Total: output appears. Record that difference before changing anything.
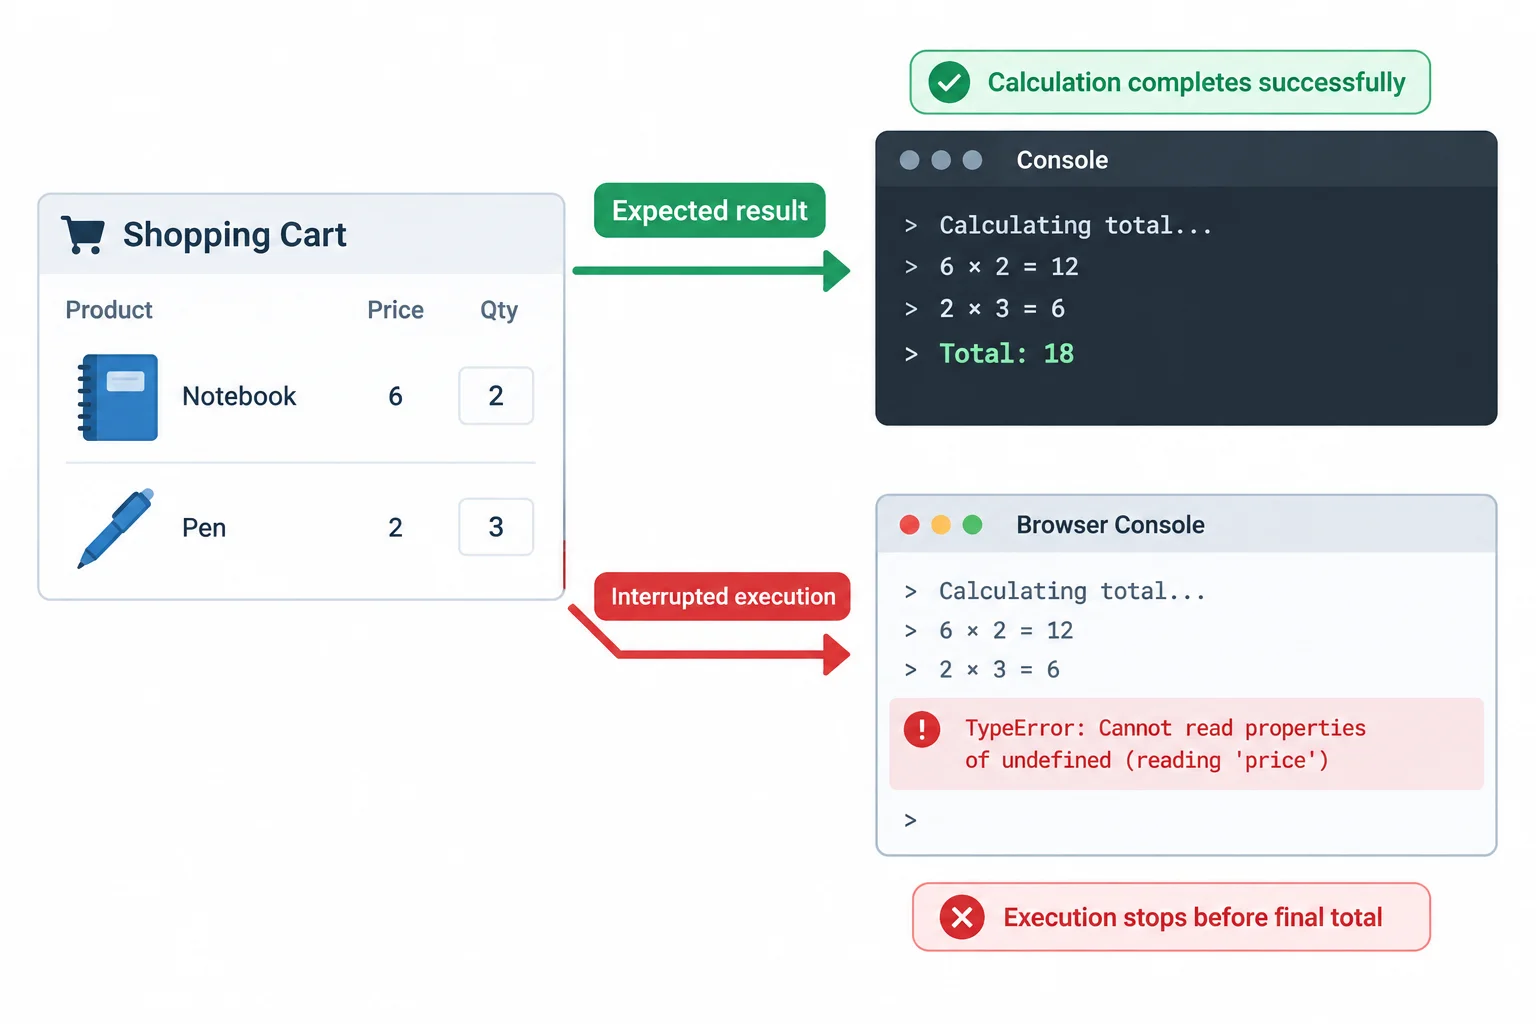
Use the same input each time: expected output is 18, while the initial script stops with a TypeError.
Use these three facts as the reproduction record.
| Part | Record |
|---|---|
| Input | The full two-item cart |
| Expected result | Total: 18 |
| Observed result | An uncaught TypeError; no final Total output |
Classify behavior before trying to fix it:
An error name is evidence, not a full explanation. Later, you will trace the failing code and test a specific explanation.
Each category answers a different question about what happened, not why it happened.
| Category | What you observe | Short example |
|---|---|---|
| syntax error | Script cannot start | A malformed function declaration |
| runtime exception | Execution starts, then stops | An uncaught TypeError in Console |
| logic error | Execution finishes with a wrong result | A total is computed incorrectly |
Match each observation to its failure category.
Tap an item and then its matching pair.
Step 2 of 8
Use Console evidence, source links, and stack order to locate the failed helper and its callers.
Keep the initial runtime-error version of script.js open. This reference fixes the line numbers used in this step; do not change it yet.
The script that produced the Console failure
const cart = [{ name: 'Notebook', price: 6, quantity: 2 }, { name: 'Pen', price: 2, quantity: 3 }];
function getLineTotal(item) {
return item.price * item.quantity;
}
function calculateTotal(items) {
let total = 0;
for (let index = 0; index <= items.length; index += 1) {
const item = items[index];
const lineTotal = getLineTotal(item);
total += lineTotal;
}
return total;
}
function runCart(items) {
const total = calculateTotal(items);
console.log('Total:', total);
}
runCart(cart);Uncaught TypeError: Cannot read properties of undefined (reading 'price')
at getLineTotal (script.js:4:15)
at calculateTotal (script.js:12:23)
at runCart (script.js:20:17)
at script.js:24:1Chrome wording can vary slightly. The source locations shown here correspond to this displayed file version.
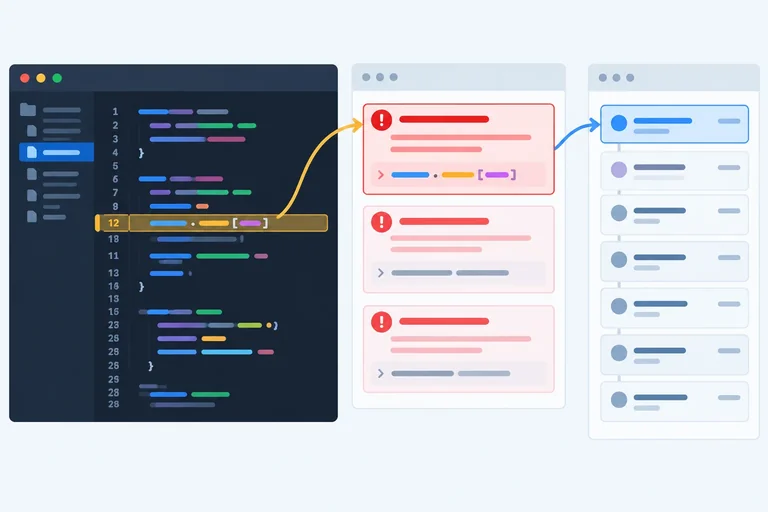
Read a Console report as three separate clues. TypeError is the error name; it identifies a kind of invalid operation. Cannot read properties of undefined (reading 'price') is the message; it describes the failed operation. script.js:4:15 is the source location; it points to the relevant statement.
Click that source link in Console. Chrome opens Sources at the property read on line 4. This tells you where the exception occurred, not yet why item had that value.
Error names are clues, not complete diagnoses. A SyntaxError prevents parsing, a ReferenceError involves an unavailable binding, and a TypeError means an operation does not fit the current value.
Use all three parts together; the source location is the fastest route from a Console report to code.
| Console part | Meaning | Useful question |
|---|---|---|
| Error name | Broad kind of failure | What kind of operation failed? |
| Message | Specific failed operation | What value or operation is involved? |
| Source location | File, line, and column | Which statement should I inspect? |
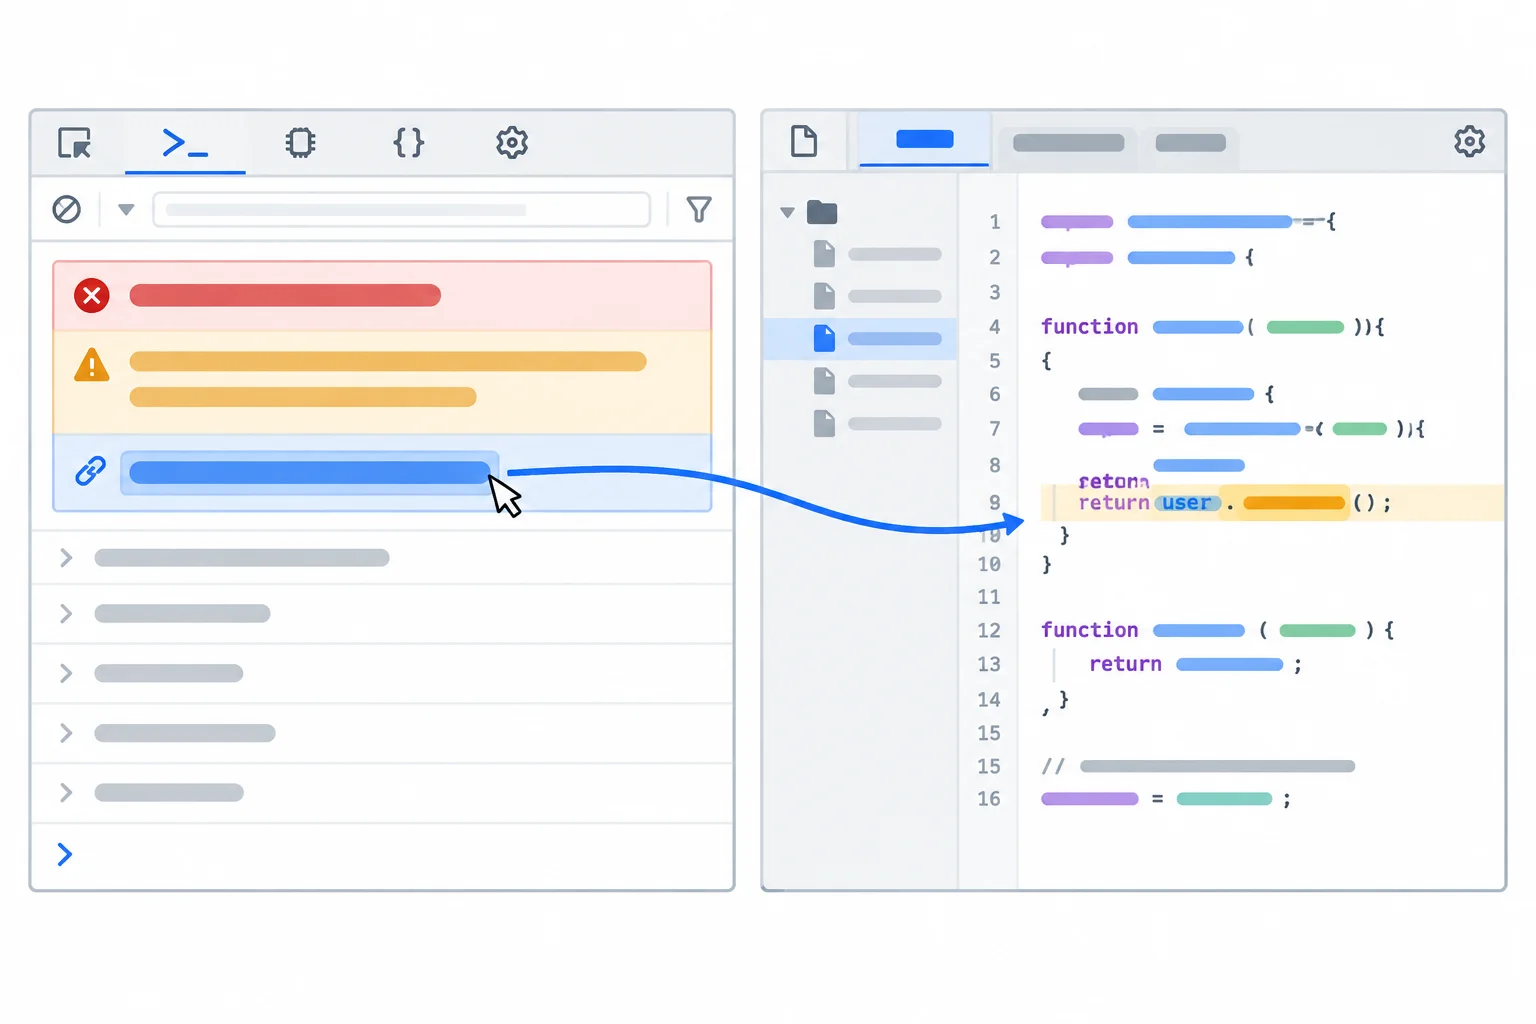
Treat the location link as a route to the failing statement; use the name and message to decide what to investigate there.
The stack trace records the synchronous call path from the most recent call outward. For this script, read from the top helper entry back through its callers:
getLineTotal is where the exception occurs: script.js:4:15.calculateTotal immediately called that helper at script.js:12:23.runCart called calculateTotal at script.js:20:17.script.js:24:1.The top stack entry identifies the failed helper. The next entry identifies its immediate caller.
Example
Console wording and columns can differ slightly by Chrome version. The important pattern is the ordered function path and the source link beside each entry.
Uncaught TypeError: Cannot read properties of undefined (reading 'price')
    at getLineTotal (script.js:4:15)
    at calculateTotal (script.js:12:23)
    at runCart (script.js:20:17)
    at script.js:24:1
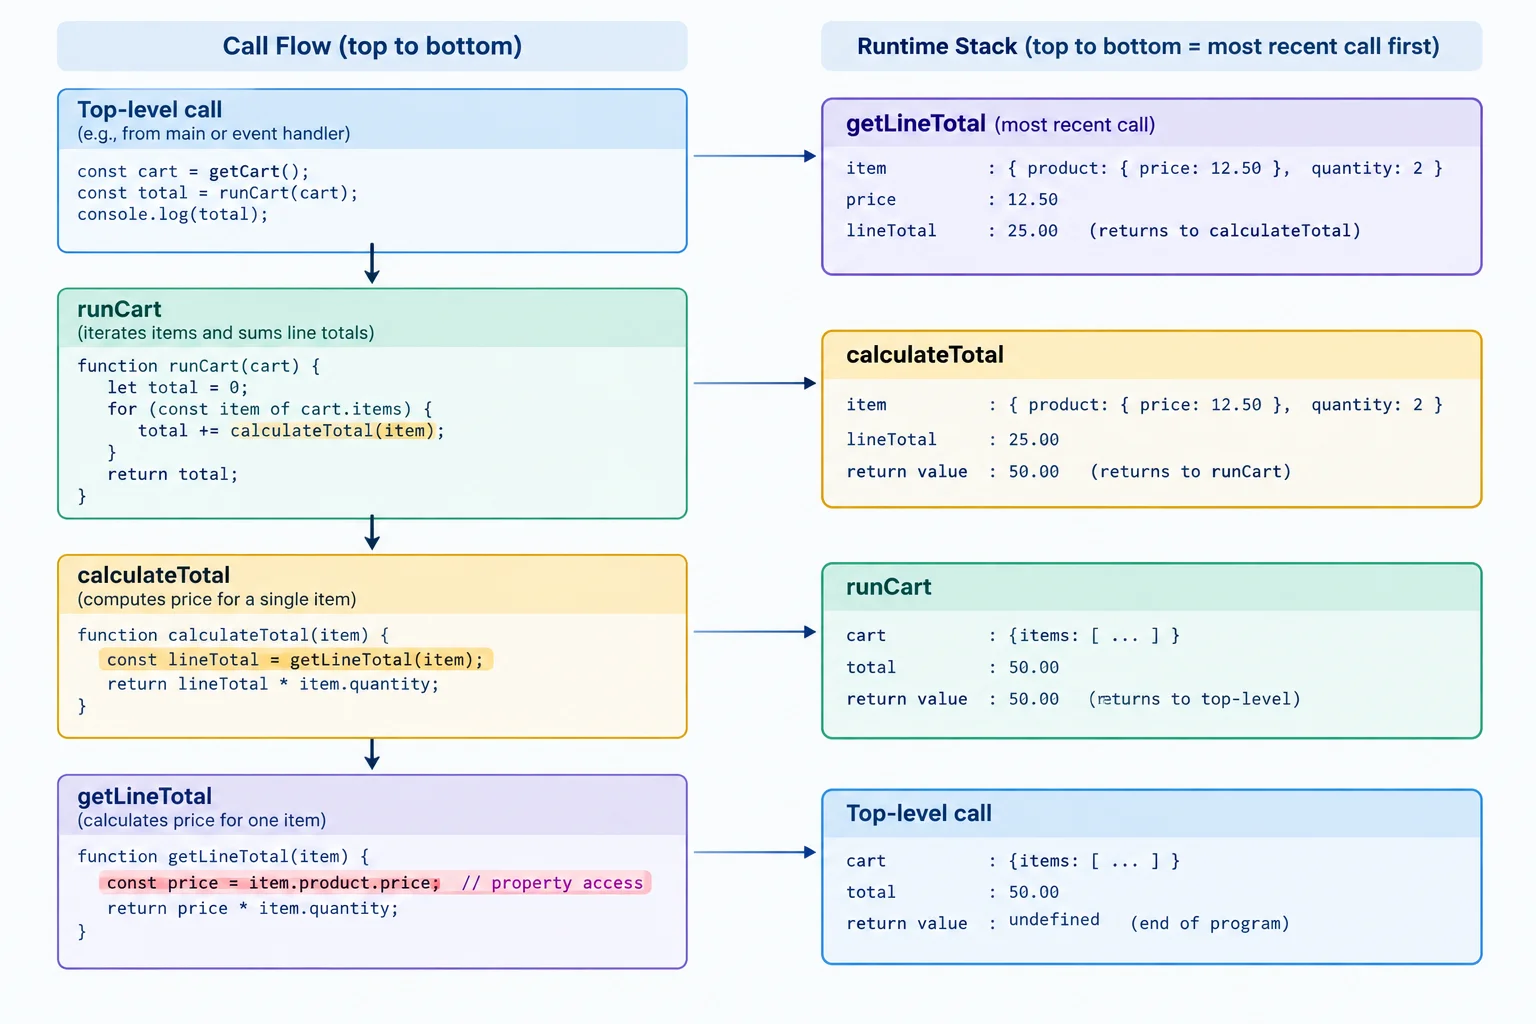
Execution flows inward to getLineTotal; the runtime stack reports the active calls outward, starting with that failing helper.
Tip
Do not equate the exception line with the original cause. Line 4 is where reading price fails. The caller entry on line 12 shows where getLineTotal(item) was invoked. To investigate how its argument was obtained, inspect the earlier assignment on line 11 as a possible source of the value.
Keep the distinction: failure site versus an earlier operation that may have supplied a bad value.
Match each Console or stack-trace fragment to its role.
Tap an item and then its matching pair.
Step 3 of 8
Add a safe, targeted Console log to reveal the value reaching the failing cart helper.
Before adding any log, choose one question that could separate a guess from evidence:
Does every loop iteration supply an item to getLineTotal?
The loop already has the values needed to answer it. Immediately before the helper call, record:
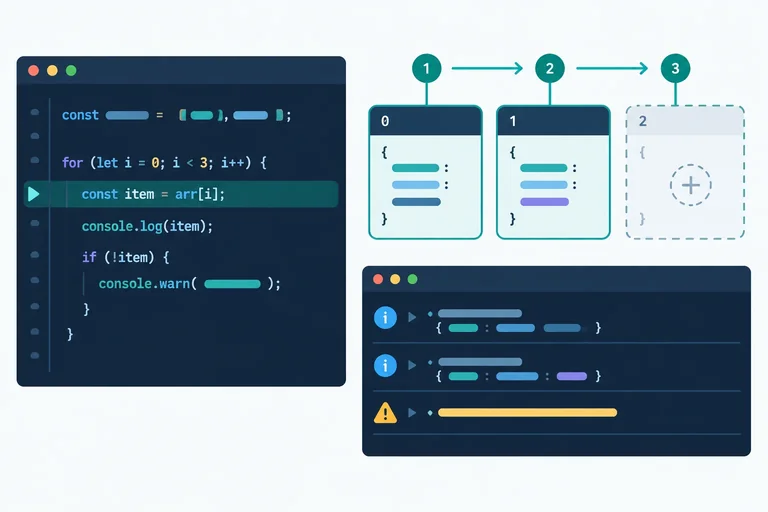
items.length — the array boundaryindex — the current positiontypeof item — a safe description of the value being passedThis is focused evidence, not a permanent transcript of every value in the program.
The diagnostic log compares the loop index with the array length and safely reports the type of the value about to enter the helper.
Tip
Use short labels and primitive values. typeof item is safe even when item is undefined; avoid a log such as item.name, which would create another property-access failure at the very moment you need evidence.
In script.js, add one temporary log after const item = items[index]; and before the helper call. In this displayed version, the log is at script.js:12:5 and the helper call is at script.js:13:23.
Save the file, reload the local page in Chrome, and read the entries in the Console from top to bottom. Keep index.html unchanged.
Save this diagnostic version of script.js, then reload the local HTML page.
const cart = [{ name: 'Notebook', price: 6, quantity: 2 }, { name: 'Pen', price: 2, quantity: 3 }];
function getLineTotal(item) {
return item.price * item.quantity;
}
function calculateTotal(items) {
let total = 0;
for (let index = 0; index <= items.length; index += 1) {
const item = items[index];
console.log('Check:', 'length', items.length, 'index', index, 'item type', typeof item);
const lineTotal = getLineTotal(item);
total += lineTotal;
}
return total;
}
function runCart(items) {
const total = calculateTotal(items);
console.log('Total:', total);
}
runCart(cart);Check: length 2 index 0 item type object
Check: length 2 index 1 item type object
Check: length 2 index 2 item type undefined
Uncaught TypeError: Cannot read properties of undefined (reading 'price')
at getLineTotal (script.js:4:15)
at calculateTotal (script.js:13:23)
at runCart (script.js:21:17)
at script.js:25:1Chrome may format Console entries slightly differently, but the sequence, values, and absence of the final Total line are the important evidence.
Complete the expression that makes this diagnostic log safe for every loop iteration.
for (let index = 0; index <= items.length; index += 1) {
const item = items[index];
console.log('Check:', 'length', items.length, 'index', index, 'item type', );
const lineTotal = getLineTotal(item);
total += lineTotal;
}Run the completed diagnostic version in your own local page. Then record the evidence in one short response:
console.log line you used.Do not change the loop condition yet. This screen is about collecting evidence, not applying a correction.
Write at least 80 characters (0/80).
Step 4 of 8
Step 3 used a temporary diagnostic log. Before setting a breakpoint, restore one canonical source state: replace the entire contents of debug-cart/script.js with the version below and save it. This removes the temporary log and restores the line map used in the next steps.
Keep index.html unchanged. The saved script still throws, so it is ready for a controlled investigation.
Save this as the complete contents of debug-cart/script.js.
const cart = [{ name: 'Notebook', price: 6, quantity: 2 }, { name: 'Pen', price: 2, quantity: 3 }];

function getLineTotal(item) {
  return item.price * item.quantity;
}

function calculateTotal(items) {
  let total = 0;

  for (let index = 0; index <= items.length; index += 1) {
    const item = items[index];
    const lineTotal = getLineTotal(item);
    total += lineTotal;
  }

  return total;
}

function runCart(items) {
  const total = calculateTotal(items);
  console.log('Total:', total);
}

runCart(cart);Uncaught TypeError: Cannot read properties of undefined (reading 'price')
at getLineTotal (script.js:4:15)
at calculateTotal (script.js:12:23)
at runCart (script.js:20:17)
at script.js:24:1Chrome Console wording and stack formatting can vary slightly. The important locations are the property read at `script.js:4:15` and its helper-call entry at `script.js:12:23`.
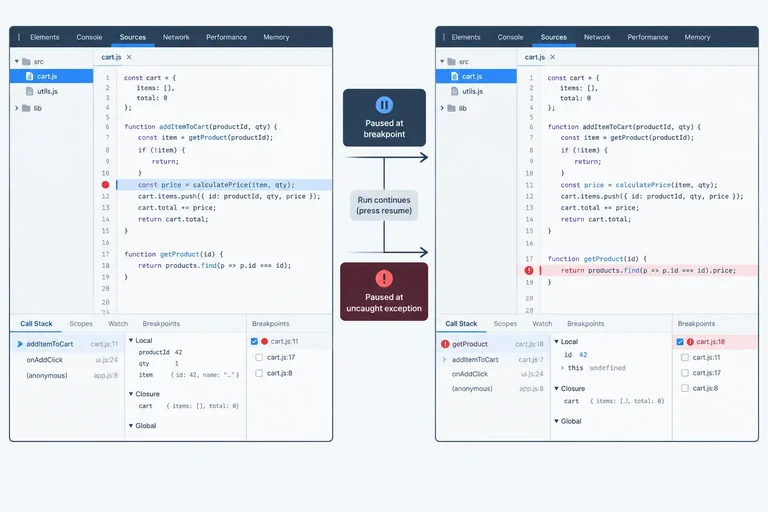
Use a source breakpoint when you want to stop before a statement in a suspected region. In DevTools, open Sources, select script.js, and click the gutter beside const lineTotal = getLineTotal(item); at script.js:12:23.
A source breakpoint pauses before its selected statement executes. The local page already ran its deferred script when it opened, so reload the page after setting the breakpoint. The statement is highlighted when execution pauses, and getLineTotal(item) has not run yet.
Choose Resume script execution to continue the current run until another pause or until execution finishes.
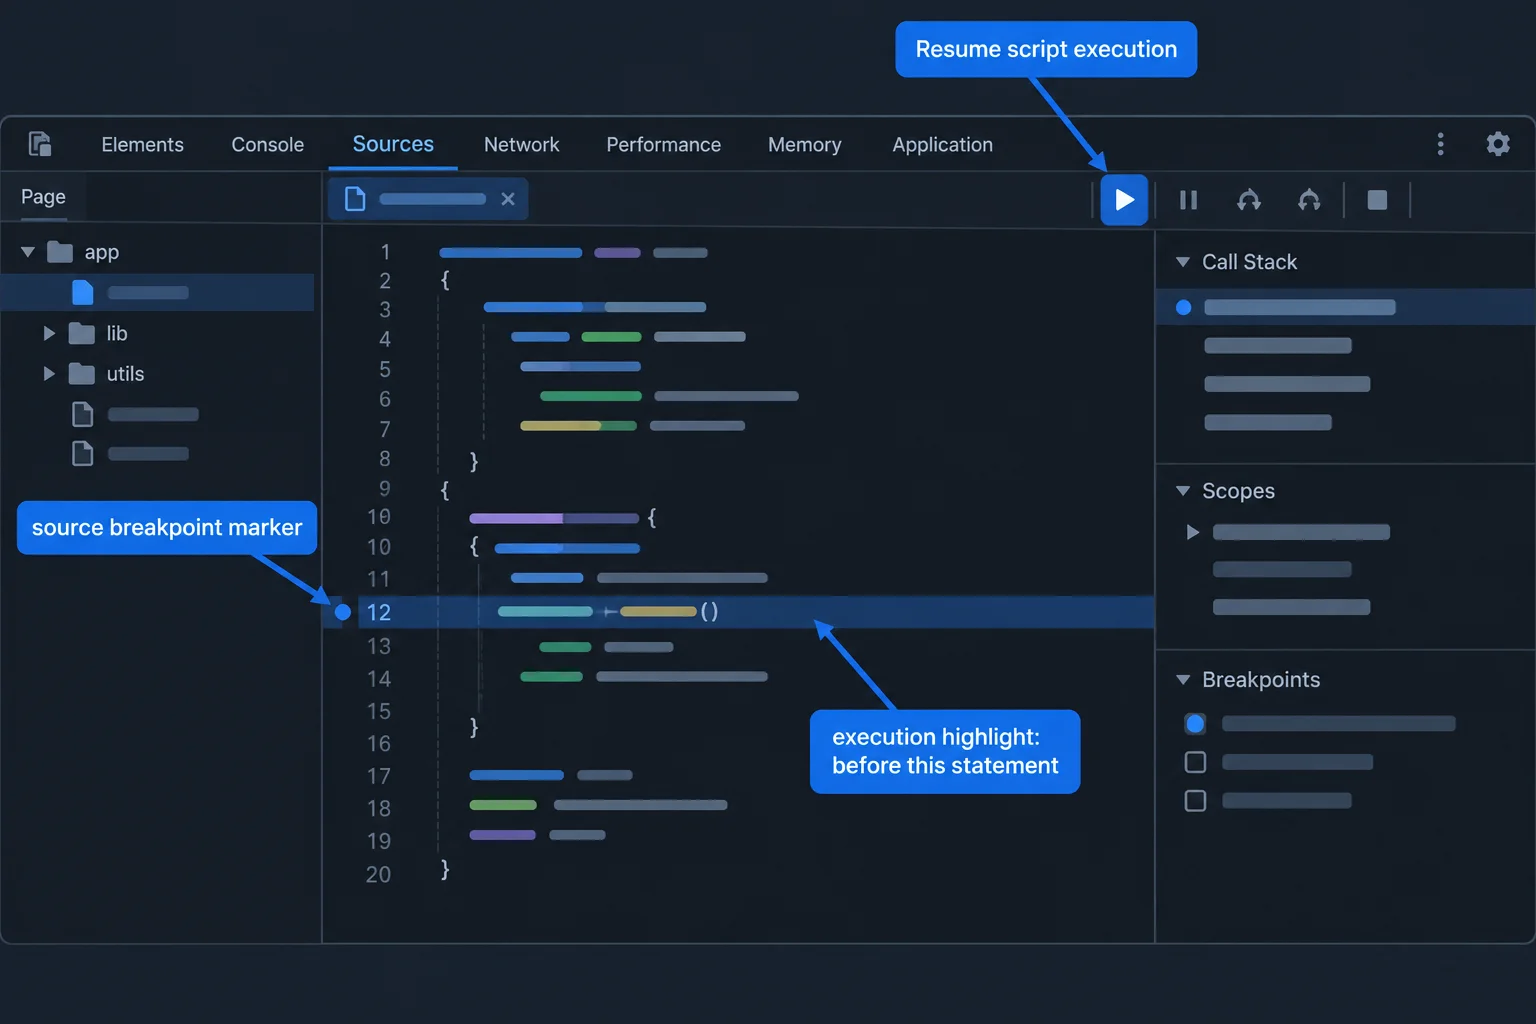
A source breakpoint stops before the highlighted helper-call statement executes.
Use Pause on uncaught exceptions when you expect a runtime exception but do not want to select a suspected line first.
For a separate exception investigation, disable the source breakpoint by clicking its gutter marker. In Sources, enable Pause on uncaught exceptions, then reload the local page. DevTools pauses at the throwing property read in getLineTotal: script.js:4:15.
This pause identifies where the exception occurs. It does not by itself establish which earlier operation supplied the invalid value. Use a source breakpoint to inspect a known region; use an uncaught-exception pause to locate a thrown failure whose location is not yet known.
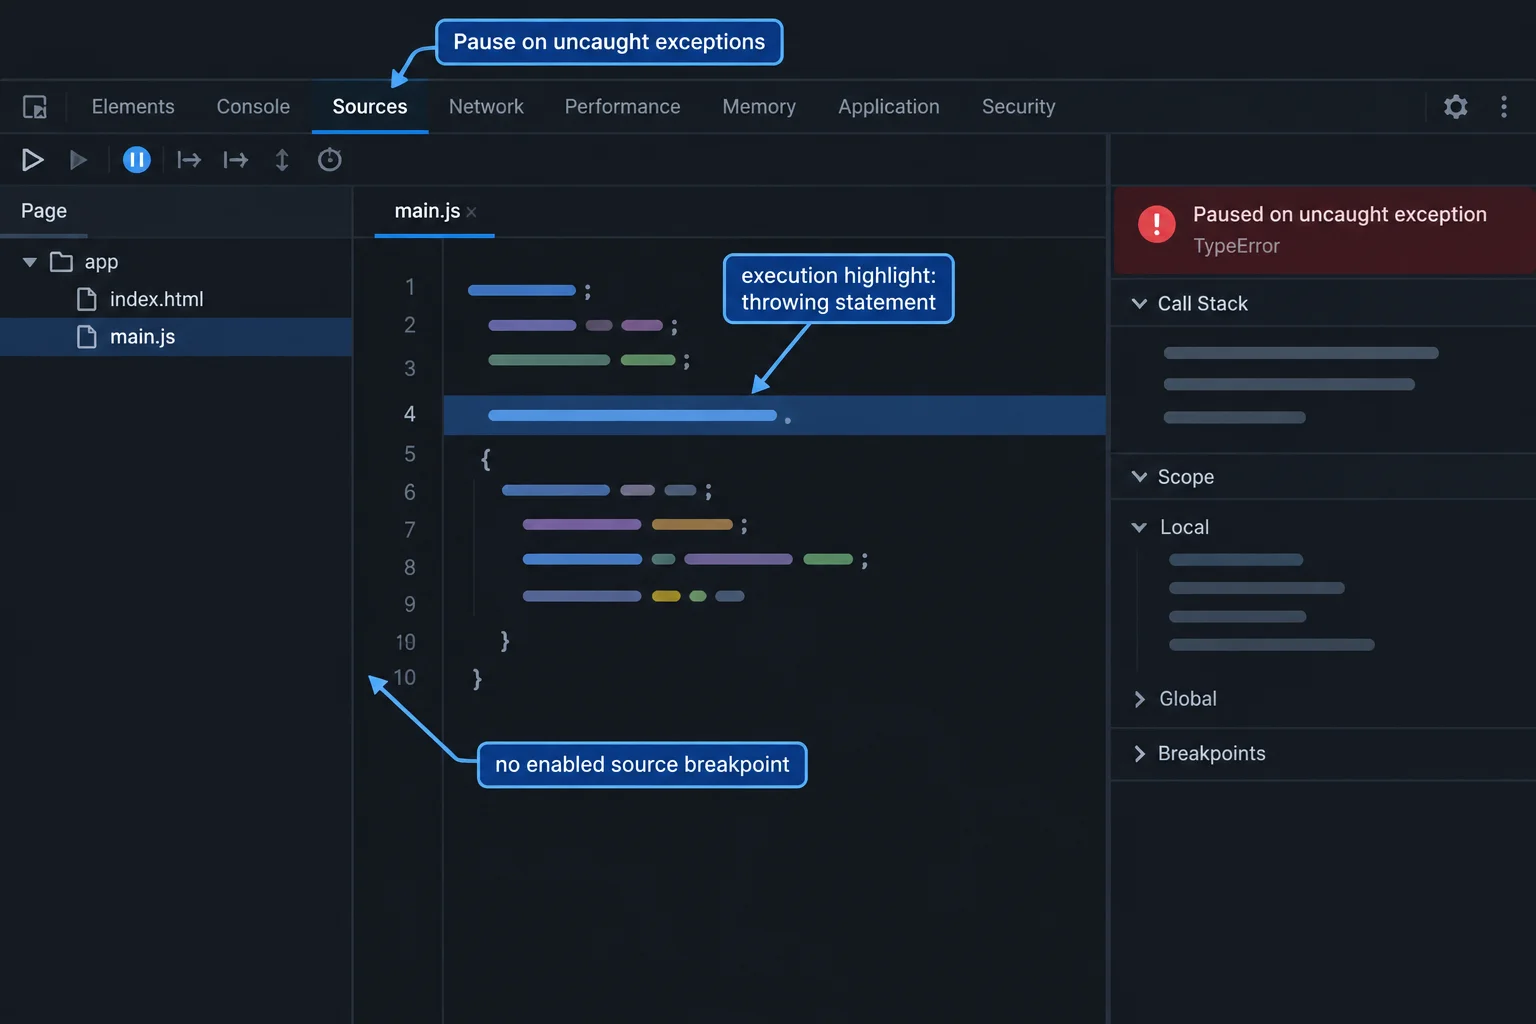
With no enabled line breakpoint, the exception setting stops at the statement that throws.
Both methods require a reload when the page's script has already run, but they answer different questions.
| Investigation situation | Pause mechanism | Where execution stops |
|---|---|---|
| The helper call at script.js:12:23 is a suspected region | source breakpoint | Before the selected helper-call statement |
| An uncaught runtime exception is expected, but its location is unknown | Pause on uncaught exceptions | At the throwing statement: script.js:4:15 |
You have two separate investigations: inspect a known helper call at script.js:12:23, then locate an uncaught runtime exception whose location is unknown. Which pairing is appropriate?
Arrange this complete two-pass investigation of the local script in the required order.
Step 5 of 8
Inspect a paused runtime exception in Chrome DevTools, switch to the caller’s frame, and use Scope and Watch evidence to explain an undefined helper argument.
With the canonical initial script.js still saved, enable Pause on uncaught exceptions in Sources and reload the local page. Chrome pauses in getLineTotal at the failing property read, script.js:4:15.
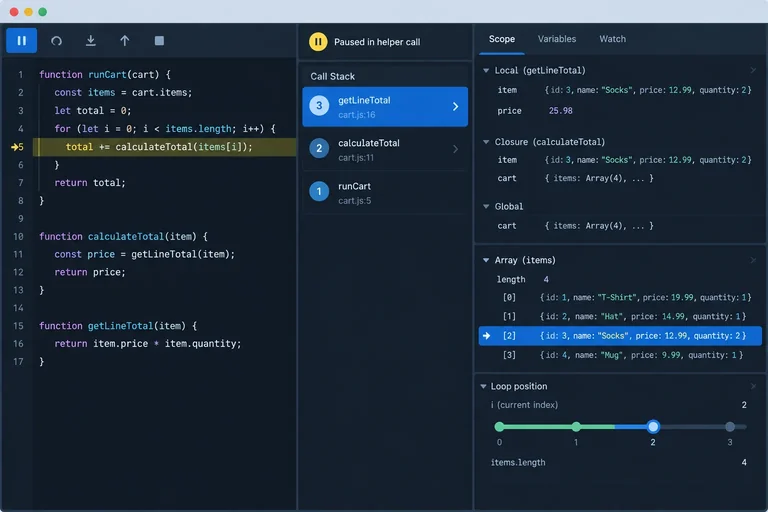
The initially selected paused frame is getLineTotal. In Scope, inspect its item parameter. Its value is undefined, so the helper received an invalid argument before it attempted to read item.price.
This establishes what failed in the helper. Next, inspect the caller to learn which loop state supplied that argument.
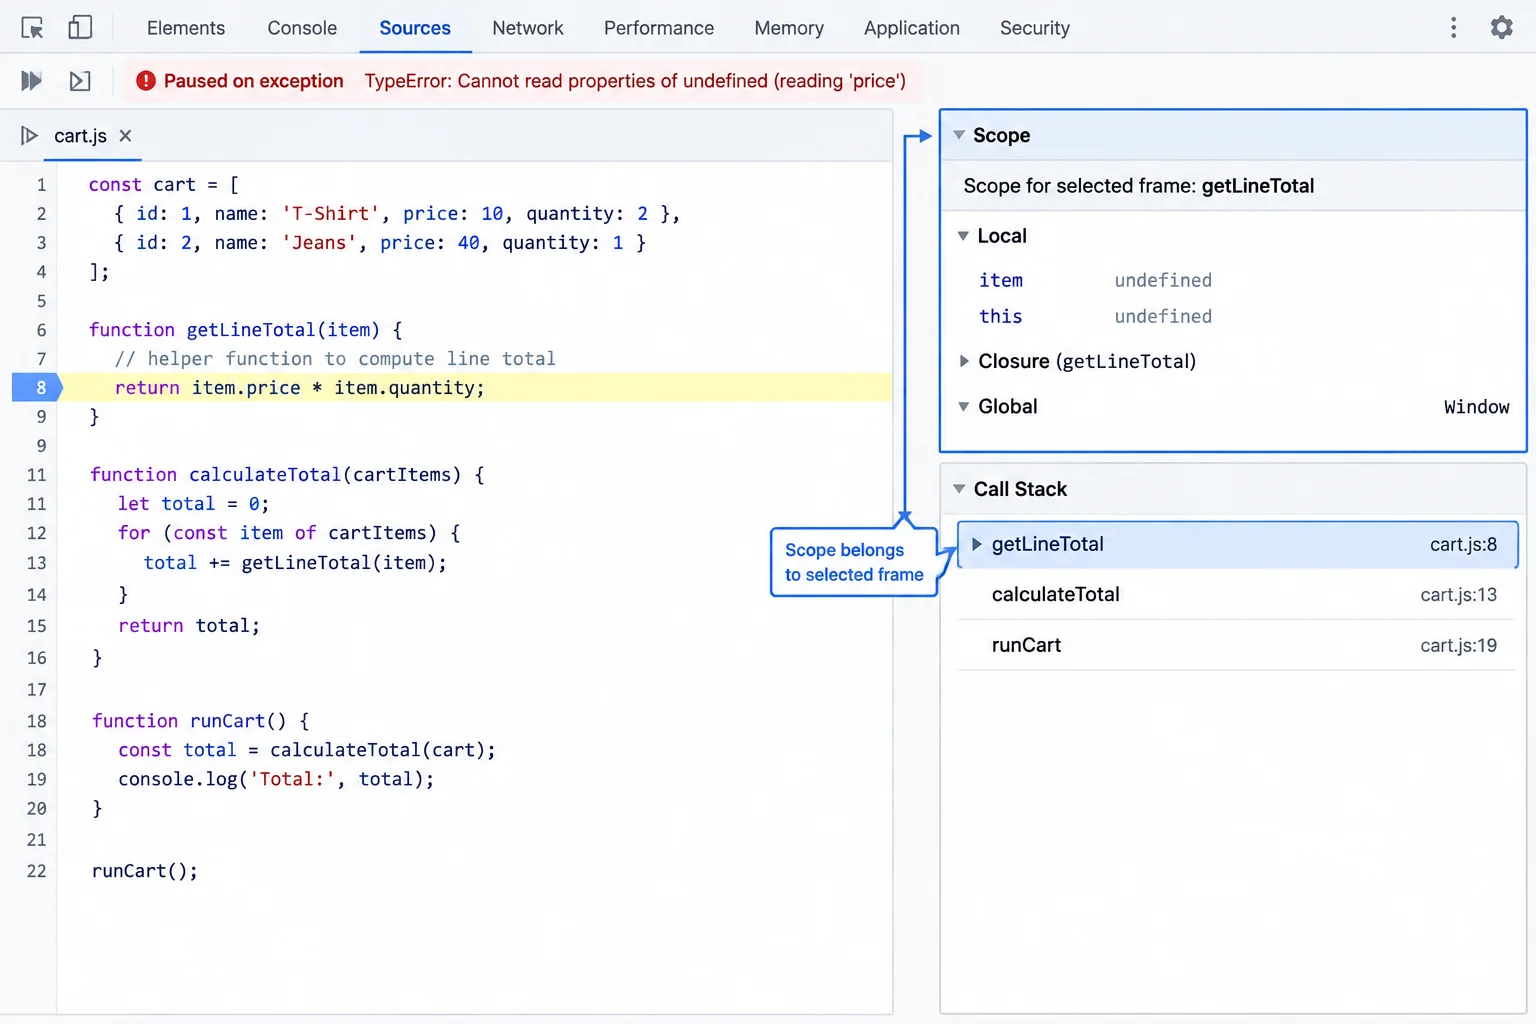
Scope shows bindings for the currently selected paused frame.
In Call Stack, select calculateTotal, the caller listed below getLineTotal. The script remains paused at the same exception; selecting a frame changes only the inspection context. It does not run code, retry the helper call, or move execution backward.
Now Scope shows the caller's local bindings. At this pause, inspect these values:
index is 2.items is an array with length 2.item is undefined.total is 18, accumulated from the first two lines.The lookup on script.js:11:18, items[index], therefore has no array element to supply. The next statement, getLineTotal(item) at script.js:12:23, passes that undefined value into the helper.
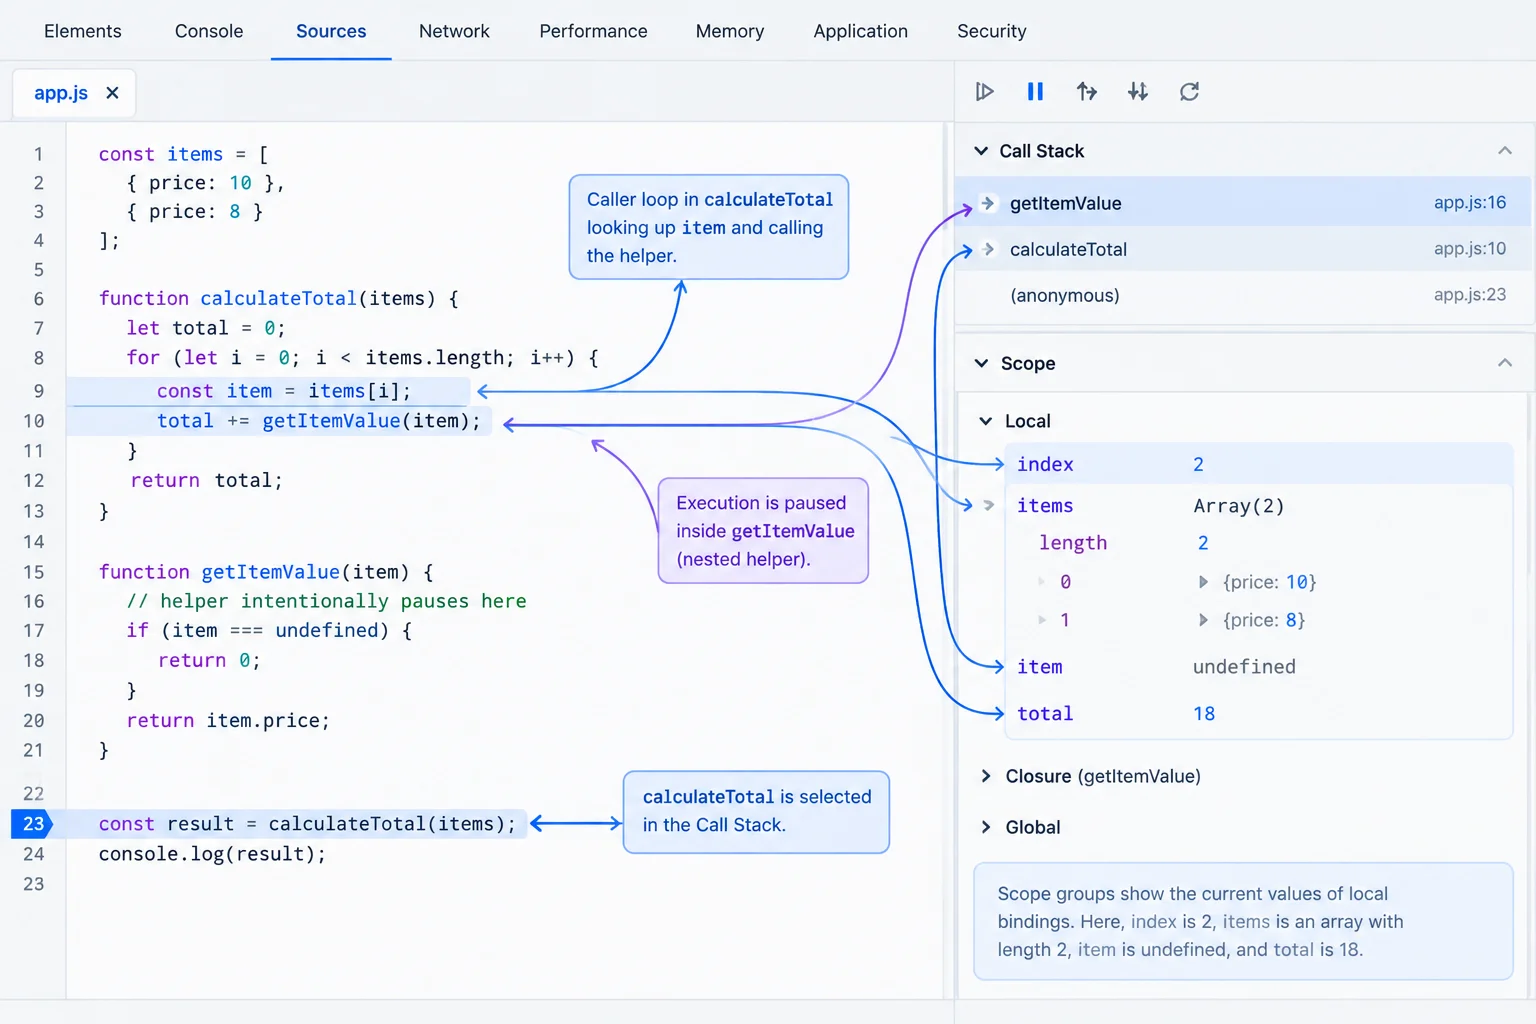
Frame selection exposes the caller's loop state without changing the paused execution point.
Does selecting calculateTotal in Call Stack execute the caller again?
No. It only changes which paused frame Scope and expression inspection use. Execution stays paused until you use a debugger control.
Use Watch for small, side-effect-free expressions that answer a focused question. With the calculateTotal frame selected, add these expressions one at a time in the Watch pane:
items.length checks the array boundary.items[index] checks the current array lookup.At this pause, they show 2 and undefined. These values agree with Scope: the current index is at the boundary, so the lookup cannot provide a cart item.
A Watch expression depends on the selected frame's lexical bindings. If you select getLineTotal, items.length can be unavailable because items is not a binding in that helper. That is a scope-context clue, not evidence of a new program bug. Do not use expressions that change values while investigating.
With calculateTotal selected in Call Stack, complete the two Watch expressions.
items.
items[]Match each investigation need to the frame, Watch completion, or evidence-based conclusion that satisfies it.
Tap an item and then its matching pair.
Step 6 of 8
Use Chrome debugger step controls to enter the cart helper, return to the loop, and observe one iteration's state changes.
Use the original failing version of script.js below. Set a source breakpoint at script.js:11:5, on const item = items[index];, then reload the local page in Chrome.
The first pause is a valid iteration: index is 0. A line breakpoint pauses before its statement runs. Do not try to step backward from the later runtime exception. Reloading starts a fresh trace at the first loop pass.
Current script.js — do not change it in this step.
const cart = [{ name: 'Notebook', price: 6, quantity: 2 }, { name: 'Pen', price: 2, quantity: 3 }];

function getLineTotal(item) {
  return item.price * item.quantity;
}

function calculateTotal(items) {
  let total = 0;

  for (let index = 0; index <= items.length; index += 1) {
    const item = items[index];
    const lineTotal = getLineTotal(item);
    total += lineTotal;
  }

  return total;
}

function runCart(items) {
  const total = calculateTotal(items);
  console.log('Total:', total);
}

runCart(cart);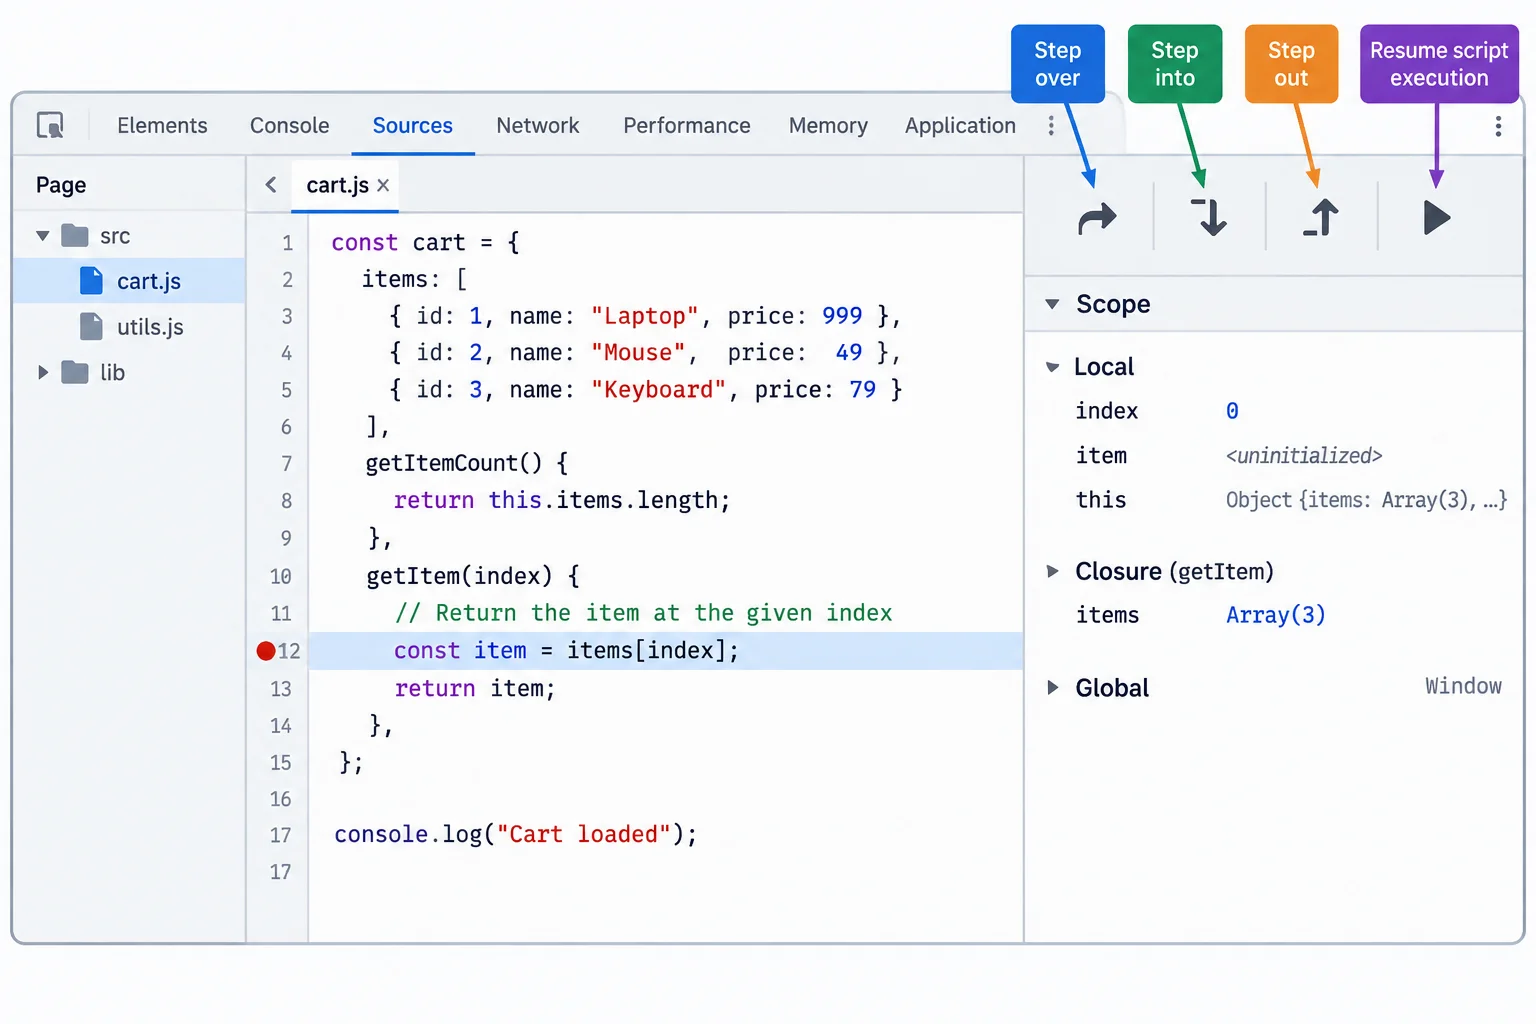
The execution highlight marks the statement that will run next. The breakpoint marker remains on that source line.
Watch how a controlled trace moves through one valid cart iteration.
Stepping is deliberate and local: follow the helper when its calculation matters, then return to the caller to see loop progress.
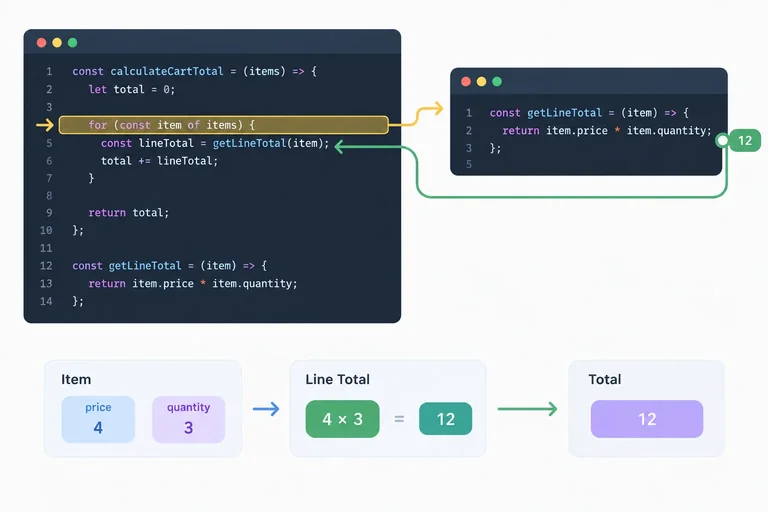
Step over reaches the helper call. Step into opens getLineTotal. Step out returns to calculateTotal. Step over the accumulation advances the loop.
With the breakpoint still enabled on line 11, use the controls in this sequence to observe one valid iteration. Source locations refer to the displayed script.js version.
| Control | Use it while paused at | Next location | Evidence to inspect |
|---|---|---|---|
| Step over | script.js:11:5 | script.js:12:23 | item is the Notebook record |
| Step into | script.js:12:23 | getLineTotal at script.js:4:10 | helper item parameter |
| Step out | helper return statement | script.js:13:5 | lineTotal is available to caller |
| Step over | script.js:13:5 | script.js:11:5 on next pass | total is 12; index is 1 |
| Resume script execution | any paused frame | next pause event | continues freely, not one statement at a time |
You are paused inside getLineTotal and want to return to calculateTotal to inspect the accumulation there. Which debugger control is specifically intended for that goal?
Use your local page and the breakpoint at the first loop assignment. Trace the first valid iteration.
Before clicking each control, write your prediction. Then perform the trace and compare it with the Sources highlight:
index, lineTotal, and total.Finish by stating whether your predictions matched the local trace.
Write at least 180 characters (0/180).
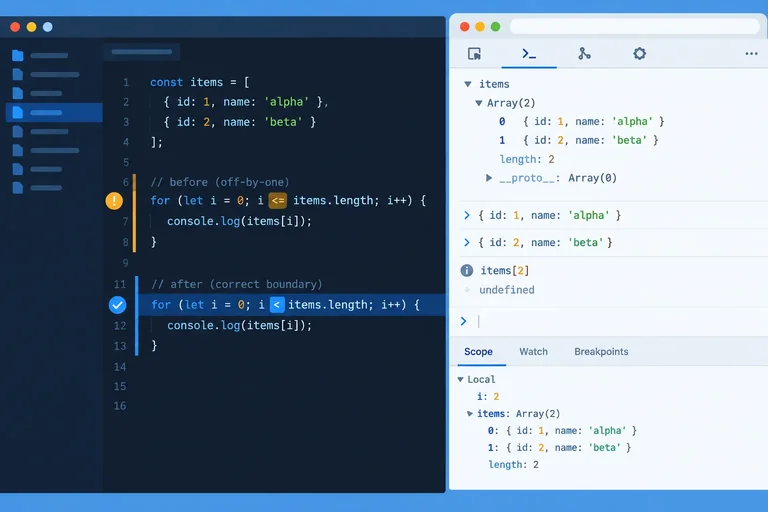
Step 7 of 8
Use paused evidence to make a minimal loop-boundary correction and verify that it prevents the invalid helper call.
You already observed the key facts in the paused calculateTotal frame: index was 2, items.length was 2, and item was undefined.
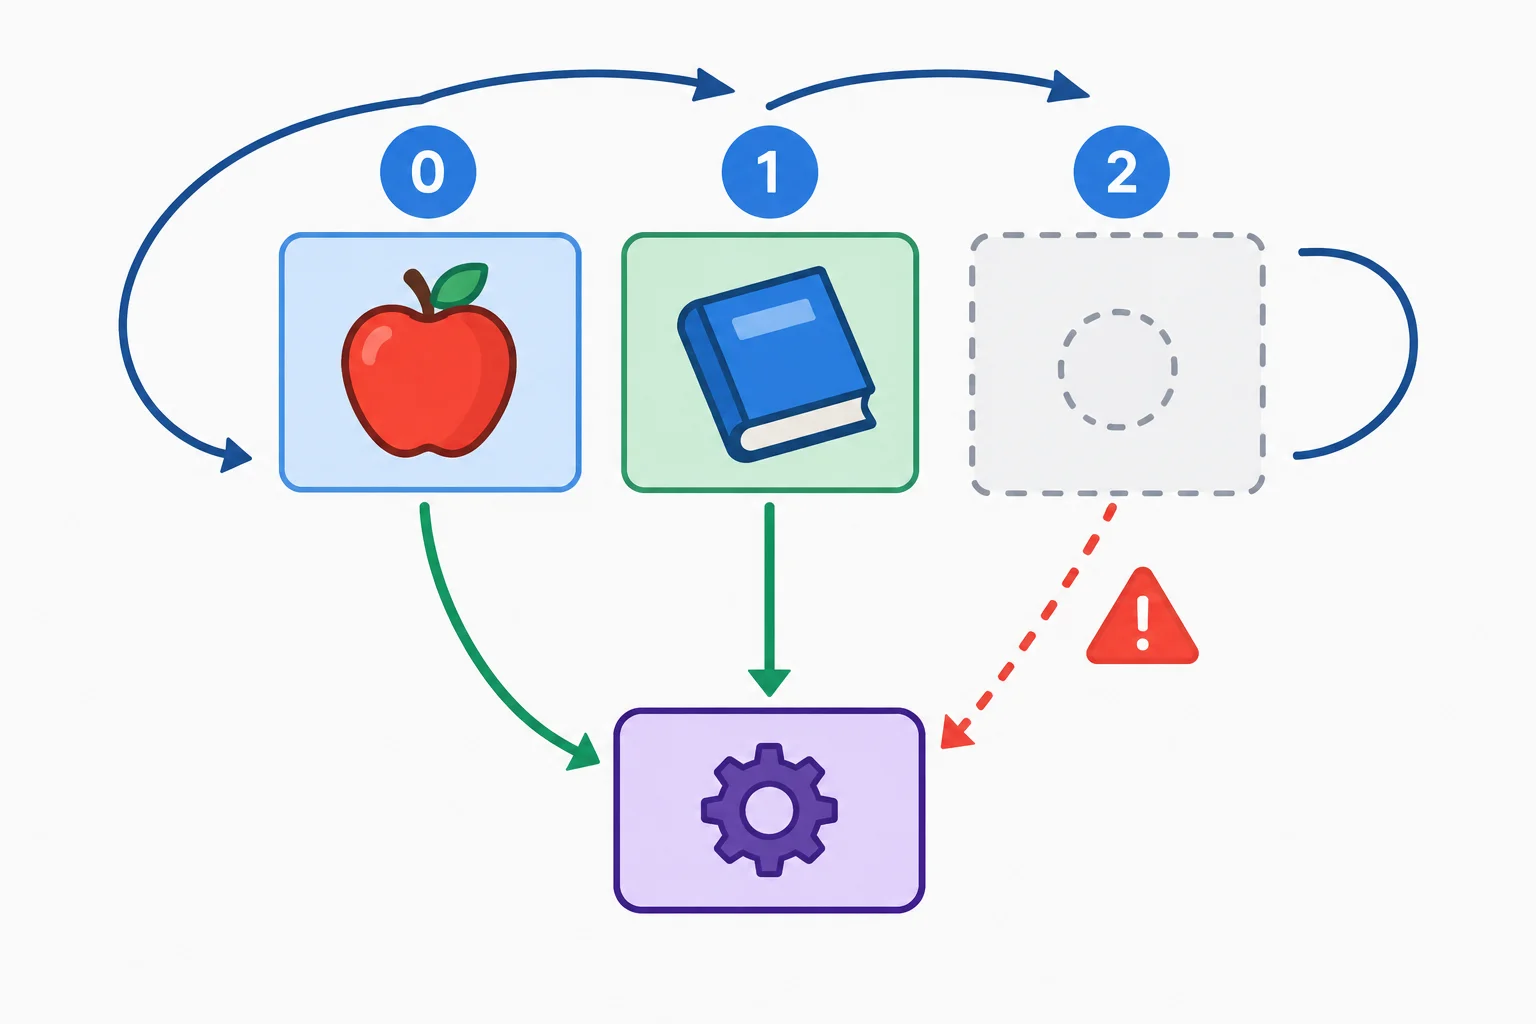
Turn those facts into a testable explanation: the continuation condition permits an iteration when the index has reached the array boundary. That iteration reads items[2], but a two-item array has valid indexes 0 and 1 only.
Predict the effect before editing:
0 and 1 only.undefined.Total: 18.This is a specific causal explanation, not merely “the loop is broken.”
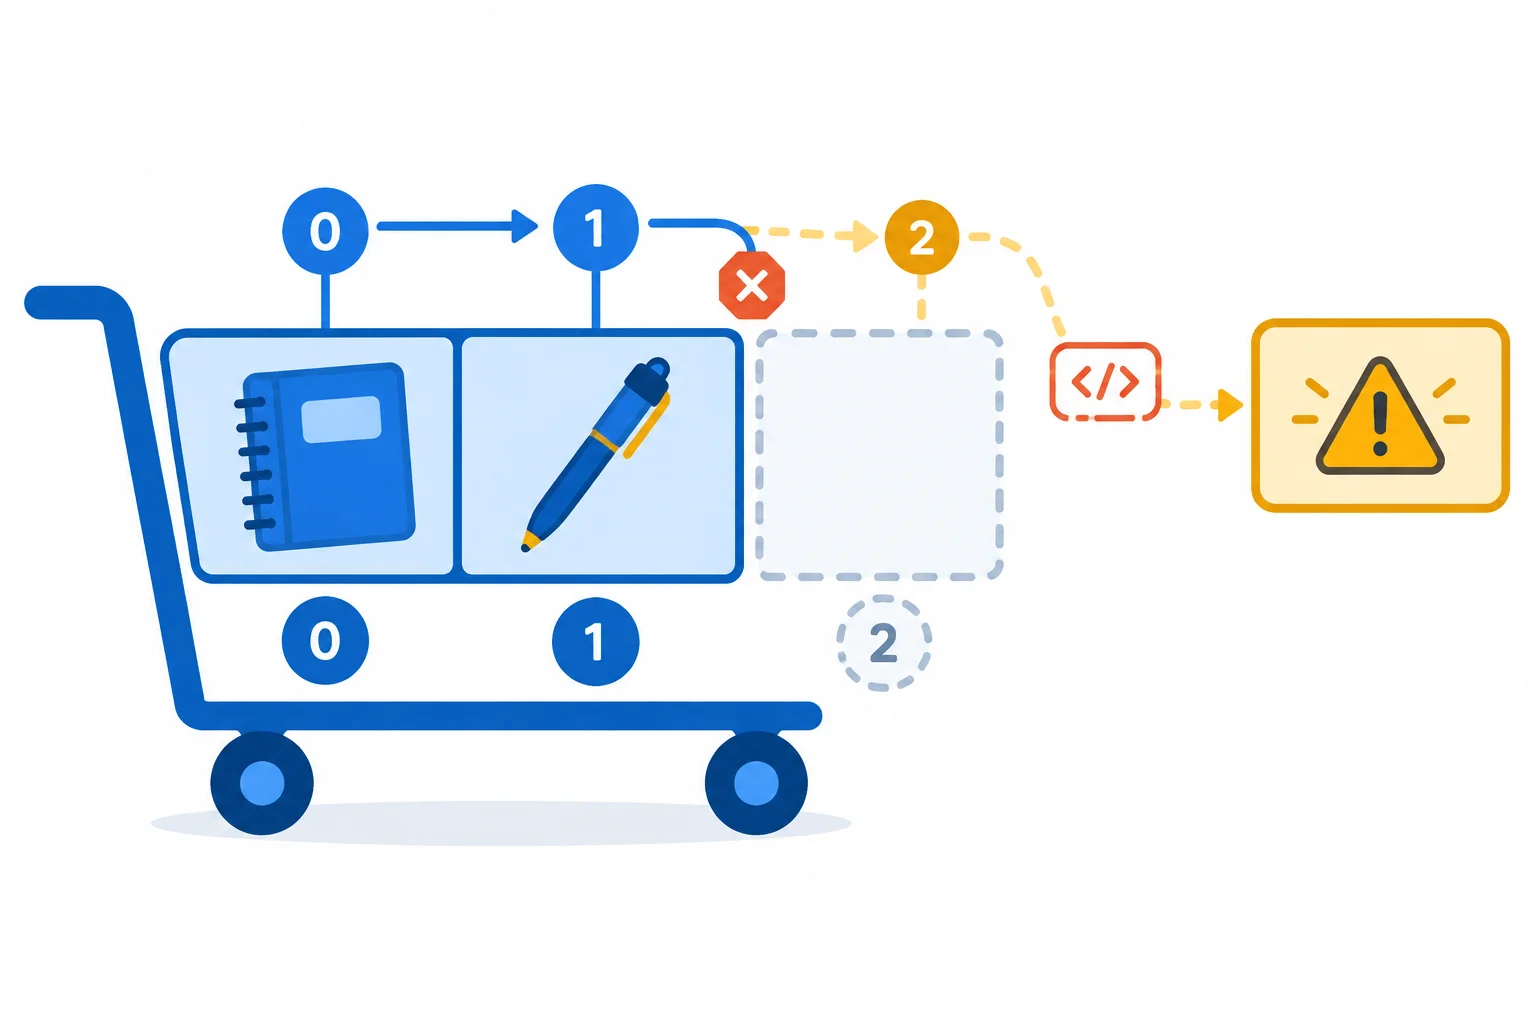
An index equal to the array length is outside this two-item array.
In the canonical initial file, the comparison begins at script.js:10:29; the removable = is specifically at script.js:10:30. Replace the complete contents of your local debug-cart/script.js with this corrected version, save it, then reload index.html in Chrome. Disable any source breakpoint left from the previous trace before this reload.
const cart = [{ name: 'Notebook', price: 6, quantity: 2 }, { name: 'Pen', price: 2, quantity: 3 }];

function getLineTotal(item) {
  return item.price * item.quantity;
}

function calculateTotal(items) {
  let total = 0;

  for (let index = 0; index < items.length; index += 1) {
    const item = items[index];
    const lineTotal = getLineTotal(item);
    total += lineTotal;
  }

  return total;
}

function runCart(items) {
  const total = calculateTotal(items);
  console.log('Total:', total);
}

runCart(cart);Total: 18
Console may retain entries from earlier reloads. The new run should include this final output and no uncaught TypeError.
Tip
This is a minimal causal correction: it changes the loop boundary and leaves the cart data, helper calculation, accumulation, and final log intact.
Do not hard-code 18, add a guard that silently skips an invalid item, or catch and hide the exception. Those changes could conceal the symptom while leaving the incorrect continuation condition in place.
Confirm the prediction with the debugger, not only with the absence of an error:
script.js and set a source breakpoint on const lineTotal = getLineTotal(item); at script.js:12:5.index.html. At the first pause, inspect index in Scope. It is 0.index, which is now 1.Total: 18.The missing third pause is evidence that execution never calls the helper with index 2.
Use both execution evidence and the final output for this input.
| Check | Initial failing run | Corrected run |
|---|---|---|
| Helper-call indexes | 0, 1, then 2 | 0, then 1 only |
| Argument at boundary | undefined at index 2 | No helper call at index 2 |
| Console outcome | TypeError; no final Total | Total: 18 |
| What the loop does | Permits index equal to length | Stops before index equals length |
Warning
Removing a runtime exception is necessary here, but it is not proof that every calculation is correct. The successful Total: 18 confirms this original input after the boundary fix. The next step uses additional cases to investigate a different, non-throwing logic error.
Complete the comparison that keeps each loop iteration within the array boundary.
for (let index = 0; index items.length; index += 1) {Write the corrected loop condition. Then explain how the observed index of 2, length of 2, and undefined helper argument support that source change instead of an error-suppressing workaround.
Write at least 120 characters (0/120).
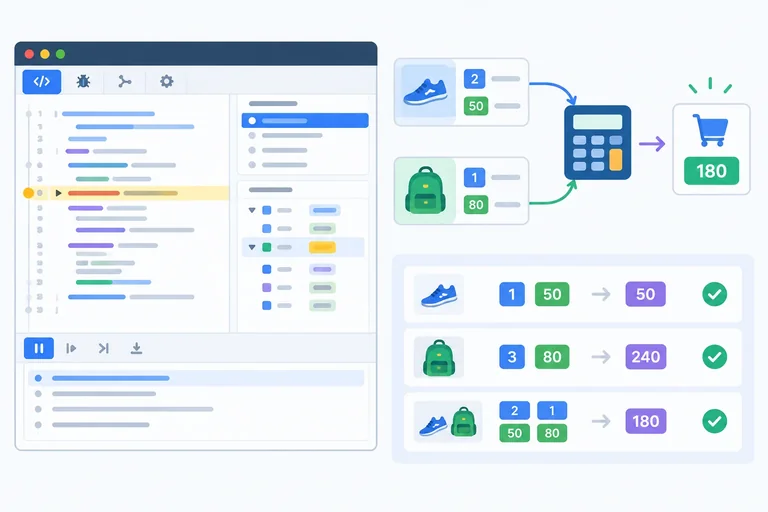
Step 8 of 8
Independently diagnose a non-throwing logic error and verify the correction against the original input and relevant edge cases.
Use the same local debug-cart folder. Keep the corrected loop, but replace the helper in script.js with this complete logic-error variation. Save the file, open index.html in Chrome, and open DevTools Console.
This script runs to completion, so there is no runtime exception. Its full-cart result is 13, even though the known total is 18. That mismatch is a logic error: execution succeeds, but the calculation is wrong.
Replace the contents of script.js, save, then refresh the local page.
const cart = [
  { name: 'Notebook', price: 6, quantity: 2 },
  { name: 'Pen', price: 2, quantity: 3 }
];

function getLineTotal(item) {
  return item.price + item.quantity;
}

function calculateTotal(items) {
  let total = 0;

  for (let index = 0; index < items.length; index += 1) {
    const item = items[index];
    const lineTotal = getLineTotal(item);
    total += lineTotal;
  }

  return total;
}

function runCart(items) {
  const total = calculateTotal(items);
  console.log('Total:', total);
}

runCart(cart);
runCart([cart[0]]);
runCart([]);Total: 13 Total: 8 Total: 0
The three lines appear in Console in this order after one page refresh.
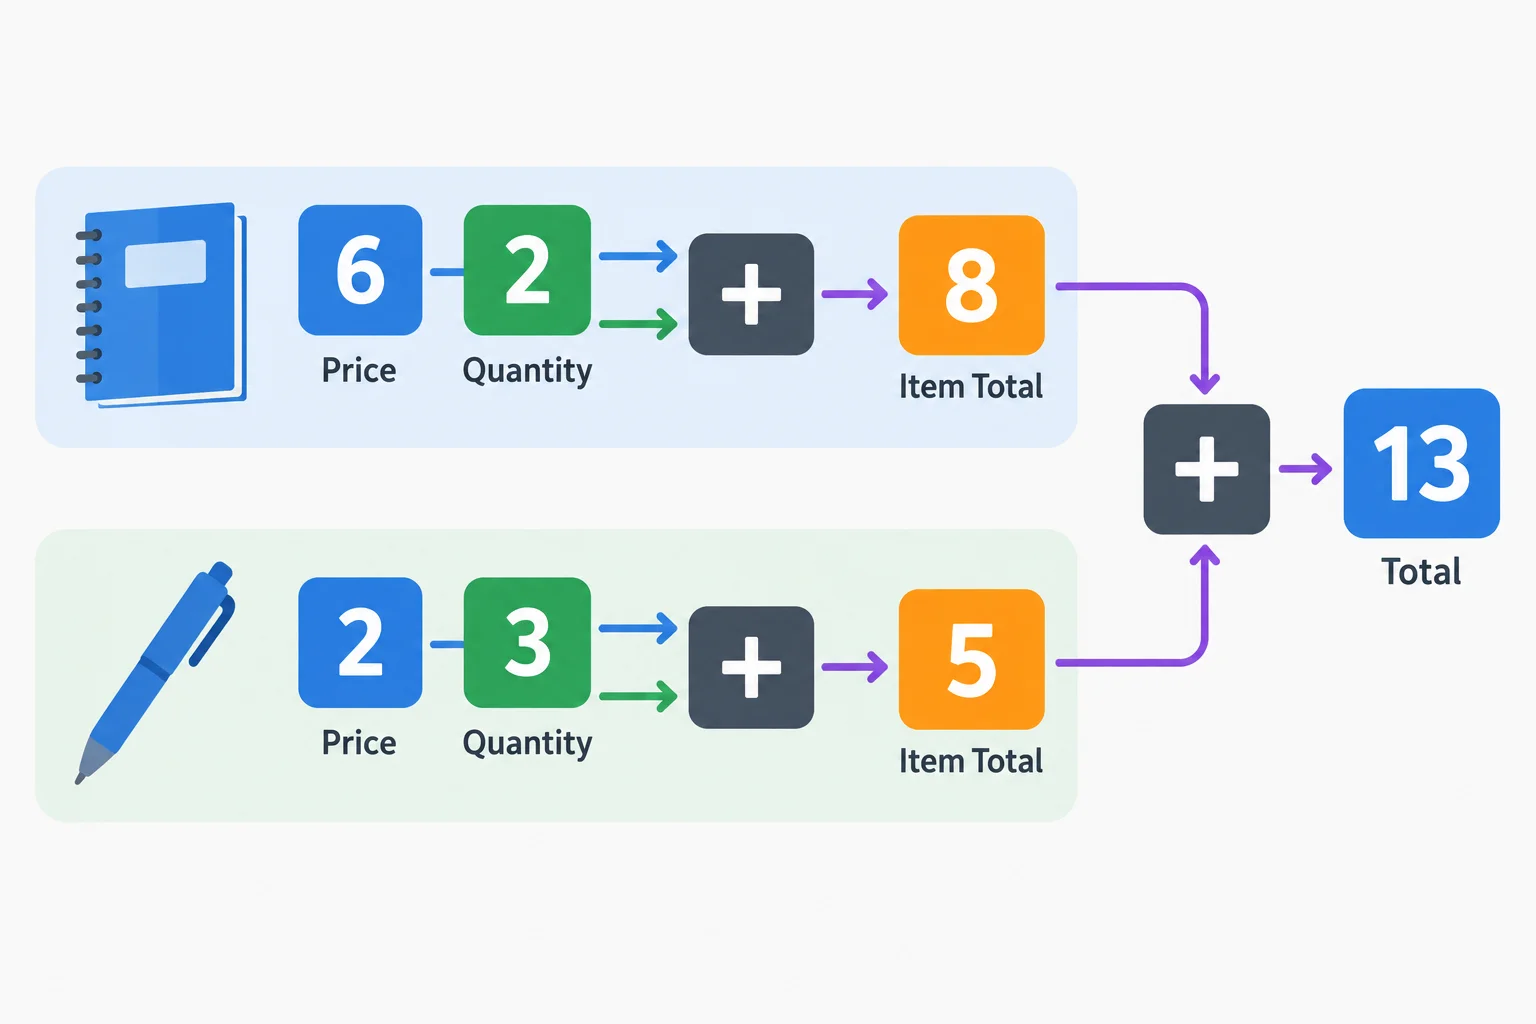
The inputs reach the helper successfully. The intermediate line totals reveal the wrong operation, not a failed loop boundary.
Apply the debugging cycle even when no exception is thrown:
18; Console reports 13.script.js:7:3, then reload.item. Select the calculateTotal entry in Call Stack to see the caller’s index, item, and total.lineTotal.The first pause should show the Notebook input with price 6 and quantity 2; after the helper returns, lineTotal is 8. Resume to inspect the Pen iteration if needed. The values are valid—the calculation applied to them is not.
After you correct the helper, save script.js, reload the page, and use this compact manual-check table. The empty-cart result is important: it can pass even while a helper calculation is wrong, because the helper is not called for an empty array.
| Case | Expected total | Observed total | Match? |
|---|---|---|---|
| Full cart | 18 | Write your Console result | Yes / No |
| One-item cart | 12 | Write your Console result | Yes / No |
| Empty cart | 0 | Write your Console result | Yes / No |
Complete the minimal causal correction for the helper. Do not change the loop or hard-code a total.
function getLineTotal(item) {
  return item.price  item.quantity;
}After applying your correction locally, disable the temporary source breakpoint and remove any temporary diagnostic console.log calls before the final reload. Then complete the manual checks from the previous screen.
Submit a compact debugging report after your final reload. Include all of the following:
item values and lineTotal evidence that exposed the incorrect calculation.Use evidence from your own Console and paused frames.
Write at least 120 characters (0/120).
Summary
Congratulations! You completed: Trace JavaScript Errors with the Browser Debugger
You completed this level!
Up next: Interactive Browser Interfaces
 Read and Update the DOM SafelyRead and modify a local page through JavaScript, including its text, controls, classes, and child elements, while keeping user-supplied text separate from HTML markup.
Thousands of online courses in video, ebooks and audiobooks.
To test your knowledge during online courses
Generated directly from your cell phone's photo gallery and sent to your email

Download our app via QR Code or the links below:.



Carry knowledge in your pocket.
Download the Cursa app.
There are hundreds of free courses available, with a free certificate of completion that is saved in your mobile image gallery.
Download the app to access the Course Completion Certificate for Free.


+ 10 million
students

Free and Valid
Certificate

60 thousand free
exercises

4.8/5 rating in
app stores

Free courses in
video and ebooks