Step 1 of 9
Prepare an Optimized Local Build
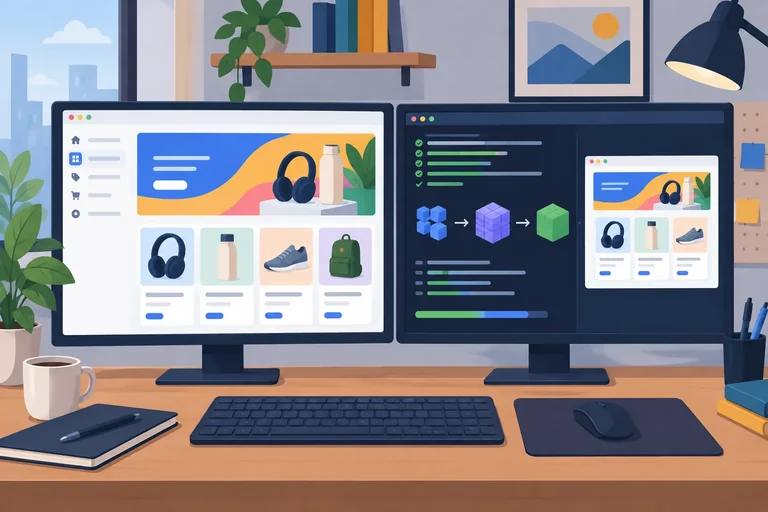
Create a fixed local React fixture, build it optimally, and verify its intentional diagnostic behavior before collecting evidence.

Learning path · Level 13 · Tutorial 2
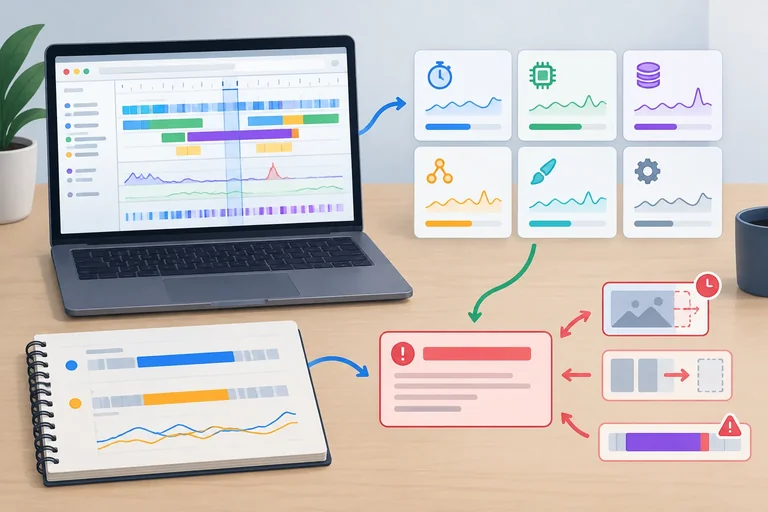
Record repeatable local performance baselines, locate loading and responsiveness bottlenecks, and interpret the measurements without mistaking them for real-user evidence.
 Prepare an Optimized Local Build
Create a fixed local React fixture, build it optimally, and verify its intentional diagnostic behavior before collecting evidence. 4 min
Prepare an Optimized Local Build
Create a fixed local React fixture, build it optimally, and verify its intentional diagnostic behavior before collecting evidence. 4 min
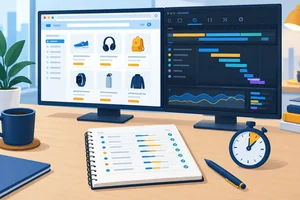 Define a Repeatable Measurement Protocol
Write a protocol that makes local load and interaction recordings meaningfully comparable. 3 min
Define a Repeatable Measurement Protocol
Write a protocol that makes local load and interaction recordings meaningfully comparable. 3 min
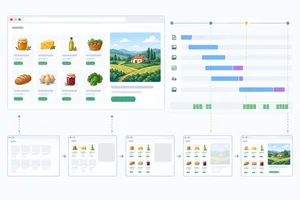 Connect Requests to Visible Loading
Record local load traces and connect the delayed hero request to main-thread activity and visible updates without treating a late request as proof of slow transfer. 3 min
Connect Requests to Visible Loading
Record local load traces and connect the delayed hero request to main-thread activity and visible updates without treating a late request as proof of slow transfer. 3 min
 Identify What LCP Actually Measures
Identify the visible element measured by LCP and connect its presentation time to request and rendering evidence in a local recording. 2 min
Identify What LCP Actually Measures
Identify the visible element measured by LCP and connect its presentation time to request and rendering evidence in a local recording. 2 min
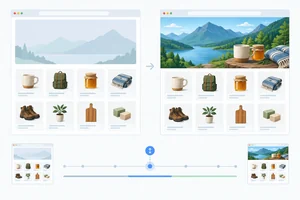 Trace Unexpected Layout Movement
Locate unexpected layout movement in a local recording, classify recent-input exclusions, and distinguish displaced content from a likely initiating insertion. 3 min
Trace Unexpected Layout Movement
Locate unexpected layout movement in a local recording, classify recent-input exclusions, and distinguish displaced content from a likely initiating insertion. 3 min
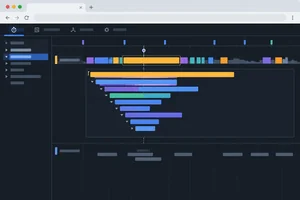 Locate and Attribute a Long Task
Find the long main-thread task created by the settled-page filter interaction and attribute its substantial contributors without confusing it with Network timing. 3 min
Locate and Attribute a Long Task
Find the long main-thread task created by the settled-page filter interaction and attribute its substantial contributors without confusing it with Network timing. 3 min
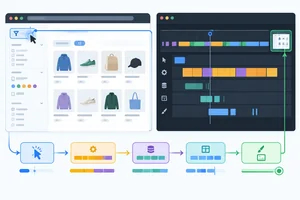 Measure Responsiveness Through the Next Paint
Interpret local filter-interaction recordings from user input through the next presented frame, and distinguish those samples from lifecycle INP. 3 min
Measure Responsiveness Through the Next Paint
Interpret local filter-interaction recordings from user input through the next presented frame, and distinguish those samples from lifecycle INP. 3 min
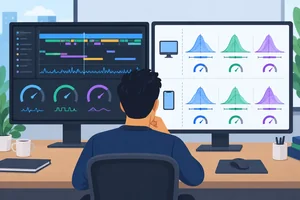 Separate Reference Thresholds from Field Evidence
Apply inclusive reference thresholds while distinguishing controlled local evidence from real-user p75 field assessment. 2 min
Separate Reference Thresholds from Field Evidence
Apply inclusive reference thresholds while distinguishing controlled local evidence from real-user p75 field assessment. 2 min
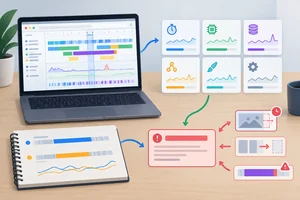 Preserve a Baseline and Choose One Hypothesis
Consolidate repeatable local performance recordings into a preserved baseline, select one evidence-backed bottleneck hypothesis, and plan a comparable follow-up measurement. 3 min
Preserve a Baseline and Choose One Hypothesis
Consolidate repeatable local performance recordings into a preserved baseline, select one evidence-backed bottleneck hypothesis, and plan a comparable follow-up measurement. 3 min
Step 1 of 9
Create a fixed local React fixture, build it optimally, and verify its intentional diagnostic behavior before collecting evidence.
Create the diagnostic fixture in a new folder on your own computer. It has fixed local data and one local SVG, so it does not need an API, downloaded teaching asset, or deployment.
In a terminal, create the familiar Vite React–TypeScript scaffold, then install its dependencies:
npm create vite@latest local-catalog -- --template react-tscd local-catalognpm installKeep the scaffold configuration and src/main.tsx unchanged. Replace the four files supplied in this step exactly. This fixture intentionally contains diagnostic defects for later measurement; they are not production patterns.
Create public/catalog-hero.svg with these complete contents:
<svg xmlns="http://www.w3.org/2000/svg" viewBox="0 0 960 360" role="img" aria-labelledby="title desc">
  <title id="title">Abstract catalog illustration</title>
  <desc id="desc">Colorful product cards, a delivery box, and a large circular accent.</desc>
  <defs>
    <linearGradient id="background" x1="0" x2="1" y1="0" y2="1">
      <stop stop-color="#dbeafe" />
      <stop offset="1" stop-color="#ede9fe" />
    </linearGradient>
  </defs>
  <rect width="960" height="360" rx="28" fill="url(#background)" />
  <circle cx="758" cy="125" r="100" fill="#818cf8" opacity=".32" />
  <rect x="115" y="87" width="224" height="184" rx="20" fill="#ffffff" />
  <rect x="145" y="119" width="164" height="78" rx="12" fill="#38bdf8" />
  <rect x="145" y="219" width="104" height="18" rx="9" fill="#cbd5e1" />
  <rect x="432" y="116" width="214" height="158" rx="18" fill="#1e293b" />
  <path d="M469 164h140v72H469z" fill="#fbbf24" />
  <path d="m469 164 70 38 70-38M539 202v34" fill="none" stroke="#1e293b" stroke-width="10" stroke-linejoin="round" />
  <circle cx="747" cy="245" r="48" fill="#fb7185" />
  <path d="m727 245 14 14 29-35" fill="none" stroke="#fff" stroke-linecap="round" stroke-linejoin="round" stroke-width="12" />
</svg>Replace src/index.css with these complete contents:
* {
  box-sizing: border-box;
}

html {
  font-family: Inter, system-ui, sans-serif;
  color: #172033;
  background: #f5f7fb;
}

body {
  margin: 0;
  min-width: 320px;
}

button {
  font: inherit;
}
Replace src/App.tsx with these complete contents:
import { useEffect, useState } from 'react'
import './App.css'

type Product = {
  id: number
  name: string
}

const products: Product[] = Array.from({ length: 24 }, (_, index) => {
  const id = index + 1
  return { id, name: `Product ${String(id).padStart(2, '0')}` }
})

function simulateFilterWork() {
  const endTime = performance.now() + 180
  let accumulator = 0

  while (performance.now() < endTime) {
    accumulator += Math.sqrt(accumulator + 1)
  }

  return accumulator
}

function App() {
  const [showHero, setShowHero] = useState(false)
  const [isFiltered, setIsFiltered] = useState(false)

  useEffect(() => {
    // Artificial diagnostic defect: insert an image after a nominal 1000 ms delay.
    const timerId = window.setTimeout(() => setShowHero(true), 1000)
    return () => window.clearTimeout(timerId)
  }, [])

  const visibleProducts = isFiltered
    ? products.filter((product) => product.id % 2 === 0)
    : products

  function handleFilter() {
    // Artificial diagnostic defect: synchronous work bounded to approximately 180 ms.
    simulateFilterWork()
    setIsFiltered(true)
  }

  return (
    <main className="catalog">
      <header className="catalogHeader">
        <p className="eyebrow">Local performance fixture</p>
        <h1>Local Catalog</h1>
        <p>Fixed products for repeatable local measurements.</p>
      </header>

      {showHero && (
        <img
          className="hero"
          src="/catalog-hero.svg"
          alt="Abstract catalog illustration"
        />
      )}

      <section className="catalogControls" aria-label="Catalog controls">
        <button type="button" onClick={handleFilter}>
          Apply filter
        </button>
        <p className="status" aria-live="polite">
          Showing {visibleProducts.length} of {products.length} products
        </p>
      </section>

      <section className="productGrid" aria-label="Products">
        {visibleProducts.map((product) => (
          <article className="productCard" key={product.id}>
            <span>#{String(product.id).padStart(2, '0')}</span>
            <h2>{product.name}</h2>
          </article>
        ))}
      </section>
    </main>
  )
}

export default App
Replace src/App.css with these complete contents:
#root {
  min-height: 100vh;
}

.catalog {
  width: min(1100px, calc(100% - 32px));
  margin: 0 auto;
  padding: 48px 0 72px;
}

.catalogHeader {
  margin-bottom: 28px;
}

.eyebrow {
  margin: 0 0 8px;
  color: #4f46e5;
  font-size: 0.85rem;
  font-weight: 700;
  letter-spacing: 0.08em;
  text-transform: uppercase;
}

h1,
h2,
p {
  margin-top: 0;
}

h1 {
  margin-bottom: 10px;
  font-size: clamp(2rem, 5vw, 3.5rem);
}

.catalogHeader > p:last-child {
  color: #526079;
}

.hero {
  display: block;
  width: 100%;
  height: auto;
  margin: 0 0 28px;
  border-radius: 20px;
}

.catalogControls {
  display: flex;
  align-items: center;
  justify-content: space-between;
  gap: 16px;
  margin-bottom: 24px;
}

button {
  padding: 12px 18px;
  border: 0;
  border-radius: 10px;
  background: #4338ca;
  color: #fff;
  cursor: pointer;
  font-weight: 700;
}

button:hover {
  background: #3730a3;
}

button:focus-visible {
  outline: 3px solid #f59e0b;
  outline-offset: 3px;
}

.status {
  margin: 0;
  color: #334155;
  font-weight: 700;
}

.productGrid {
  display: grid;
  grid-template-columns: repeat(auto-fit, minmax(180px, 1fr));
  gap: 16px;
}

.productCard {
  min-height: 128px;
  padding: 20px;
  border: 1px solid #dbe2ef;
  border-radius: 16px;
  background: #fff;
  box-shadow: 0 4px 14px rgb(15 23 42 / 0.05);
}

.productCard span {
  color: #64748b;
  font-size: 0.85rem;
}

.productCard h2 {
  margin: 14px 0 0;
  font-size: 1.1rem;
}

@media (max-width: 560px) {
  .catalogControls {
    align-items: flex-start;
    flex-direction: column;
  }
}
The fixture has two intentional artificial diagnostic defects. After a nominal 1000 ms, the local SVG is inserted with no space reserved in advance. During filtering, simulateFilterWork() runs synchronously for approximately 180 ms.
Both behaviors are deliberately repeatable for diagnosis. Do not copy them as production patterns or fix them yet.
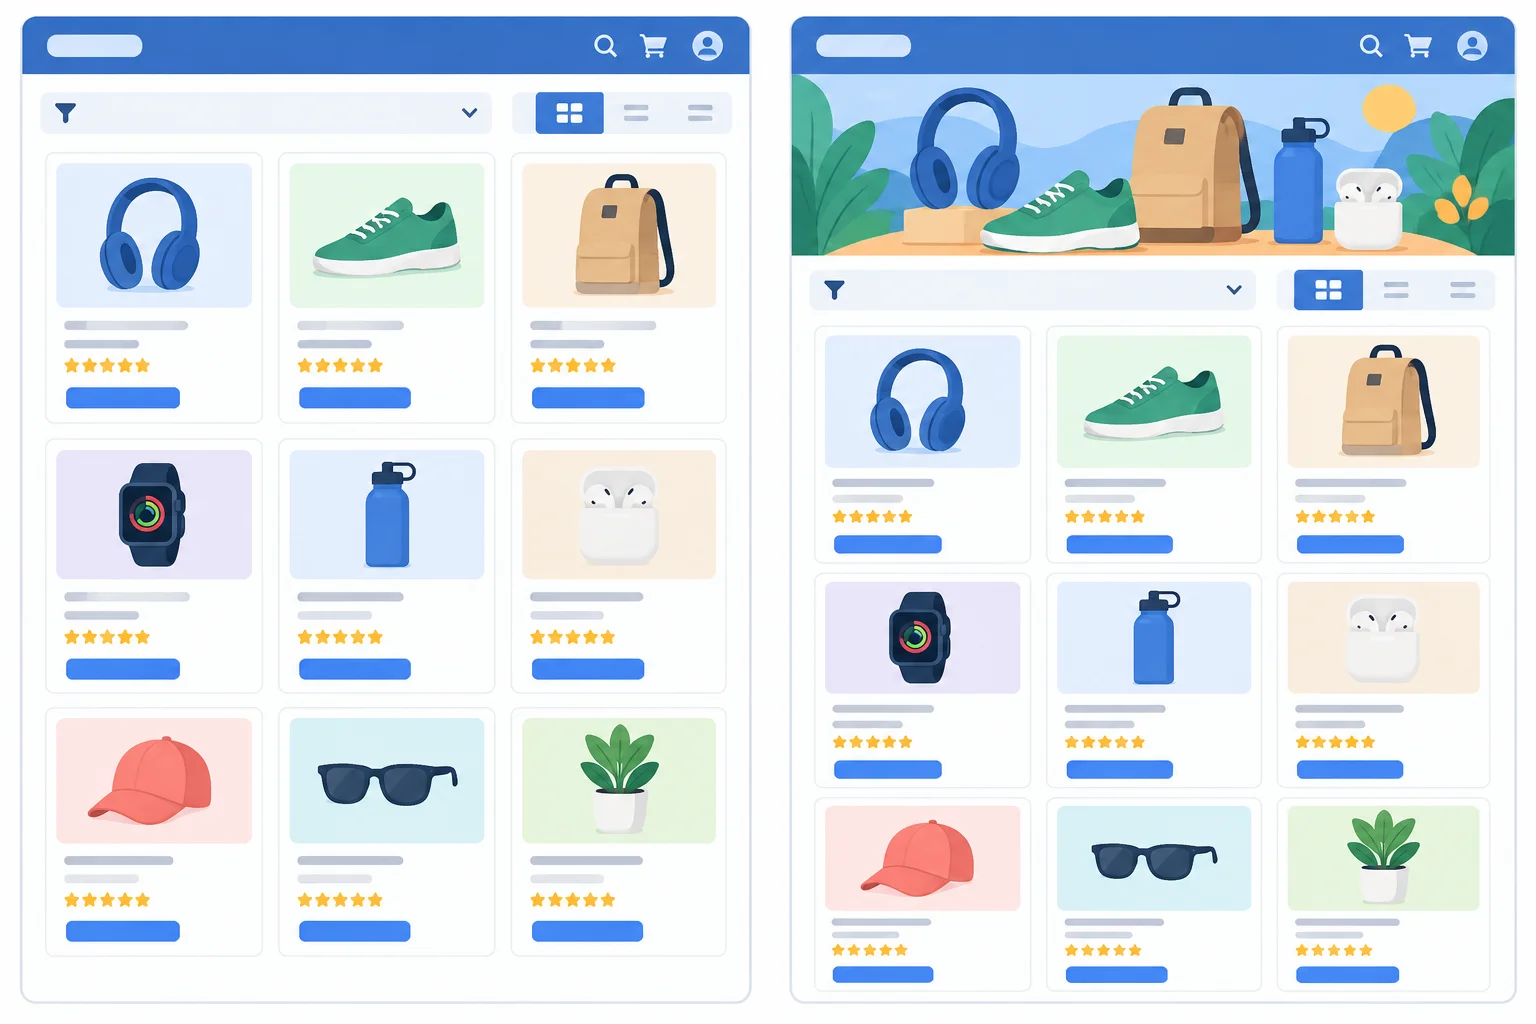
The delayed hero insertion changes the page geometry; the filter action includes deliberately bounded synchronous work.
Build this application before measuring it. An optimized build is not the same thing as the development server: development transformations and development-only checks can change the work you observe.
From local-catalog, run the build. Then start the preview server and open the exact local address that Vite prints. This serves the generated optimized files only on your computer; it does not deploy anything.
If you change any source file later, run the build again before using the preview server. A running preview server does not automatically rebuild your source.
Run this command first:
npm run build> local-catalog@0.0.0 build > tsc -b && vite build vite vX.Y.Z building for production... ✓ modules transformed. dist/index.html 0.46 kB dist/assets/index-XXXXXXXX.css 1.42 kB dist/assets/index-XXXXXXXX.js 145.10 kB ✓ built in X.XXs
File names, sizes, transformed-module counts, Vite version, and build duration vary. The important result is a successful build with generated files in `dist`.
After the build succeeds, start the local preview server:
npm run preview> local-catalog@0.0.0 preview > vite preview ➜ Local: http://localhost:4173/ ➜ press h + enter to show help
This is representative output only. Do not assume port 4173 is available; open the Local address actually printed by your own Vite process.
At the preview server address, check the visible behavior before recording anything:
Local Catalog.Apply filter once; only even-numbered products remain and the status changes.Use desktop Chrome DevTools later, but remember that DevTools and browser extensions can add measurement overhead. For now, simply confirm the fixture works. The next step will define consistent measurement conditions.
Warning
Do not treat an observation on the development server as interchangeable with an optimized-build baseline. Use the preview server for the baseline, keep the browser setup stable, and document any tools or extensions that remain active.
Complete the command sequence that prepares and then locally serves the optimized application.
npm run
npm run Using your optimized preview server, perform the check on your own computer. In 2–4 sentences, report the initial product total and the total after one filter activation. Then explain why an observation from the development server cannot substitute for this optimized-build baseline.
Write at least 80 characters (0/80).
Step 2 of 9
Write a protocol that makes local load and interaction recordings meaningfully comparable.
A comparable baseline starts with two deliberately separate scenarios.
Load scenario: reload the optimized local app and make no input until the delayed hero content has settled.
Interaction scenario: return the app to its initial state, wait until the page has settled, then activate Apply filter exactly once. The status should change from “Showing 24 of 24 products” to “Showing 12 of 24 products.”
Do not mix these scenarios in one run. An early click changes the page state and can also change the work visible during loading. The delayed image insertion and bounded filtering work are artificial diagnostic defects in this fixture, not production patterns.
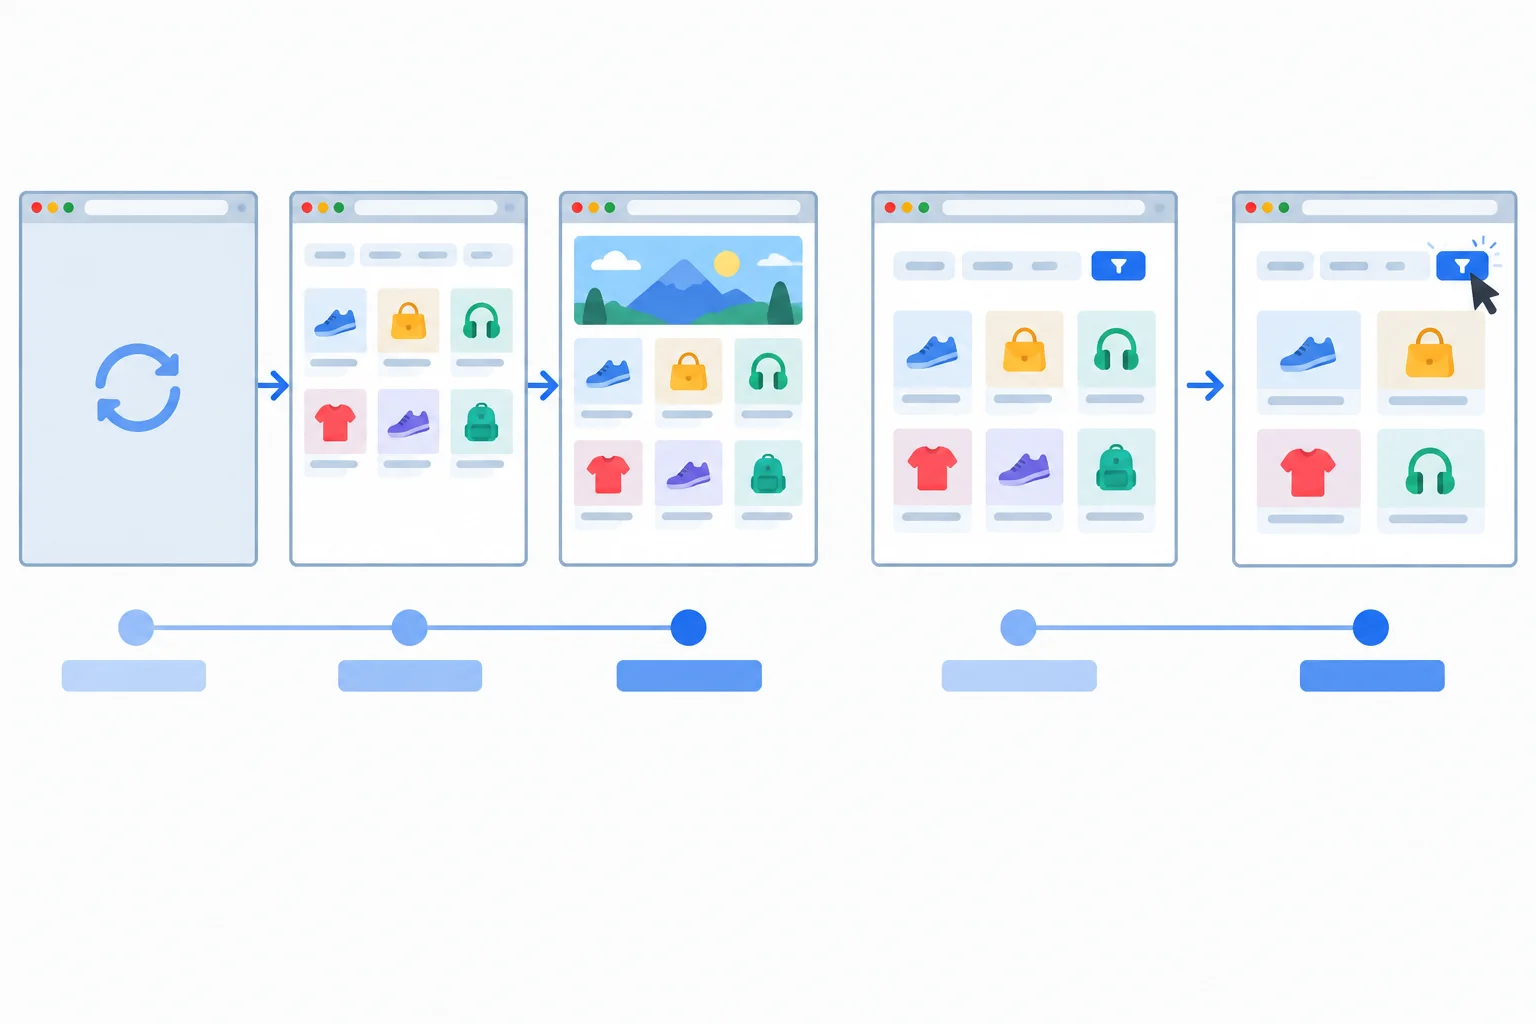
Treat the no-input load and the settled-page filter activation as separate, repeatable scenarios.
Keep the build and conditions fixed across comparable runs. Use the optimized local build and preview server; if source changes, run npm run build again before using npm run preview and reopen the local address printed by Vite.
For a straightforward baseline, select No throttling for both CPU and Network and record those exact settings. A simulated throttling preset can still be useful for a controlled experiment, but it is not an exact physical device. If you choose one, keep it unchanged for every comparable run.
For cold-cache loads, open DevTools, open Network, enable Disable cache, and keep DevTools open while reloading. That checkbox applies only while DevTools is open. Keep extensions, DevTools configuration, activation method, and major background activity as consistent as practical.
Use these labels consistently in your baseline log. Record the same conditions for all six planned runs: Load 1, Load 2, Load 3, Interaction 1, Interaction 2, and Interaction 3.
| Label | What to record |
|---|---|
| Build | Optimized build identifier or local revision |
| Browser | Chrome version and relevant extensions |
| Viewport | Width × height in CSS px |
| DPR | Device pixel ratio |
| Cache | Cold-cache procedure or other fixed policy |
| CPU | Selected CPU setting |
| Network | Selected Network setting |
| Scenario | Initial load or one settled-page filter activation |
| Run | Load 1–3 or Interaction 1–3 |
| Observation | Visible result under the scenario |
| Evidence | Local trace or note location |
Tip
Fixed content matters too: retain the same 24 deterministic products and the same local catalog-hero.svg fixture in every run. Do not change the build, viewport, cache policy, CPU setting, or Network setting halfway through a comparable set.
Put the preparation and reset procedure in order.
Write your local measurement protocol. In 5–8 lines:
Write at least 220 characters (0/220).
Step 3 of 9
Record local load traces and connect the delayed hero request to main-thread activity and visible updates without treating a late request as proof of slow transfer.
With the optimized application open through the preview server address printed by Vite, open Chrome DevTools Network. Keep the measurement conditions from your protocol, clear prior entries, reload, and locate catalog-hero.svg.
This local SVG is inserted only after a nominal 1000 ms timer. That delay is an artificial diagnostic defect, so its request can begin after the initial document and other assets. For the request row or its details, inspect its relative start time, duration, Initiator information when available, and Size/Transferred or cache evidence.
Initiator labels vary by Chrome version and build output. Record what the tool actually shows rather than assuming a particular initiator.
Record observations, not assumptions about the cause.
| Evidence | What it tells you |
|---|---|
| Waterfall start | When the browser began this request relative to reload |
| Duration | How long the request occupied the network timeline after it began |
| Initiator | What DevTools can associate with discovery or request creation |
| Transferred/cache field | Whether the row indicates transferred bytes or cached reuse |
Tip
A Network-panel reload is useful supporting evidence, but it is not the identical captured run as a later Performance recording. Only events aligned inside one Performance trace can be treated as one shared timeline.
Now create a separate Performance recording. Enable screenshots in the recording settings, start recording, reload the preview page, and stop only after the delayed hero content has appeared and the page has settled.
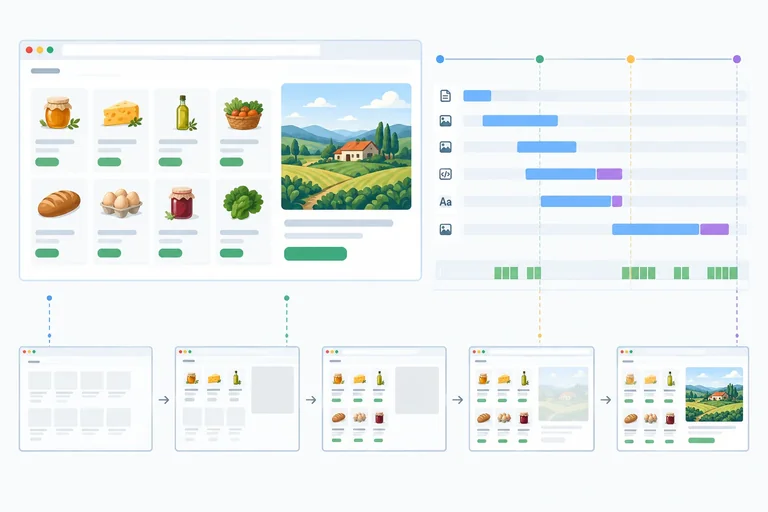
Within this one trace, align the Performance network track, the main-thread track, and the screenshot strip on their common time axis. A request that starts late is evidence about discovery timing. A request that lasts a long time after it starts is evidence about loading or transfer duration. They are different observations.
Because this fixture is local, a late hero request does not by itself demonstrate a slow server or connection. Likewise, a completed request can precede the screenshot that visibly contains the hero because browser rendering work may still occur afterward.
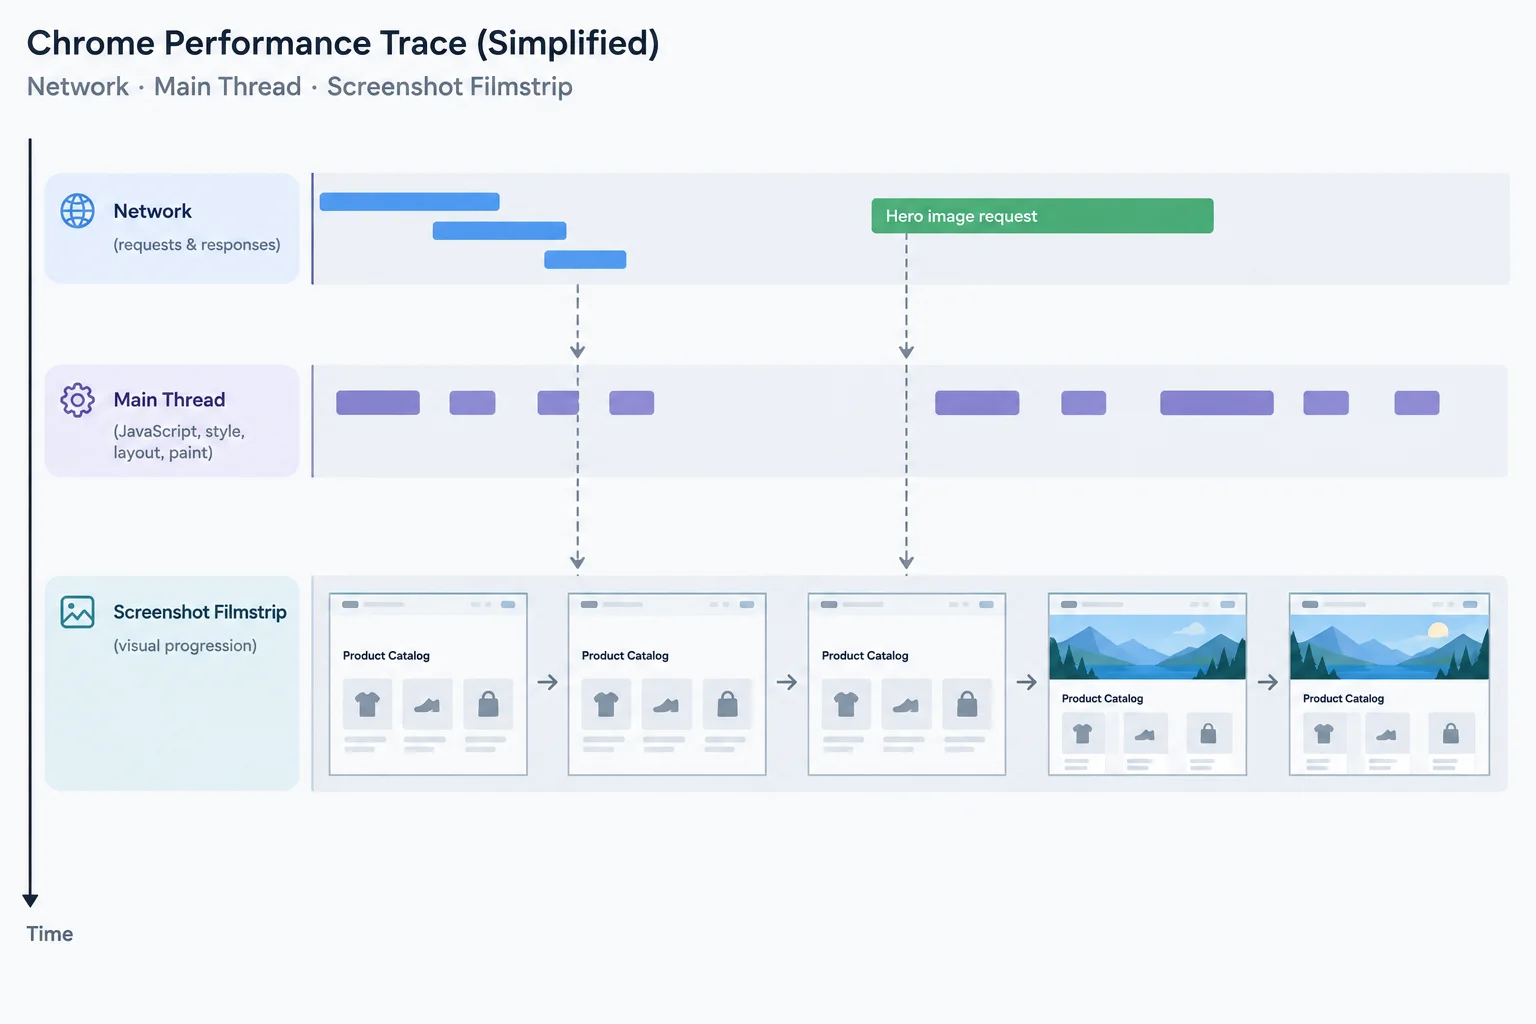
Use alignment within one Performance recording to connect the request, browser work, and the visible update.
Tip
Create Load 1, Load 2, and Load 3 under unchanged conditions. For each run, wait without input until delayed content settles. Preserve the trace or a local note on your computer.
Use the existing condition labels consistently: Build, Browser, Viewport, DPR, Cache, CPU, Network, and Scenario. Add Run, Observation, and Evidence for each result. Do not change the build or settings between comparable load runs.
Match each trace clue to its strongest conclusion.
Tap an item and then its matching pair.
Using one of your own Performance traces, write a compact evidence note. Use the labels Run:, Observation:, and Evidence:.
Include all of the following:
Also state that you retained comparable Load 1, Load 2, and Load 3 locally.
Write at least 180 characters (0/180).

Step 4 of 9
Identify the visible element measured by LCP and connect its presentation time to request and rendering evidence in a local recording.
Largest Contentful Paint (LCP) is the time, measured from the start of a page load, when the largest eligible content element visible in the viewport is rendered.
It describes a visible rendering milestone—not the time when every request ends and not simply the largest element in the DOM. As the page changes during loading, a later, larger eligible element can replace an earlier candidate.
For this fixture, the delayed hero image is worth investigating, but do not assume it is the LCP element. The trace identifies the candidate.
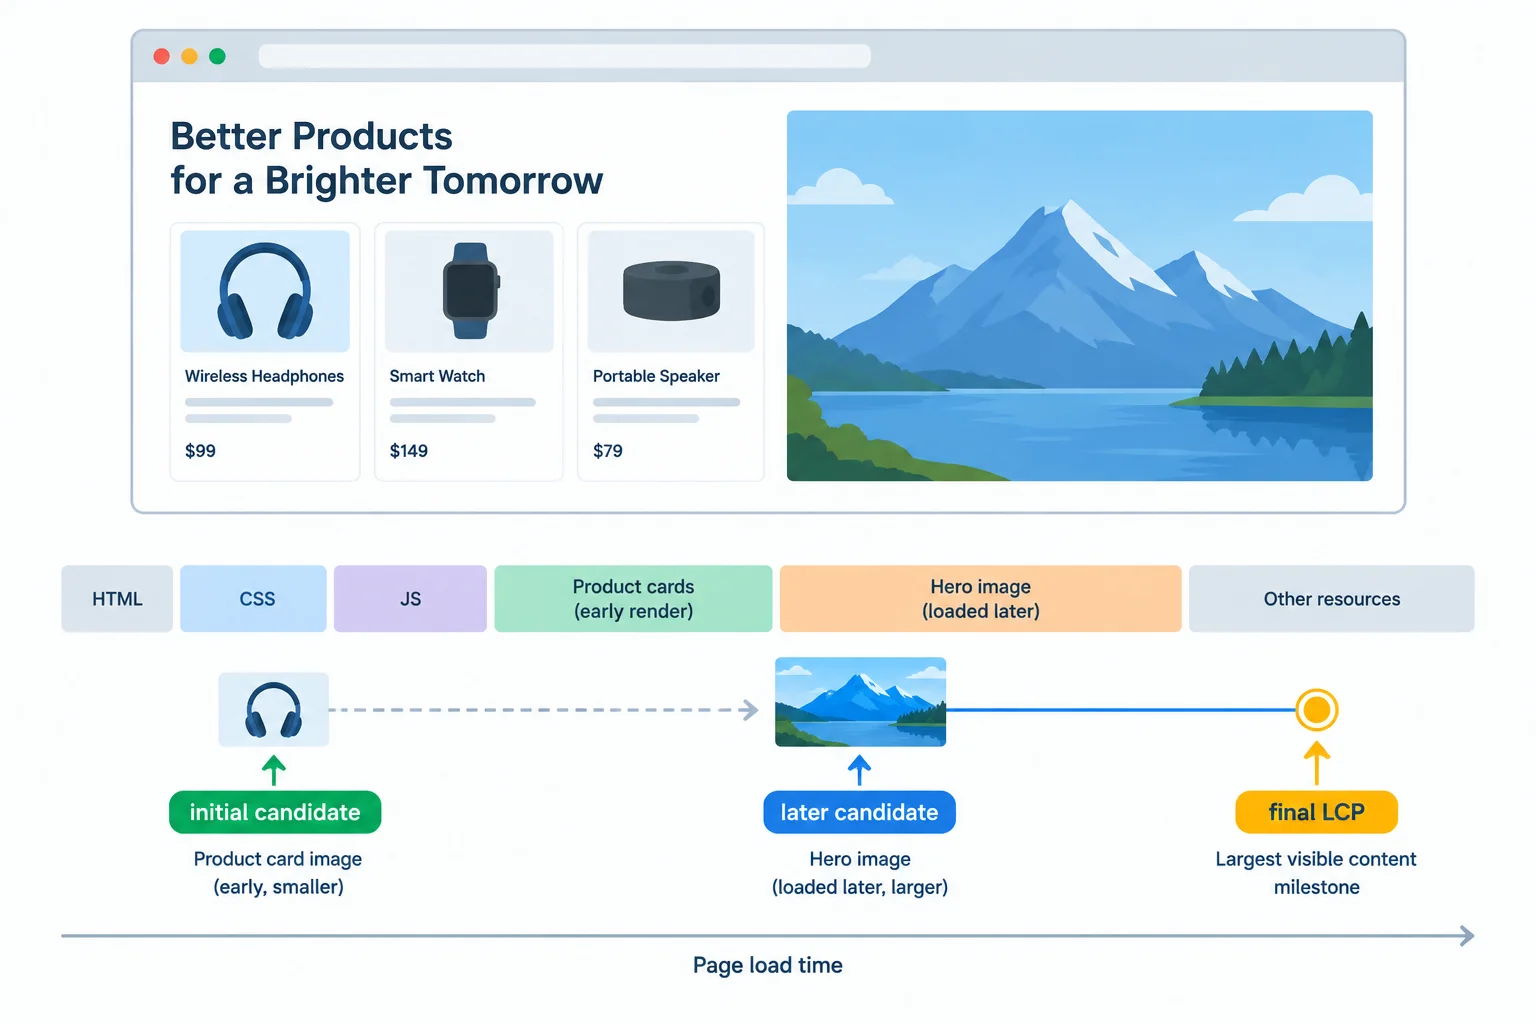
The browser can update the LCP candidate while the initial viewport is loading.
Open a preserved local load recording, such as Load 1, in Chrome DevTools Performance. Locate the page-load metric or LCP event available in your Chrome version and select it. Its details can identify the candidate element and its time relative to navigation start.
Then inspect the screenshot near that time. Does the selected element appear in the viewport then? This checks the observed candidate instead of inferring one from the fixture design.
Keep this an initial-load scenario: reload, make no early input, and wait until the delayed content settles. An early interaction can change page state or visible content, making the recording less useful for describing the initial load.
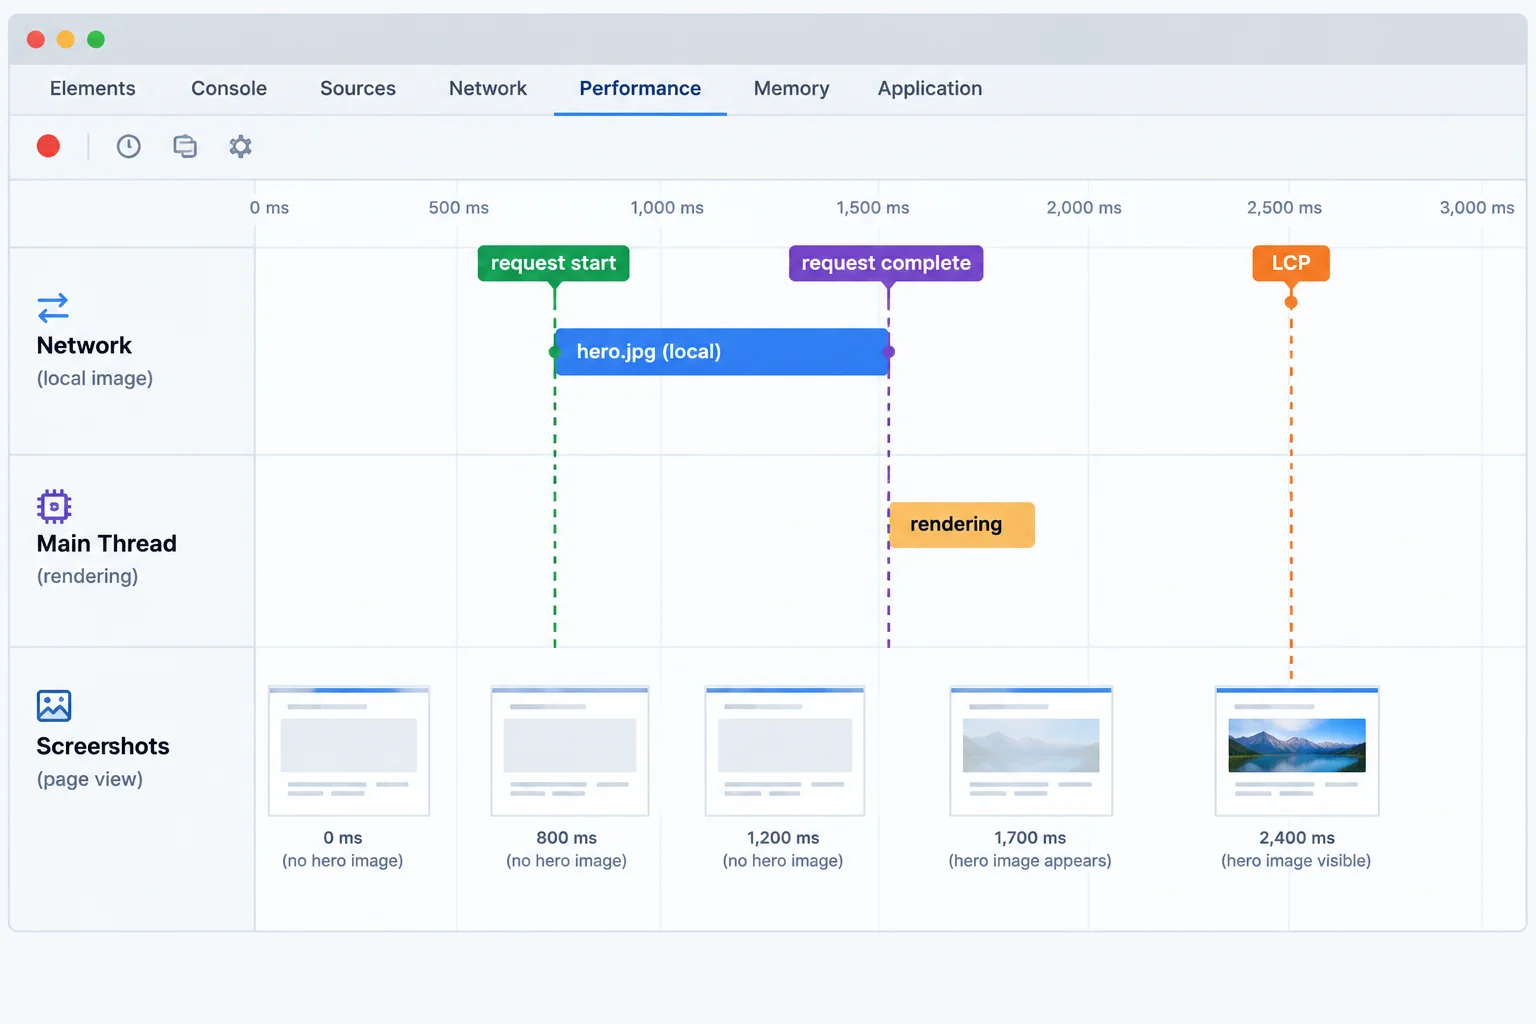
A resource becoming available is not the same event as that resource being presented.
Compare three kinds of evidence in the same Performance recording:
A late request start can contribute to a late presentation. A request that completes earlier than LCP suggests there was still time before presentation, but it does not by itself prove which later work caused that delay.
A local trace identifies the hero image as the LCP candidate. Its request begins after the nominal 1000 ms timer, completes promptly, and the LCP marker occurs after later rendering activity. Which conclusion is best supported?
Use one of your local load recordings, preferably Load 1, to write a short evidence note. Identify the LCP candidate selected by Chrome, report its LCP time, and give the candidate request’s start and completion timing if available. Then cite one rendering or screenshot observation from the same recording.
Finish with a tentative explanation of which part of the timeline appears delayed. Explicitly state whether request completion and LCP are the same moment in this recording. Do not assume /catalog-hero.svg is the candidate unless the trace identifies it.
Write at least 220 characters (0/220).
Step 5 of 9
Locate unexpected layout movement in a local recording, classify recent-input exclusions, and distinguish displaced content from a likely initiating insertion.
Cumulative Layout Shift (CLS) describes unexpected visual movement during a page visit. It is a unitless score—not a duration and not a count of elements that moved.
Chrome groups qualifying shifts into session windows. A window can include shifts that are less than 1 s apart, and it can last no longer than 5 s. The reported CLS is the score of the highest-scoring such window, rather than a sum across every shift on the page.
Do not calculate scores manually here. Your task is to find the recorded movement and inspect its visual evidence.
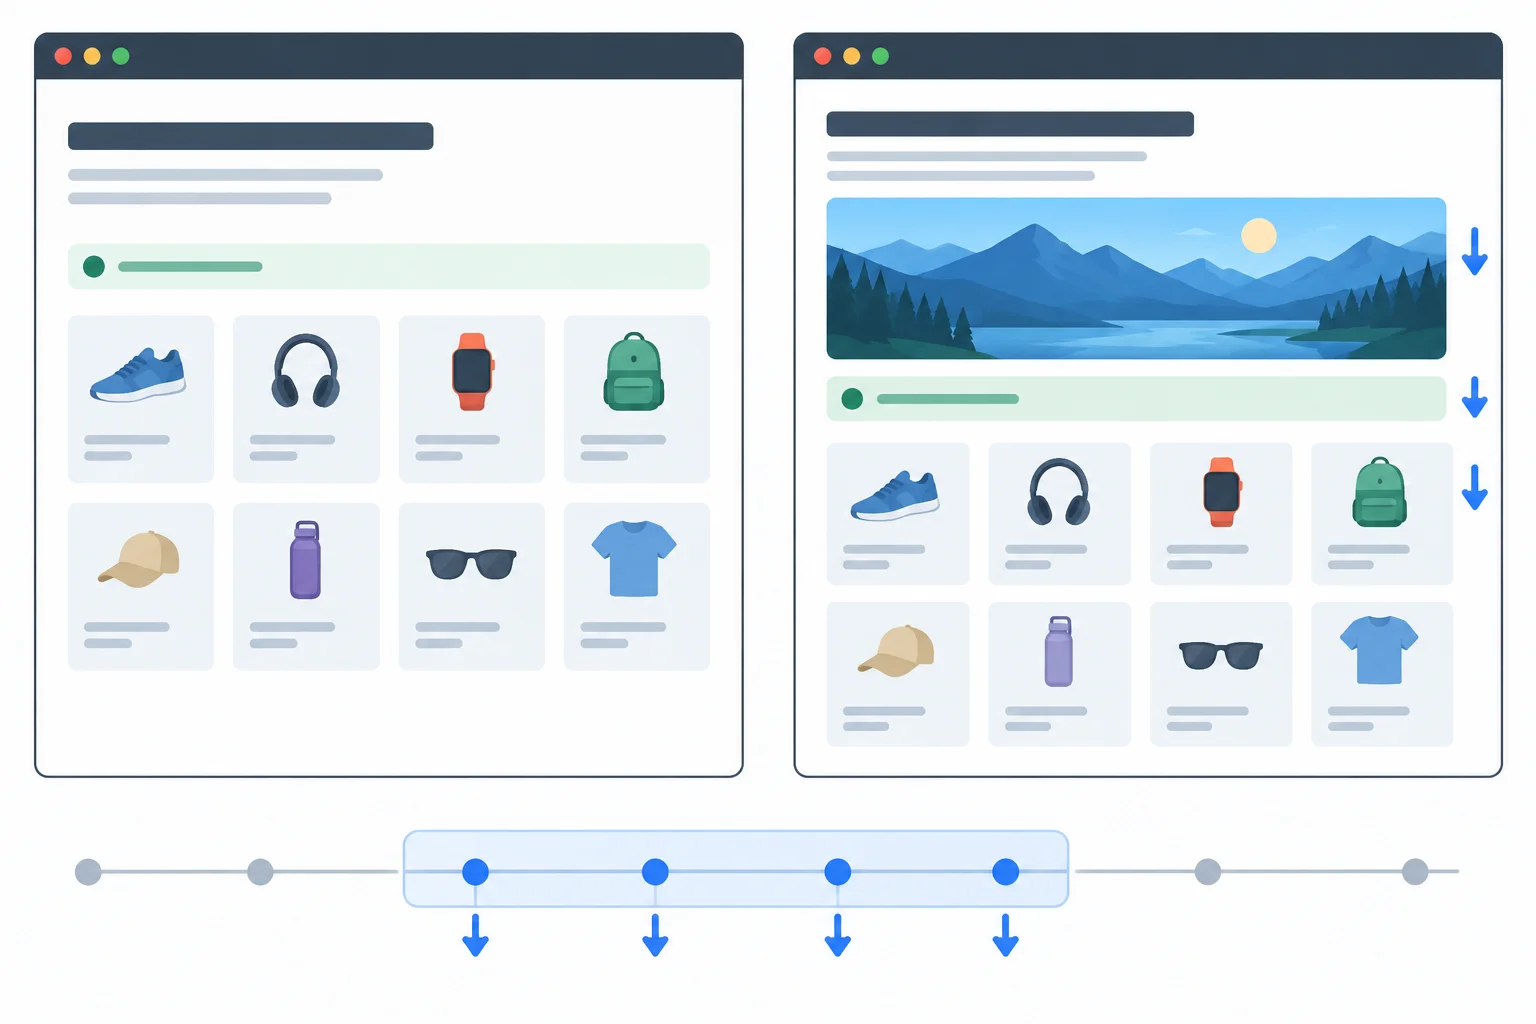
The status and cards are affected elements. The insertion above them is a possible initiating cause.
A shift that follows qualifying recent user input is generally excluded from CLS when it occurs within 500 ms of that input. This avoids penalizing an expected response to an action such as a click or key press.
Scrolling is not qualifying input for this exclusion. Therefore, movement during scrolling can still be relevant. The timing and input context in the recording matter; do not decide from the page appearance alone.
Use the event context to classify movement; do not infer eligibility solely from whether an element moved.
| Situation | CLS treatment | Why |
|---|---|---|
| Automatic content changes the page after load | Usually included | No qualifying recent input |
| A layout response occurs 350 ms after a click | Generally excluded | Within 500 ms of qualifying input |
| Layout moves while the user scrolls | Can be included | Scrolling is not qualifying input |
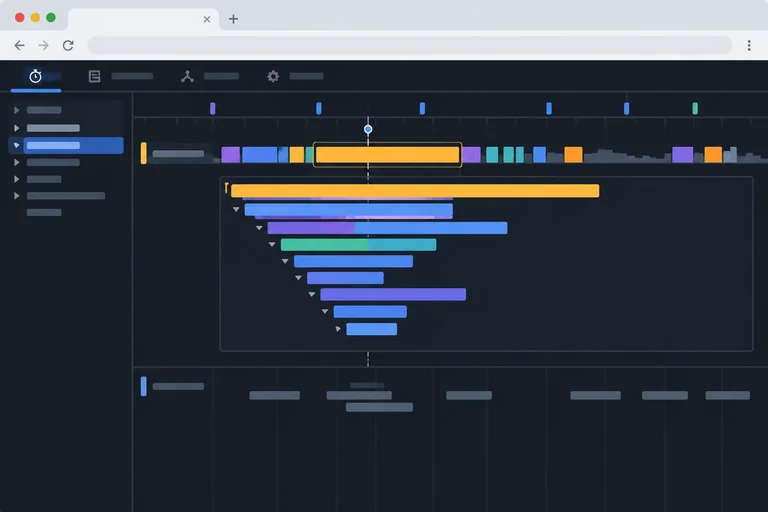
Open one of your load recordings in Chrome DevTools Performance. Find a Layout Shift event or cluster; track and event labels can vary by Chrome version. Select it, then inspect the screenshots immediately before and after the event.
Record three separate observations:
The moved node is evidence of impact. It is not, by itself, proof of the cause.
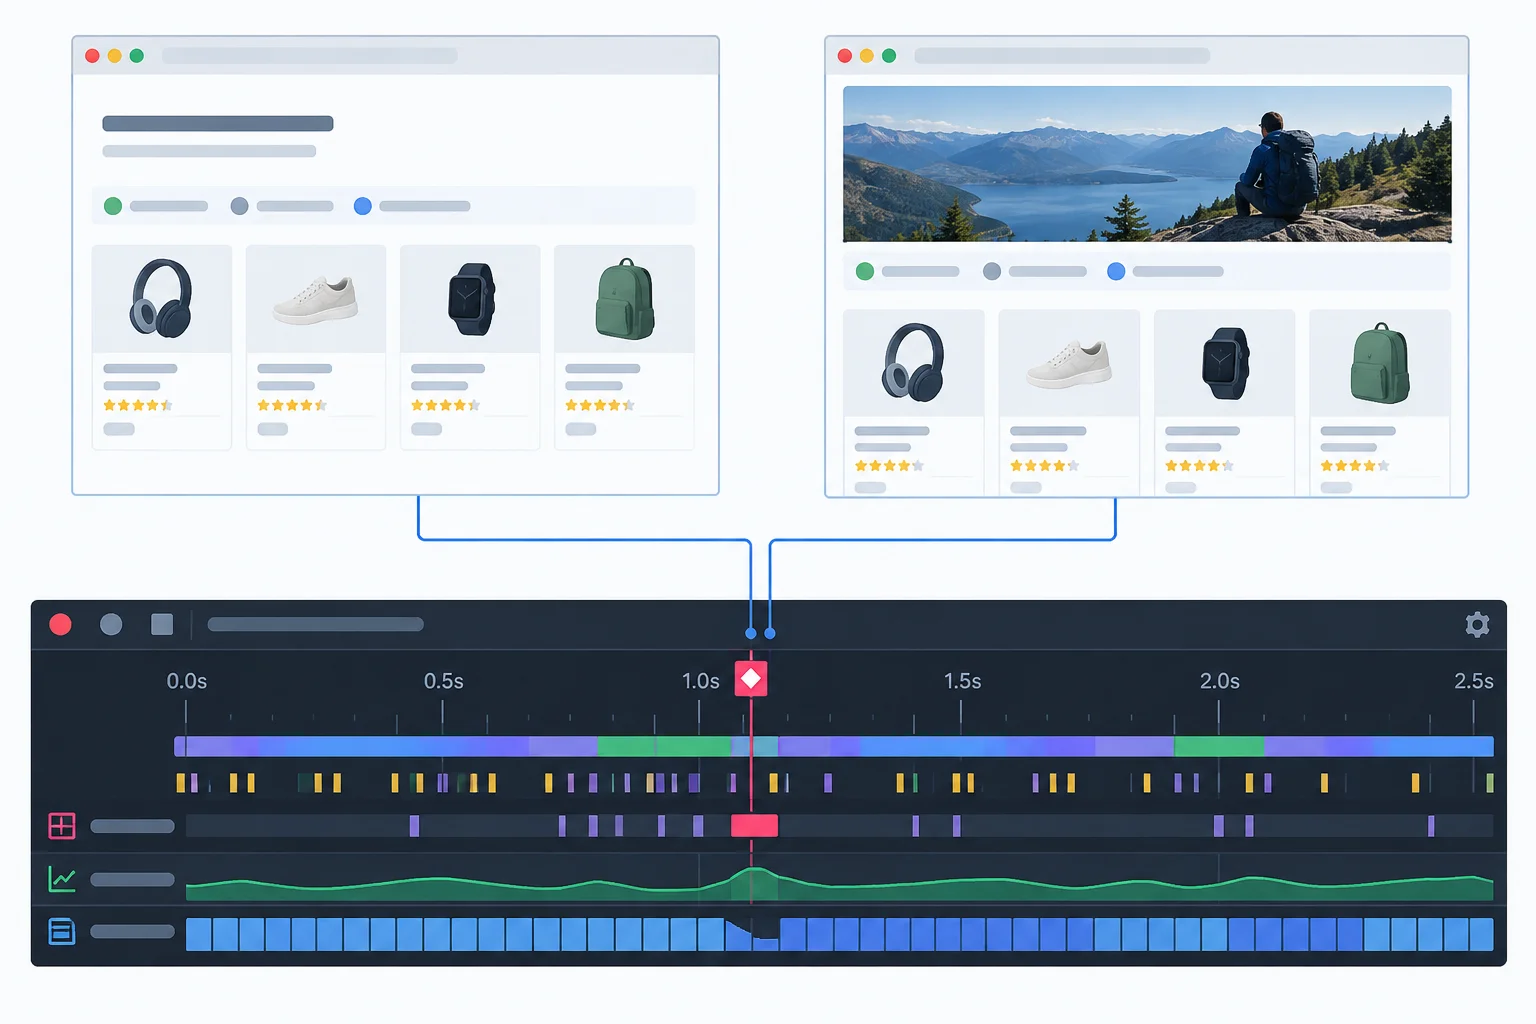
Use the event and adjacent screenshots together: they show when movement occurred and which visible content changed position.
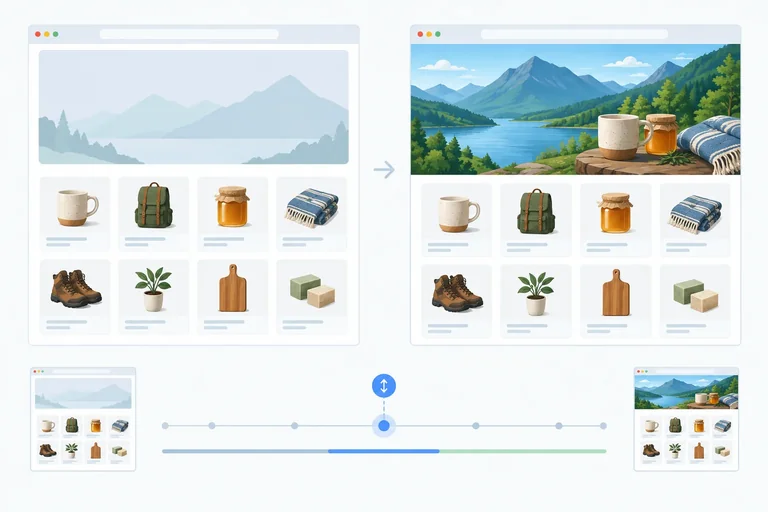
In this diagnostic fixture, an image referencing /catalog-hero.svg is inserted after a nominal 1000 ms timer. The page initially reserves no space for it. That artificial setup is a useful hypothesis to investigate: an insertion above existing content can displace content below it.
Treat it as an intentional diagnostic defect, not a production pattern. At this stage, locate and describe the evidence only—do not implement a layout fix.
Match each situation to its likely CLS treatment.
Tap an item and then its matching pair.
Use this assessment in two parts.
Classify:
Apply filter click.For each, state whether the shift would generally be included or excluded from CLS and give the timing/input reason.
Inspect: In your own local load recording, cite the Layout Shift event or cluster time. Name one visibly displaced element from the before/after screenshots, then name the likely insertion or change above it. Finish by separating what the screenshots/event details demonstrate from what remains a causal hypothesis.
Write at least 180 characters (0/180).
Step 6 of 9
Find the long main-thread task created by the settled-page filter interaction and attribute its substantial contributors without confusing it with Network timing.
Record this interaction separately from a load recording. Reset the previewed app, then wait until the page has settled. In Chrome DevTools, open Performance and keep the conditions from your documented protocol unchanged.
Start a recording, activate Apply filter once, and stop after the status and product list have updated. Name this trace Interaction 1. The recording should focus on the activation, not on startup work or the delayed image insertion.
In the main-thread track, look for the task that covers the filter activation. A main-thread task lasting more than 50 ms is a long task. That threshold describes one contiguous period of main-thread work—not the duration of the whole recording and not a Network request duration.
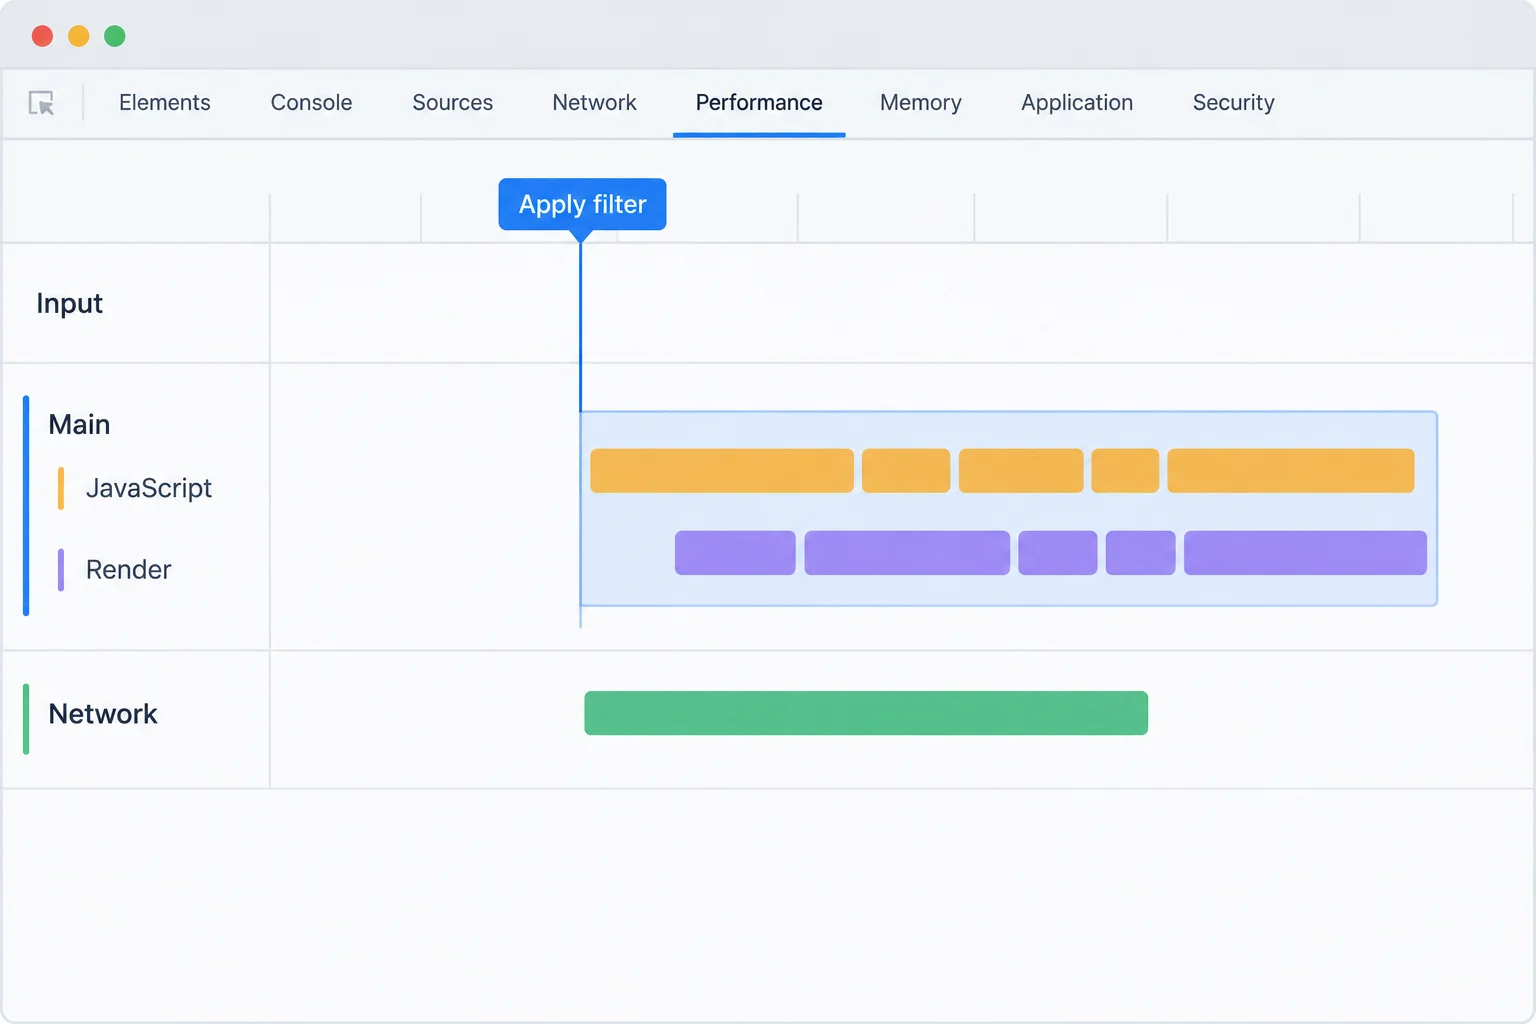
Use alignment in one Performance recording to investigate what happened around the activation. A Network bar and a main-thread task are different kinds of evidence.
Tip
DevTools itself, extensions, and background activity can add overhead. Keep the same tool configuration and major background activity for Interaction 1, Interaction 2, and Interaction 3; the goal is a comparable local measurement, not a perfectly overhead-free one.
Zoom into the task that contains the filter event. Expand its work in the available Call tree and inspect Bottom-up to find substantial JavaScript or rendering contributors. Select a frame to follow a source or stack location when DevTools offers one.
The fixture deliberately runs simulateFilterWork() for approximately 180 ms while filtering. It is an artificial diagnostic defect, not a production pattern. Trace or stack evidence may connect the task to that workload; an optimized bundle may instead show generated or shortened function names. In that case, record the generated location and correlate it carefully with the local source.
A task's total duration includes its nested work. Do not add an ancestor's inclusive time to the time of frames inside it: that would count the same elapsed time twice.
Use each view for a distinct evidence question.
| Evidence view | What it tells you | What to record |
|---|---|---|
| Main-thread task | One contiguous period of blocking work | The task's total duration |
| Call tree | Parent and nested work within the selected task | A substantial frame and its inclusive or self time |
| Bottom-up | Where time accumulates across call stacks | A costly contributor or caller path |
| Source or stack link | A location associated with a selected frame | File or generated location, when available |
| Network | Resource request lifecycle | Request timing; not task duration |
Match each item to the interpretation that keeps the evidence separate.
Tap an item and then its matching pair.
Using your Interaction 1 trace, locate the task covering the filter activation. Write four short statements:
Then state whether your trace and source or stack evidence support the documented synthetic filtering workload as a substantial contributor. Do not propose an optimization yet.
Write at least 180 characters (0/180).
Step 7 of 9
Interpret local filter-interaction recordings from user input through the next presented frame, and distinguish those samples from lifecycle INP.
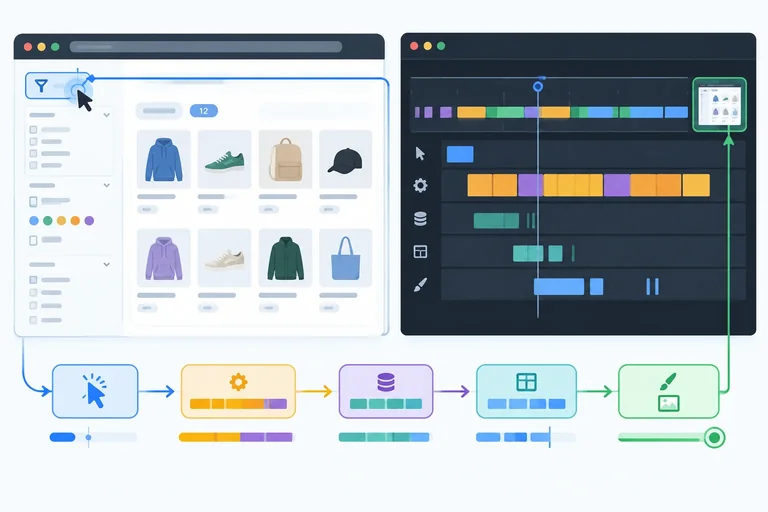
An interaction duration runs from a user action until the browser presents the next frame that reflects it. It has three phases:
Measuring only a click handler omits any earlier waiting and any work needed before the next paint. A responsive-looking result depends on the whole path, not just JavaScript inside the handler.
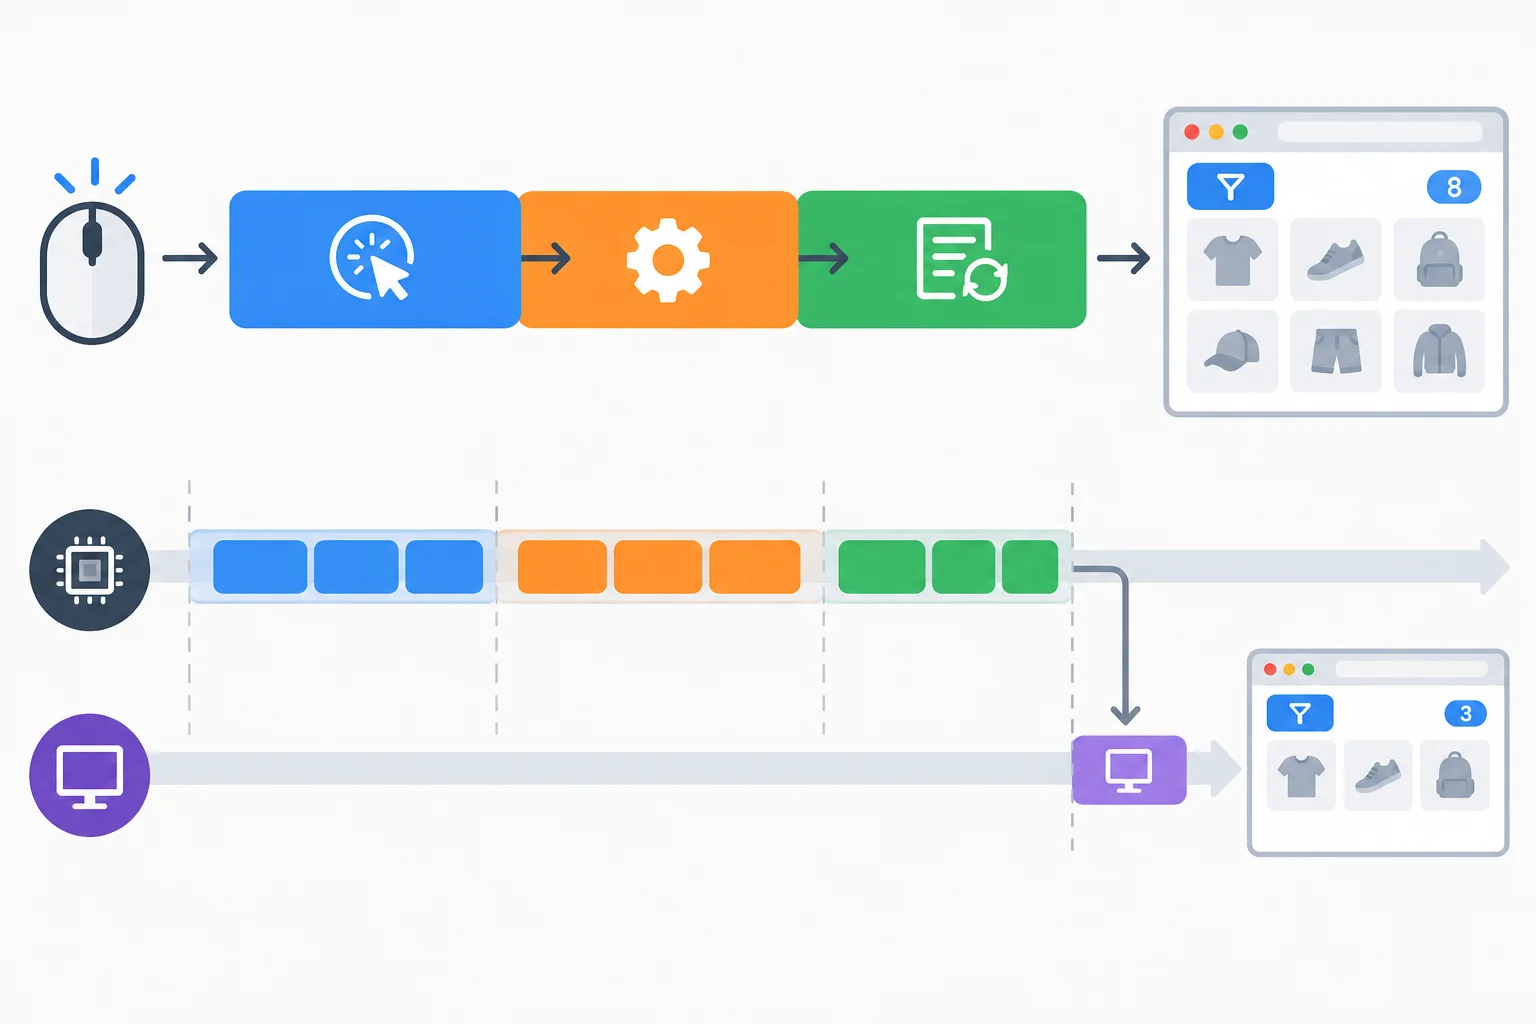
Schematic: the interaction ends when the updated frame is presented, not when the event callback returns.
In Chrome DevTools Performance, record the settled-page filter action and locate the click or interaction event. Select its details when available, then zoom into the surrounding main-thread and rendering activity.
Use the event boundaries to connect the phase breakdown to the trace. The task containing the filter action can include the deliberately bounded simulateFilterWork() workload, but inspect the event boundaries rather than treating every nearby task as handler time. Panel labels and available details can vary by Chrome version; navigate by the event, main-thread work, and next presented frame.
Use these timeline boundaries when the interaction details expose them.
| Phase | Timeline boundaries | What to inspect |
|---|---|---|
| Input delay | Input received → event begins | Queued work before the callback |
| Event-processing time | Event begins → event ends | Listener and synchronous JavaScript |
| Presentation delay | Event ends → next presented frame | Rendering work or other frame-blocking work |
Tip
A long task can explain substantial blocking, but it does not automatically equal the complete interaction duration. Input delay may precede the task, and presentation delay may follow the callback while the browser prepares and presents the update.
Create two more comparable local recordings.
For each run, retain the shared labels: Build, Browser, Viewport, DPR, Cache, CPU, Network, Scenario, Run, Observation, and Evidence. Record the interaction duration and available phase evidence; do not invent a phase value that the tool does not expose.
INP summarizes eligible click, tap, and keyboard interactions across a page visit. It uses a near-worst interaction with outlier handling, not an arithmetic average. Scrolling and hovering are not INP interactions.
Therefore, each filter trace here is a local interaction duration sample. One click—and especially one handler duration—does not establish the page's lifecycle INP.
Match each trace segment to its phase.
Tap an item and then its matching pair.
Using your evidence from Interaction 1, Interaction 2, and Interaction 3, write a short diagnostic note.
Write at least 180 characters (0/180).
Step 8 of 9
Apply inclusive reference thresholds while distinguishing controlled local evidence from real-user p75 field assessment.
Reference thresholds are interpretation guides, not a verdict about users. A value is in the good range when it is at or below its boundary—equality counts.
Keep the unit with every value. LCP is a duration, CLS is unitless, and INP is a duration that summarizes eligible interactions across a page visit. These boundaries help you describe a measurement consistently; they do not change what that measurement represents.
Use these inclusive boundaries when describing the metrics.
| Metric | Good range | Unit |
|---|---|---|
| LCP | At or below 2.5 s | s |
| CLS | At or below 0.1 | Unitless |
| INP | At or below 200 ms | ms |
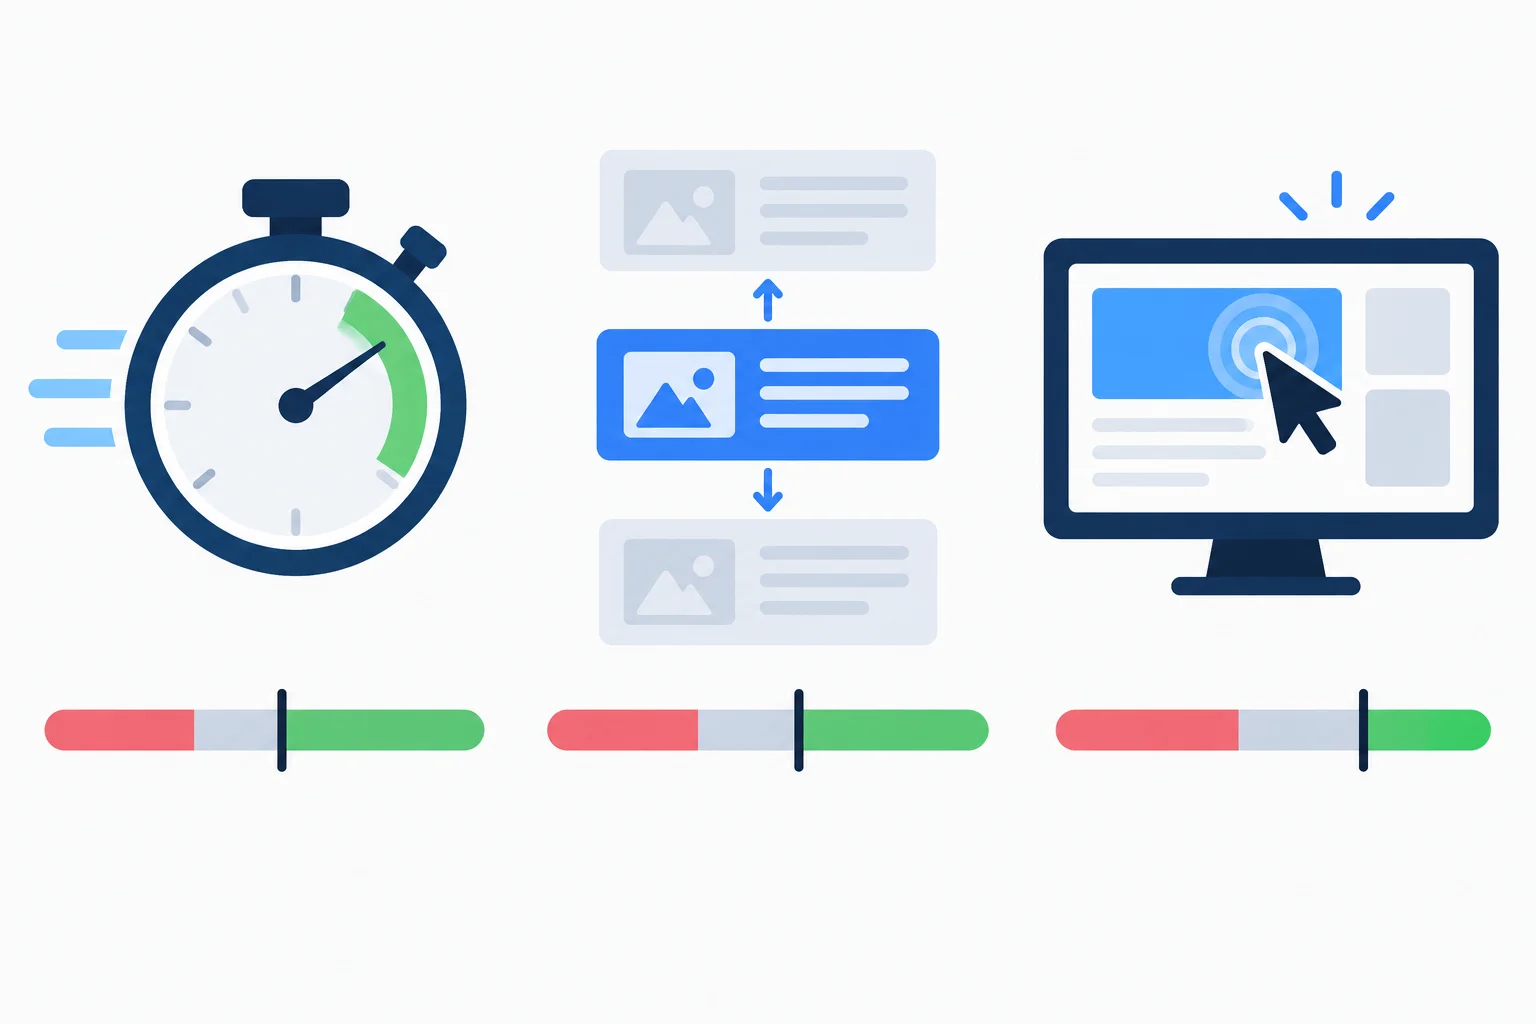
Treat each metric on its own scale: LCP in seconds, CLS as a unitless score, and lifecycle INP in milliseconds.
A local measurement diagnoses one defined situation: your current build, machine, Browser version, Viewport, DPR, state, scenario, and tool configuration. It is valuable evidence about that situation, but it is not a sample of everyone who uses the site.
A simulated CPU or Network setting can make a scenario repeatable. It remains a simulation, not an exact physical device or a population of users. A local tool’s displayed metrics do not establish real-user Core Web Vitals performance.
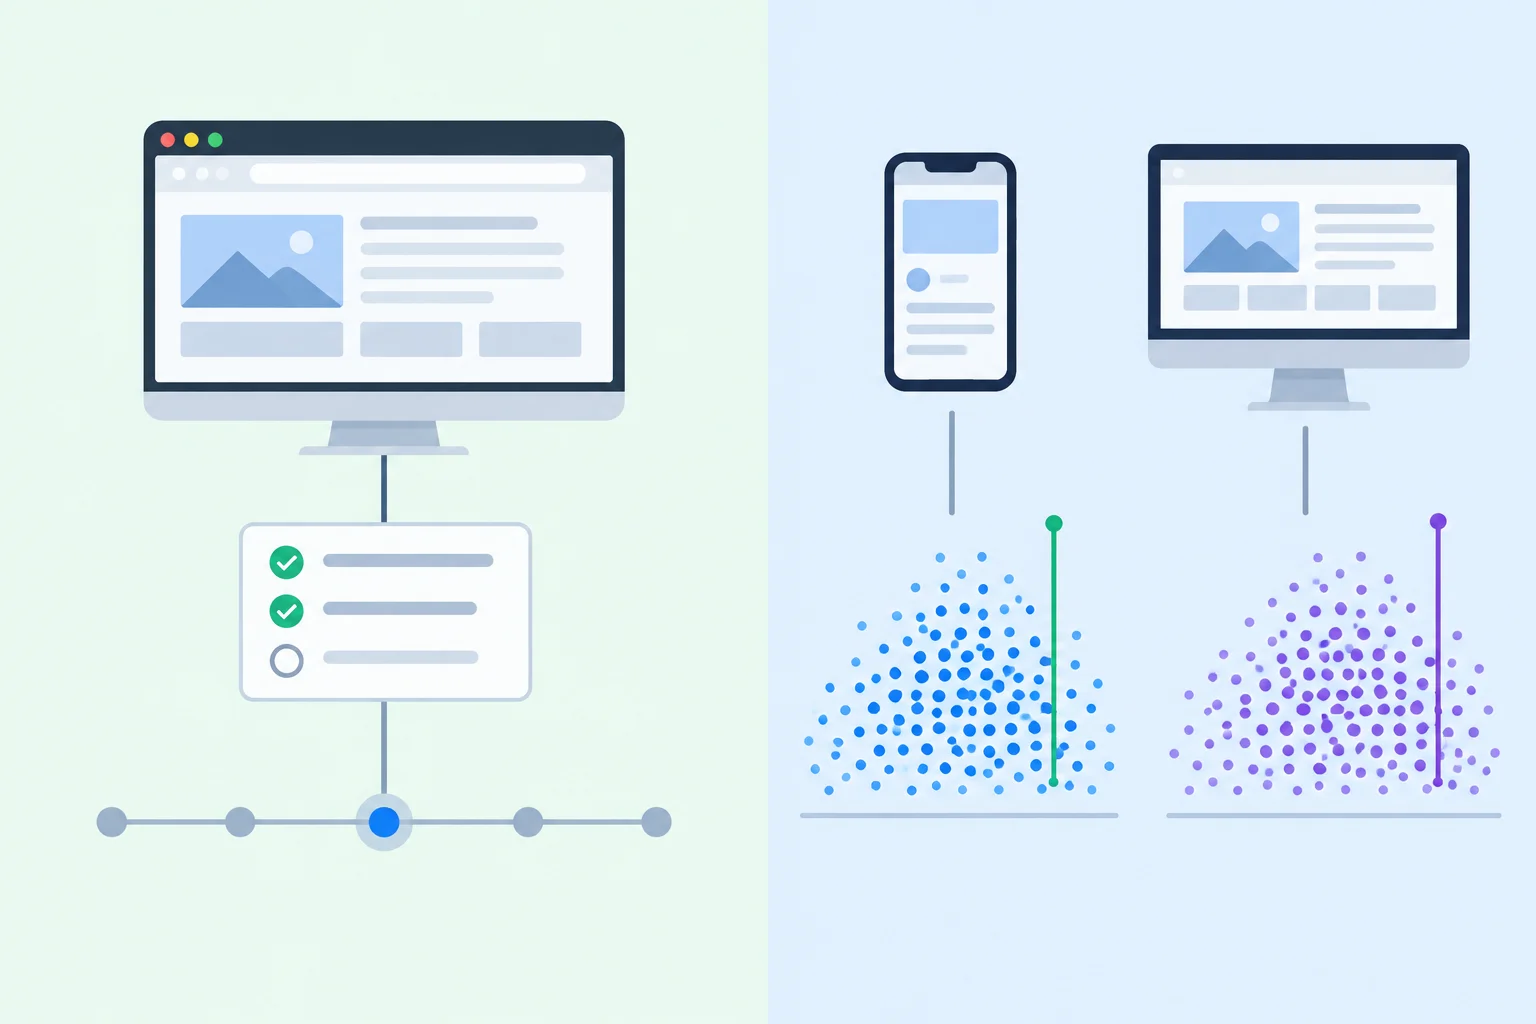
Local measurement examines one controlled scenario. Field data comes from many real-user measurements, with mobile and desktop considered separately.
A field assessment uses field data: measurements from real users. It evaluates the p75 value—the value at or below which 75% of the relevant real-user measurements fall. Mobile and desktop are considered separately.
Three local recordings, even with carefully fixed conditions, cannot establish either a mobile or desktop p75. They do not contain a distribution of real devices, networks, content states, and interactions.
Warning
Do not convert a local tool's displayed metric into a claim about real-user Core Web Vitals performance. State the recorded scenario and call the result local evidence.
A documented desktop local measurement of a fixed scenario records LCP at 2.5 s. Which conclusion is defensible?
Apply the boundaries and keep the evidence scopes separate.
A local recording reports LCP 2.5 s and CLS 0.1. Separately, imagine a real-user desktop field-data dataset whose lifecycle INP p75 is 200 ms. The same local recording also contains one filter interaction duration of 200 ms.
Write at least 300 characters (0/300).
Step 9 of 9
Consolidate repeatable local performance recordings into a preserved baseline, select one evidence-backed bottleneck hypothesis, and plan a comparable follow-up measurement.
A baseline is a preserved snapshot, not a single “best” trace. Keep the six recordings comparable: Load 1–Load 3 use the initial-load scenario, and Interaction 1–Interaction 3 use the settled-page filter scenario.
Create one local baseline log beside the current local-catalog source. Record the shared conditions once, then give every run its own observation and evidence location. Preserve the current source snapshot and its optimized baseline build identifier before any future change.
Use these exact labels:
Build: baseline source/build identifierBrowser: Chrome versionViewport: for example, 1280 × 800 CSS pxDPR: device pixel ratioCache: cold-cache procedureCPU: selected settingNetwork: selected settingScenario: load or filter procedure
For each recording, add Run:, Observation:, and Evidence:. Evidence can be a locally saved Performance trace, a screenshot, or a precise note naming the panel, track, and event.
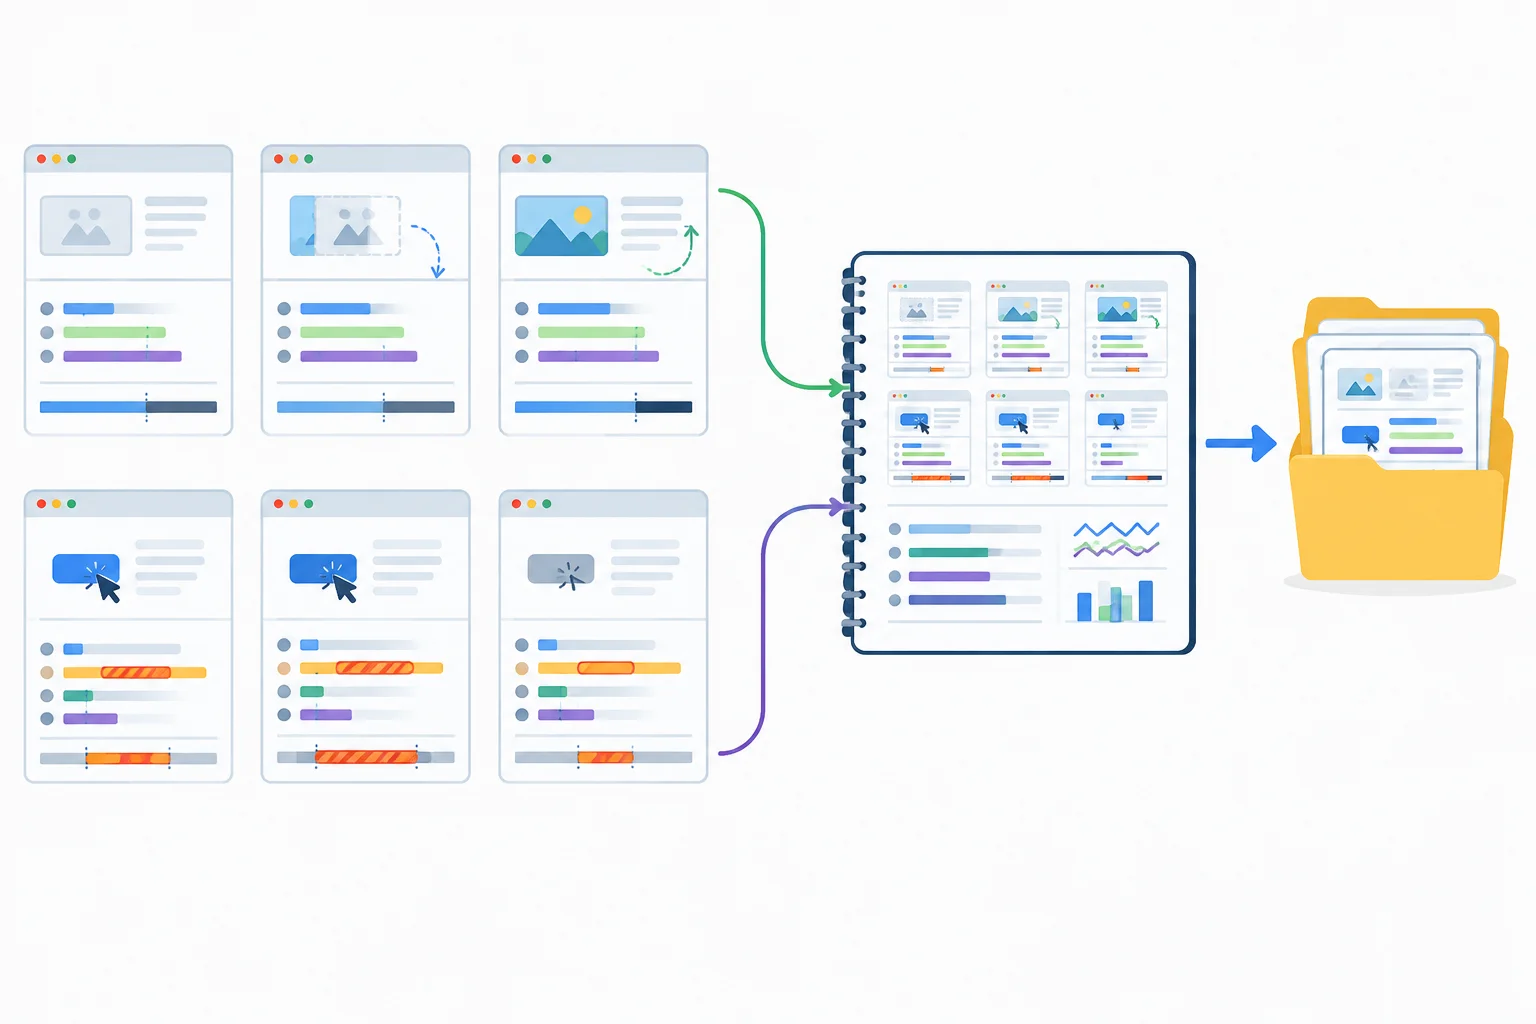
Treat the shared conditions, six individual recordings, and evidence locations as one reproducible local baseline.
Do not merge different scenarios into one number. Summarize the three comparable load readings separately from the three comparable interaction readings.
For a small repeated sample, report:
An unusual run is evidence to investigate, not permission to delete it. Check whether Cache, CPU, Network, background activity, extensions, reset state, or procedure changed. If conditions changed, mark that run as non-comparable rather than quietly treating it as the same experiment.
A single event-to-next-paint result is an interaction duration. Do not label one recorded interaction as INP.
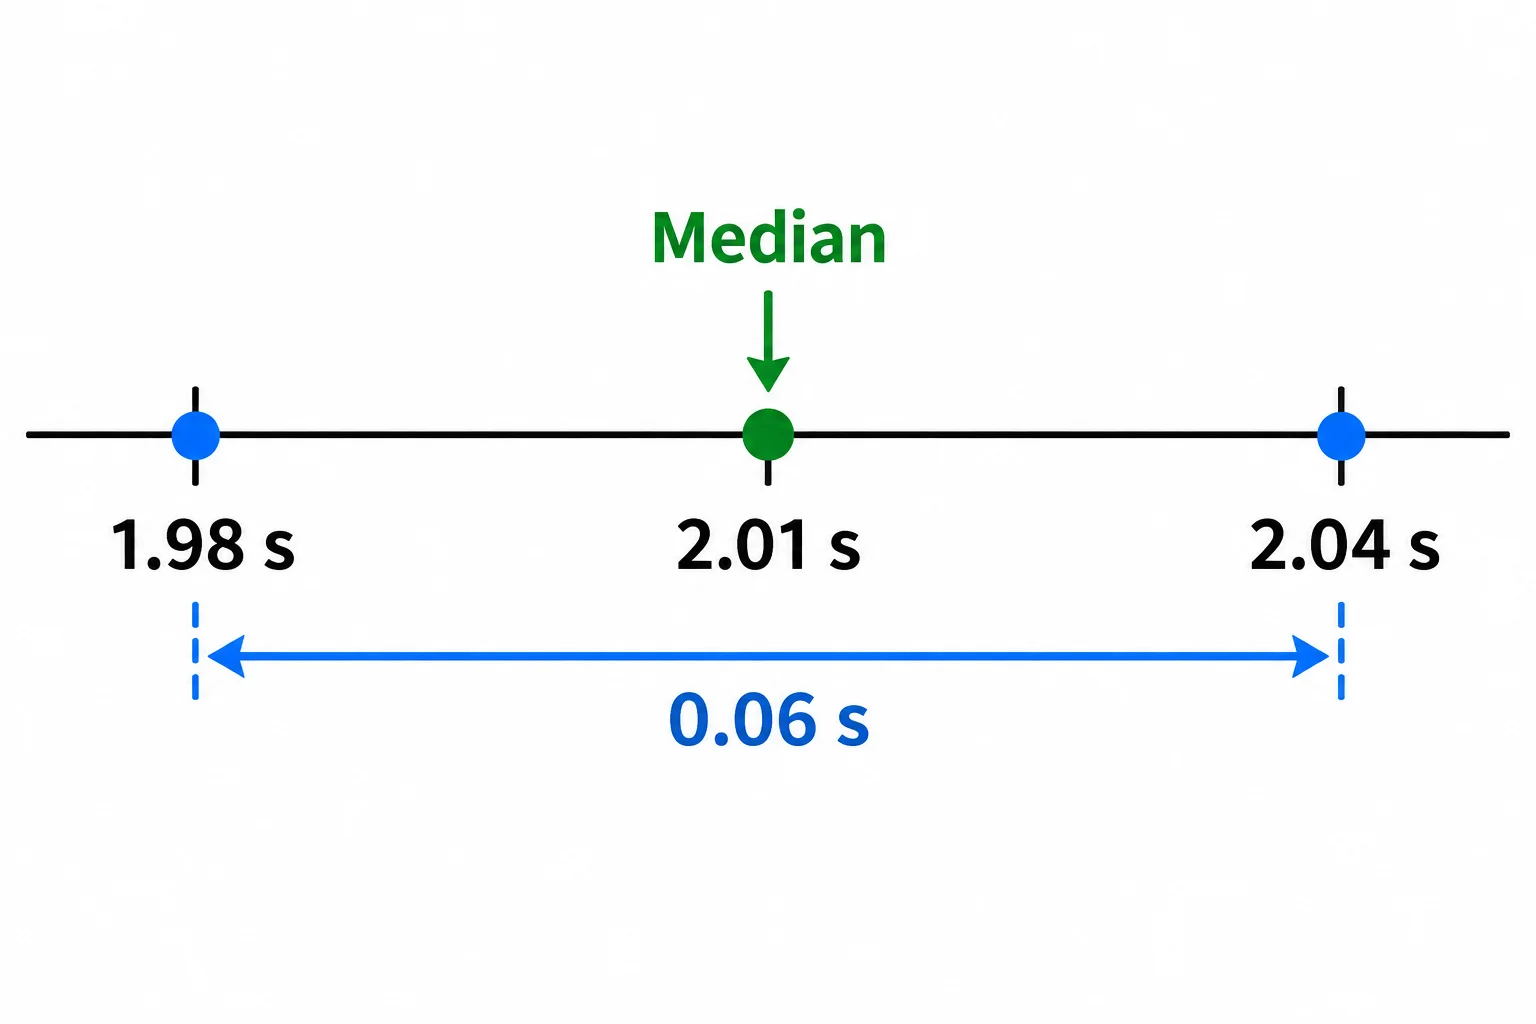
Order comparable readings first: the middle value is the median, and the minimum-to-maximum span is the range.
Illustrative local log only — replace these readings with your own.
| Run | Observation | Evidence |
|---|---|---|
| Load 1 | LCP 1.98 s; CLS 0.08; delayed hero insertion moved content | Performance trace: LCP and layout-shift events |
| Load 2 | LCP 2.04 s; CLS 0.09; delayed hero insertion moved content | Performance trace: Network track and screenshots |
| Load 3 | LCP 2.01 s; CLS 0.08; delayed hero insertion moved content | Performance trace: request and layout-shift details |
| Interaction 1 | interaction duration 214 ms; long task 184 ms during filtering | Performance trace: main-thread task and source/stack |
| Interaction 2 | interaction duration 202 ms; long task 181 ms during filtering | Performance trace: interaction-event details |
| Interaction 3 | interaction duration 219 ms; long task 186 ms during filtering | Performance trace: main-thread task and source/stack |
Example
For the example, the load LCP values ordered are 1.98 s, 2.01 s, and 2.04 s: median 2.01 s and range 0.06 s. The interaction durations ordered are 202 ms, 214 ms, and 219 ms: median 214 ms and range 17 ms.
These summaries describe this small local sample only. Keep the individual traces because a median cannot show where a delayed request, layout shift, or long task occurred.
Choose one bottleneck to investigate later; do not turn every observed issue into one vague target.
Write two separate statements:
A hypothesis is testable, not a conclusion already proven by a trace. Preserve alternative explanations as uncertainty.
Keep the baseline Build: identifier in its evidence log. If you later change source code, that creates a candidate build with a different Build: identifier. Rebuild it with npm run build and inspect it through the local preview server address printed by Vite. For a like-for-like comparison, keep Browser, Viewport, DPR, Cache, CPU, Network, Scenario, activation method, reset procedure, and tool configuration fixed. The intended source/build change is the experimental variable.
Example
Observation: In Interaction 1–Interaction 3, activating Apply filter produced a main-thread task above 50 ms. The traces and available source or stack evidence place simulateFilterWork() inside that task. The user-visible outcome is delayed feedback after the filter activation.
Causal hypothesis: The bounded synthetic work in simulateFilterWork() substantially contributes to filter interaction duration. After a later targeted source change, a candidate build with its own recorded Build: identifier should show a lower median interaction duration and a shorter task under the same Browser, Viewport, DPR, Cache, CPU, Network, Scenario, and procedure.
Uncertainty: Other queued event or rendering work may contribute. This small local sample does not establish real-user behavior.
Summary
Write your final local diagnostic summary using your actual recordings, not the illustrative values in this lesson.
Include all of the following:
Build, Browser, Viewport, DPR, Cache, CPU, Network, and Scenario conditions;Load 1–Load 3 and Interaction 1–Interaction 3, with relevant readings plus median and range for comparable results;Build: identifier after an intended source change, and keep the remaining conditions and procedure fixed.End with one explicit sentence stating what this local baseline establishes and what it does not establish about field data.
Write at least 700 characters (0/700).
Congratulations! You completed: Measure Loading and Responsiveness Locally
Thousands of online courses in video, ebooks and audiobooks.
To test your knowledge during online courses
Generated directly from your cell phone's photo gallery and sent to your email

Download our app via QR Code or the links below:.



Carry knowledge in your pocket.
Download the Cursa app.
There are hundreds of free courses available, with a free certificate of completion that is saved in your mobile image gallery.
Download the app to access the Course Completion Certificate for Free.


+ 10 million
students

Free and Valid
Certificate

60 thousand free
exercises

4.8/5 rating in
app stores

Free courses in
video and ebooks