
Step 1 of 8
Prepare a Repeatable React Profile
Create a deterministic local Product Explorer baseline, locate React DevTools Profiler, and record one clearly bounded interaction under documented conditions.

Learning path · Level 13 · Tutorial 5
Use the React Profiler to find expensive render work, apply the smallest justified state-placement or memoization change, and verify that the interaction improves without changing its behavior.

 Prepare a Repeatable React Profile
Create a deterministic local Product Explorer baseline, locate React DevTools Profiler, and record one clearly bounded interaction under documented conditions. 4 min
Prepare a Repeatable React Profile
Create a deterministic local Product Explorer baseline, locate React DevTools Profiler, and record one clearly bounded interaction under documented conditions. 4 min
 Turn Profiler Evidence into a Hypothesis
Use commit-level Profiler evidence, component-tree accounting, and render reasons to form a narrow hypothesis before changing React code. 4 min
Turn Profiler Evidence into a Hypothesis
Use commit-level Profiler evidence, component-tree accounting, and render reasons to form a narrow hypothesis before changing React code. 4 min
 Shrink Render Scope with State Locality
Move private note state into its only consumer, then verify that Note editing has a narrower render scope without changing shared-state behavior. 3 min
Shrink Render Scope with State Locality
Move private note state into its only consumer, then verify that Note editing has a narrower render scope without changing shared-state behavior. 3 min
 Memoize a Measured Component Boundary
Apply React.memo selectively to the measured ProductSummary boundary, then reason about prop identity and updates that can bypass equal parent props. 3 min
Memoize a Measured Component Boundary
Apply React.memo selectively to the measured ProductSummary boundary, then reason about prop identity and updates that can bypass equal parent props. 3 min
 Cache Expensive Pure Work with useMemo
Use useMemo to cache measured pure ranking work while preserving necessary list updates, the 50-result limit, and complete dependency handling. 3 min
Cache Expensive Pure Work with useMemo
Use useMemo to cache measured pure ranking work while preserving necessary list updates, the 50-result limit, and complete dependency handling. 3 min
 Stabilize Callbacks Only Where They Help
Stabilize a selection callback only where a measured memoized row boundary can benefit, while preserving correct current-state updates. 3 min
Stabilize Callbacks Only Where They Help
Stabilize a selection callback only where a measured memoized row boundary can benefit, while preserving correct current-state updates. 3 min
 Verify Cost, Responsiveness, and Behavior
Verify React rendering optimizations with comparable development profiles, a separate optimized-build browser check, and focused behavior tests. 4 min
Verify Cost, Responsiveness, and Behavior
Verify React rendering optimizations with comparable development profiles, a separate optimized-build browser check, and focused behavior tests. 4 min
 Make and Defend a Profiling-Based Decision
Turn React profiling evidence into a small, testable optimization decision and document how you would verify it without changing behavior. 3 min
Make and Defend a Profiling-Based Decision
Turn React profiling evidence into a small, testable optimization decision and document how you would verify it without changing behavior. 3 min
Step 1 of 8
Create a deterministic local Product Explorer baseline, locate React DevTools Profiler, and record one clearly bounded interaction under documented conditions.
Create the fixture in a new local directory. The Product Explorer application itself uses no network data or external assets: it generates its deterministic 5,000-product dataset locally. The commands install the standard Vite React–TypeScript dependencies, then you will replace the generated source files with the complete sections in this step.
Keep StrictMode enabled. This baseline intentionally keeps query, selectedIds, and note in CatalogApp; do not optimize it yet.
Run these commands in a terminal from the parent directory where you want the project folder created.
npm create vite@latest product-explorer -- --template react-ts
cd product-explorer
npm installScaffolding project in ./product-explorer... Done. Now run: cd product-explorer npm install added 190 packages, and audited 191 packages in 12s found 0 vulnerabilities
The npm, Node.js, Vite, package, timing, and audit messages vary by machine. The important result is a `product-explorer` directory with installed dependencies.
Create src/data.ts and replace its contents with this complete deterministic data source.
export type Category = 'Books' | 'Games' | 'Tools';

export interface Product {
  readonly id: number;
  readonly name: string;
  readonly category: Category;
  readonly score: number;
}

const categories: readonly Category[] = ['Books', 'Games', 'Tools'];

export const PRODUCTS: readonly Product[] = Object.freeze(
  Array.from({ length: 5000 }, (_, index): Product => {
    const id = index + 1;

    return Object.freeze({
      id,
      name: `Product ${String(id).padStart(4, '0')}`,
      category: categories[index % categories.length],
      score: (id * 37) % 1000,
    });
  }),
);Create src/catalog.ts and replace its contents. rankProducts does not mutate the source array and keeps the original product object references.
import type { Category, Product } from './data';

export function rankProducts(
  products: readonly Product[],
  query: string,
): Product[] {
  const needle = query.trim().toLowerCase();
  const matches = products.filter((product) => {
    const searchable = `${product.name} ${product.category}`.toLowerCase();
    return searchable.includes(needle);
  });

  return [...matches].sort((first, second) =>
    second.score - first.score || first.id - second.id,
  );
}

export function summarizeProducts(
  products: readonly Product[],
): Record<Category, number> {
  return products.reduce<Record<Category, number>>(
    (counts, product) => ({
      ...counts,
      [product.category]: counts[product.category] + 1,
    }),
    { Books: 0, Games: 0, Tools: 0 },
  );
}Replace src/App.tsx by pasting the following three sections consecutively, in order. Then replace src/main.tsx with the supplied file. No helpers are omitted: this is the unoptimized baseline used throughout the tutorial.
src/App.tsx — part 1 of 3
import { useState } from 'react';
import { PRODUCTS, type Product } from './data';
import { rankProducts, summarizeProducts } from './catalog';

function ProductSummary({ products }: { products: readonly Product[] }) {
  const summary = summarizeProducts(products);

  return (
    <section aria-label='Product summary'>
      <h2>Product summary</h2>
      <ul>
        {(['Books', 'Games', 'Tools'] as const).map((category) => (
          <li key={category}>
            {category}: {summary[category]}
          </li>
        ))}
      </ul>
    </section>
  );
}

type ProductRowProps = {
  product: Product;
  selected: boolean;
  onToggle: (id: number) => void;
};

function ProductRow({ product, selected, onToggle }: ProductRowProps) {
  return (
    <li>
      <label>
        <input
          type='checkbox'
          checked={selected}
          aria-label={`Select ${product.name}`}
          onChange={() => onToggle(product.id)}
        />
        {product.name} — {product.category} — score {product.score}
      </label>
    </li>
  );
}src/App.tsx — part 2 of 3
type ProductListProps = {
  products: readonly Product[];
  selectedIds: number[];
  handleToggle: (id: number) => void;
};

function ProductList({
  products,
  selectedIds,
  handleToggle,
}: ProductListProps) {
  return (
    <ul>
      {products.map((product) => (
        <ProductRow
          key={product.id}
          product={product}
          selected={selectedIds.includes(product.id)}
          onToggle={handleToggle}
        />
      ))}
    </ul>
  );
}

type NoteEditorProps = {
  note: string;
  onChange: (value: string) => void;
};

function NoteEditor({ note, onChange }: NoteEditorProps) {
  return (
    <label>
      Private note
      <textarea
        value={note}
        onChange={(event) => onChange(event.target.value)}
      />
    </label>
  );
}src/App.tsx — part 3 of 3
export default function CatalogApp() {
  const [query, setQuery] = useState('');
  const [selectedIds, setSelectedIds] = useState<number[]>([]);
  const [note, setNote] = useState('');
  const rankedProducts = rankProducts(PRODUCTS, query).slice(0, 50);

  function handleToggle(id: number) {
    setSelectedIds((current) =>
      current.includes(id)
        ? current.filter((selectedId) => selectedId !== id)
        : [...current, id],
    );
  }

  return (
    <main>
      <h1>Product Explorer</h1>
      <label>
        Search products
        <input
          value={query}
          onChange={(event) => setQuery(event.target.value)}
        />
      </label>
      <NoteEditor note={note} onChange={setNote} />
      <p aria-live='polite'>Selected products: {selectedIds.length}</p>
      <ProductSummary products={PRODUCTS} />
      <ProductList
        products={rankedProducts}
        selectedIds={selectedIds}
        handleToggle={handleToggle}
      />
    </main>
  );
}Replace src/main.tsx with this file. Keeping StrictMode is deliberate for this development baseline.
import { StrictMode } from 'react';
import { createRoot } from 'react-dom/client';
import CatalogApp from './App';

createRoot(document.getElementById('root')!).render(
  <StrictMode>
    <CatalogApp />
  </StrictMode>,
);Start the local development server from the product-explorer directory, then open the Local address printed in your terminal.
npm run dev> product-explorer@0.0.0 dev > vite VITE v6.0.0 ready in 180 ms ➜ Local: http://localhost:5173/ ➜ press h + enter to show help
The package name, Vite version, and port can differ. Use your own terminal's Local URL.
Tip
Confirm the visible baseline before profiling:
Search products is visible.Private note is visible.Selected products: 0.Select Product 0001.If any check fails, correct the local source before recording. The 50-row limit is part of this fixture, even though ranking reads all 5,000 products.
Install the official React Developer Tools extension for your browser if it is not installed. With the local application open, open browser DevTools and locate the React DevTools Profiler panel. Its placement and control names can vary by browser and extension version.
A Profiler recording contains React commits during a bounded period. It is evidence about component render work; it is not a replacement for the browser Performance panel.
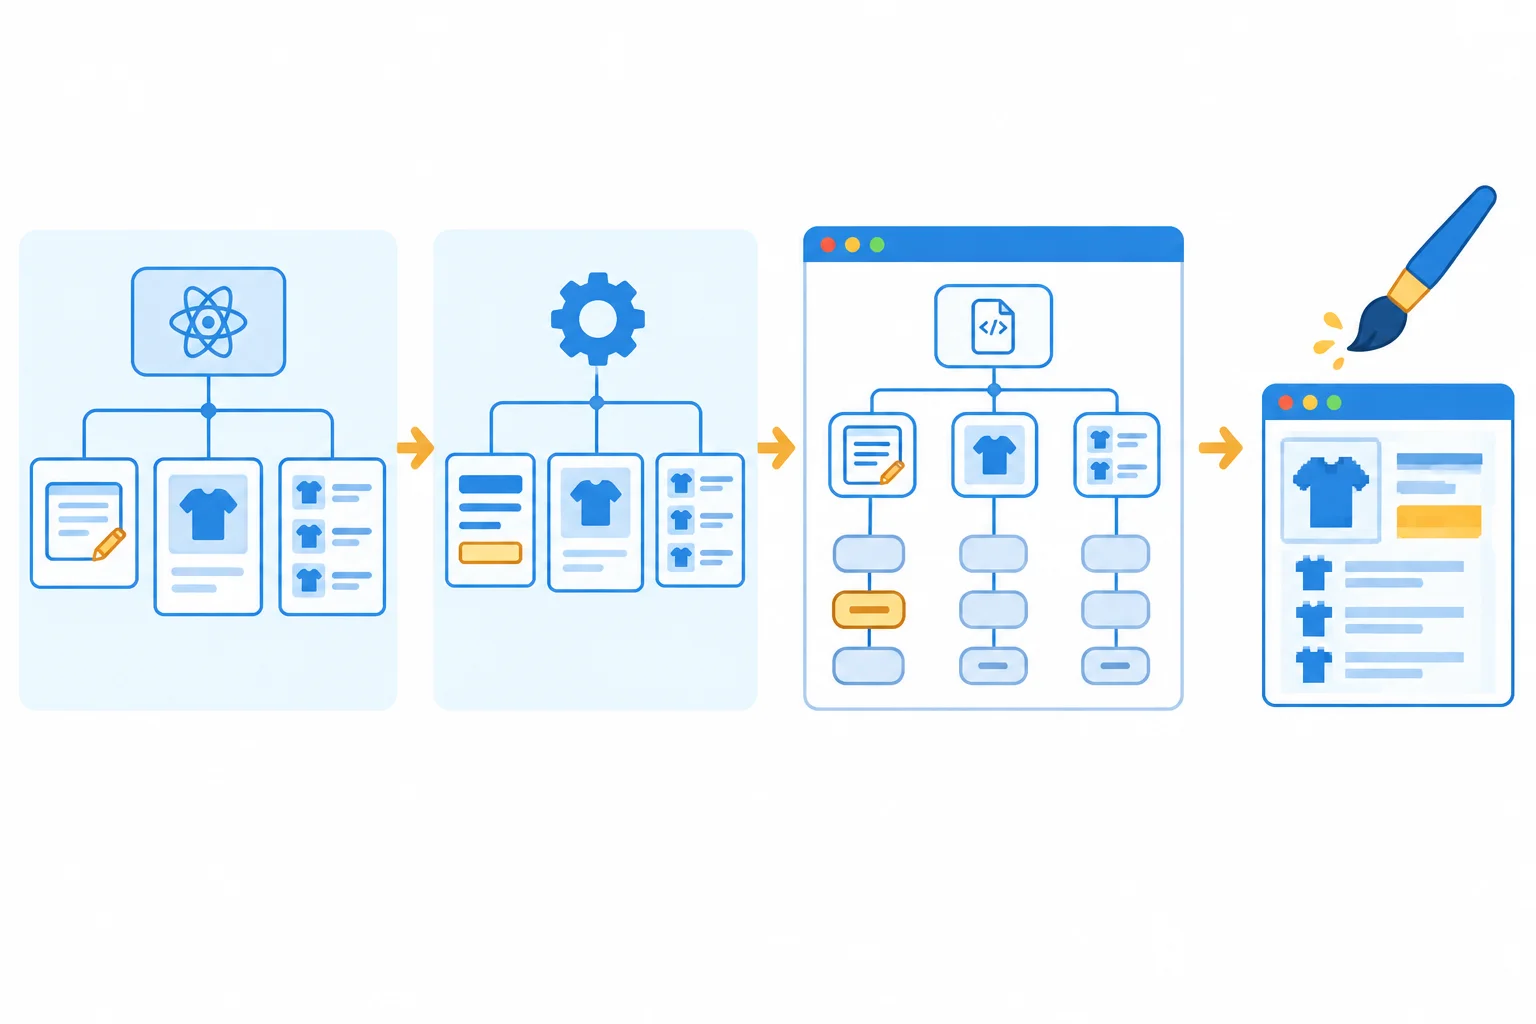
The render phase calculates component output. The commit phase applies necessary DOM changes. A component can render even when React finds no DOM mutation to make; browser paint is a separate concern.
During the render phase, React calculates what component output should be. During the commit phase, React applies the necessary DOM changes. Therefore, a component function running does not automatically mean that the DOM changed. Neither event proves that pixels have painted on screen.
Keep this distinction when reading a recording: render duration is React component work, not a whole-interaction timing and not INP.
Tip
Keep each capture narrow: first reset the scenario, perform its interaction once without recording to warm up, then reset to the same starting state. Only then start recording, perform the stated action, and stop.
Do not substitute console.log render counts for Profiler evidence. Development checks under StrictMode can repeat component execution. Record that Strict Mode is enabled instead of interpreting repeated console output as measured cost.
Use the same fixed scenario every time. Reset before each recording. Setup actions—including entering an initial query for Selection—stay outside the recorded interaction.
Keep development Profiler records separate from later optimized-build browser checks.
| Scenario | Starting state | Recorded action |
|---|---|---|
| Note editing | Empty note; empty search | Type `review` into Private note |
| Filtering | Empty search; empty note | Type `tools` into Search products |
| Selection | Search set to `tools` | Toggle the first visible product twice |
Write concrete values from your own computer beside every baseline capture.
| Evidence item | What to record |
|---|---|
| Data size | 5,000 products |
| Browser and extension | Browser name/version; React Developer Tools version |
| Build mode | Development |
| React checks | Strict Mode enabled |
| Compiler status | React Compiler not used |
| Recording setup | Viewport and any CPU throttling |
| Scenario | Fixed scenario and recorded action |
Put the recording workflow in order.
Capture one fixed scenario locally, then write a compact baseline log. Include the workflow in order; whether a component render automatically means a DOM mutation and why; the scenario captured; and your browser/version, extension version, build mode, Strict Mode status, compiler status, data size, viewport, and throttling setting.
Write at least 180 characters (0/180).
Step 2 of 8
Use commit-level Profiler evidence, component-tree accounting, and render reasons to form a narrow hypothesis before changing React code.
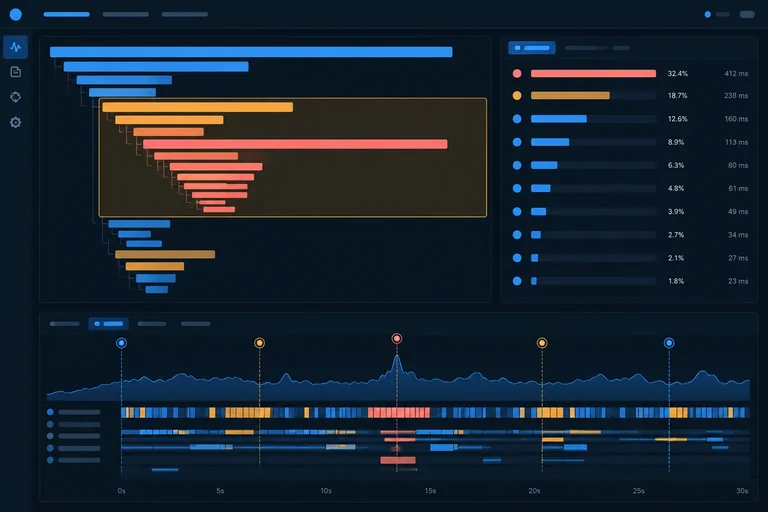
A Profiler recording is a sequence of commits, not one score for the entire trace. After recording one bounded scenario, locate the commits caused by the action itself. Ignore setup, initial mounting, and any warm-up work outside that action.
For example, a Note editing recording may contain several commits as the learner types. Inspect the commits associated with those keystrokes individually. A single unusually expensive commit can matter more than a low average that hides it.
A commit’s render duration describes component rendering associated with that commit. It is not a measurement of the whole interaction.
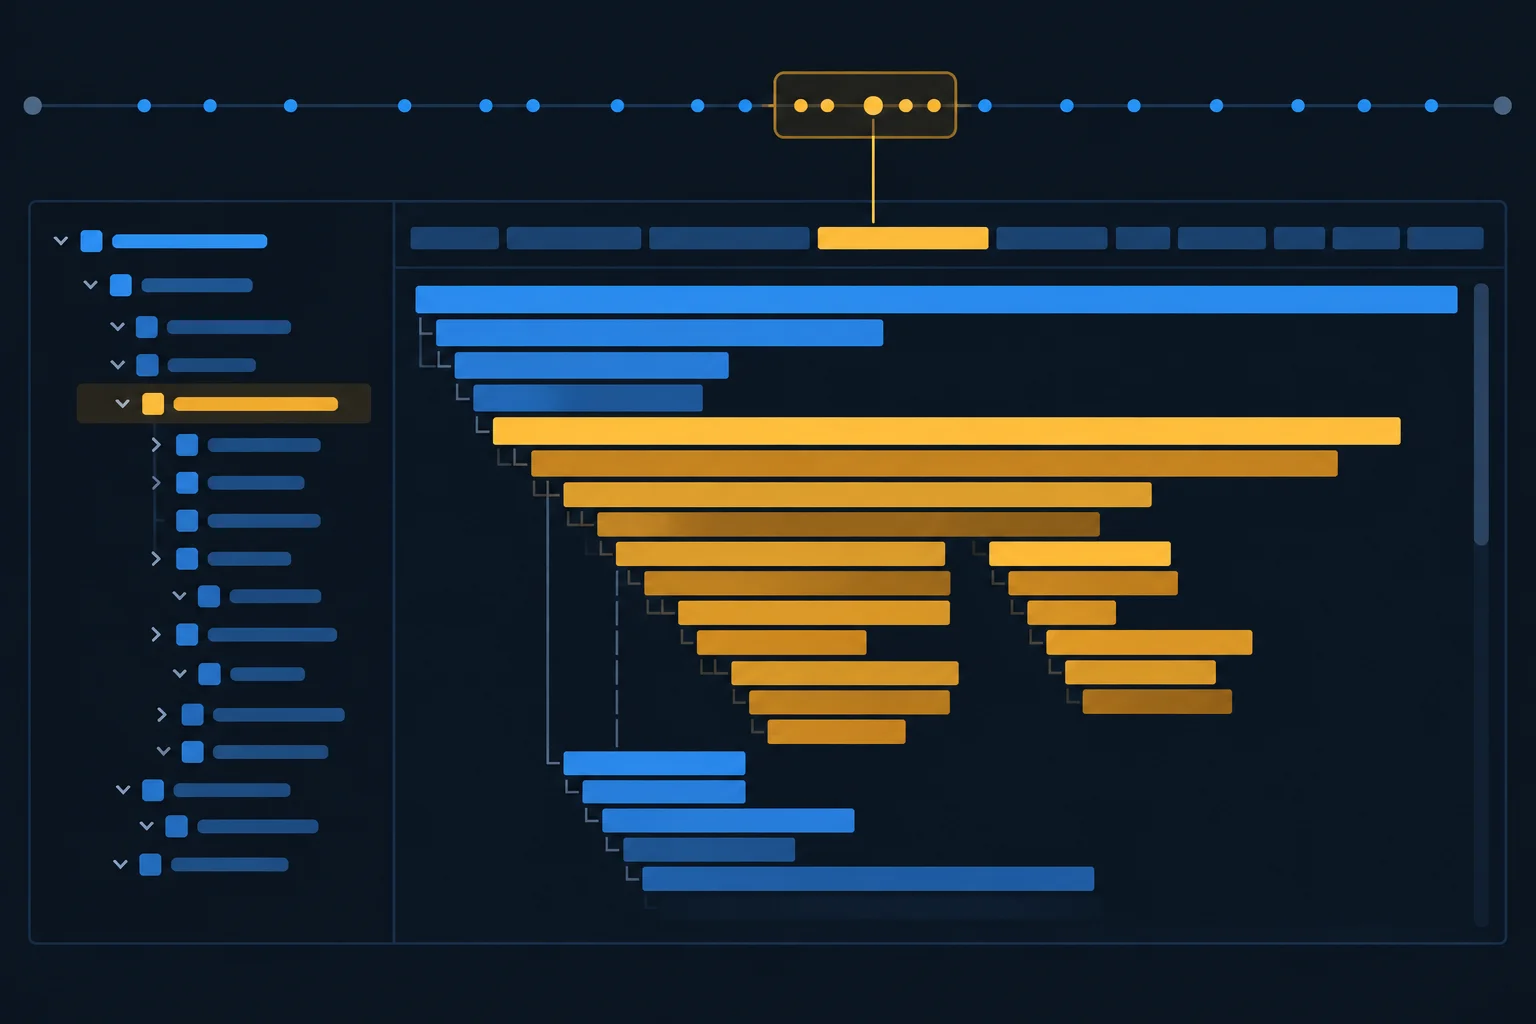
Start with the commits produced by one recorded action, rather than combining unrelated work across the entire recording.
Use the flamegraph and ranked views together. The flamegraph shows where costly work sits in the component tree; the ranked view helps surface components contributing substantial render work. Exact controls and labels can vary by DevTools version.
Do not add a parent’s subtree duration to durations of descendants inside that subtree. Descendant work is already included. Compare either non-overlapping subtrees or a component’s own work at one chosen level of the tree.
Illustrative render-duration accounting for one selected commit. A subtree total already contains its descendants.
| Element | Own work | Descendant work | Subtree total |
|---|---|---|---|
| CatalogApp | 0.9 ms | 28.0 ms | 28.9 ms |
| ProductList | 1.6 ms | 18.0 ms | 19.6 ms |
| 50 ProductRow instances | 18.0 ms | 0.0 ms | 18.0 ms |
| ProductSummary | 8.4 ms | 0.0 ms | 8.4 ms |
Tip
Here, ProductList’s 19.6 ms subtree already includes the 18.0 ms from the ProductRow instances. Adding those numbers would falsely report 37.6 ms.
A useful first comparison is ProductList’s 19.6 ms subtree versus its sibling ProductSummary at 8.4 ms. Drill into ProductList only if the rows or the list’s own work need separate investigation.
Before a new recording, enable render-reason recording if your React DevTools version provides it. Then capture the same bounded scenario again. A reason such as state changed, props changed, context changed, or parent rendered is evidence about a trigger—not proof that the render was wasteful.
Do not infer a cause from flamegraph color alone. Combine the recorded reason, the component’s duration, and the source relationship you expect.
These are candidate explanations to test, not conclusions to optimize immediately.
| Scenario | Evidence to inspect | Candidate cause | Testable prediction |
|---|---|---|---|
| Note editing | CatalogApp state update; unrelated branches participate | Frequently edited note state may be owned too broadly | ProductList and ProductSummary appear during note typing although their inputs are unchanged |
| Filtering | query state changes in CatalogApp; ranking creates a new products array; ProductList reports changed products prop | Ranking work may be substantial, but a changed query legitimately requires new results | Ranking runs for the changed query and ProductList receives the newly ranked products array; first establish whether the work is significant |
| Selection | Products and query are unchanged while ranking runs again | A repeated pure calculation may run during selection | The same ranking work appears on selection commits despite unchanged ranking inputs |
| Selection | Unchanged rows report an onToggle prop change | A new function reference may defeat a row boundary | Many unchanged rows participate when the handler identity changes |
Tip
A frequent render is not automatically expensive, and an expensive render is not automatically avoidable. State, prop, context, and parent-related reasons help form a narrow claim that a later recording can confirm or reject.
Warning
Profiler commit data does not include all browser work. It does not measure every effect, layout, paint, or every render attempt, and its render duration is not whole-interaction timing. Use the browser Performance panel separately when you need browser-level evidence; do not treat the two measurements as interchangeable.
Interpret this annotated, Illustrative Selection commit:
CatalogApp: reason — selectedIds state changed; own work — 0.8 ms.ProductList: reason — parent rendered; own work — 1.5 ms.ProductRow instances: reason — onToggle prop changed; combined own work — 17.8 ms.ProductList subtree total — 19.3 ms.ProductSummary: reason — parent rendered; own work — 8.4 ms.Name one significant target without double-counting nested work. Then state one specific, falsifiable hypothesis that connects an observed render reason to why that target participated in this Selection commit. Describe what a comparable later recording would need to show to support the hypothesis.
Write at least 120 characters (0/120).

Step 3 of 8
Move private note state into its only consumer, then verify that Note editing has a narrower render scope without changing shared-state behavior.
A state update starts at the component that owns that state. If CatalogApp owns the private note, every keystroke makes CatalogApp participate, bringing its sibling branches into the render scope.
note is consumed only by NoteEditor, so NoteEditor is its narrowest valid owner. In contrast, query coordinates the search control and product ranking, while selectedIds coordinates the visible list and the Selected products status. Keep those shared values in CatalogApp.
Do not push every value downward by default. Place state at the lowest boundary that must coordinate all of its consumers.
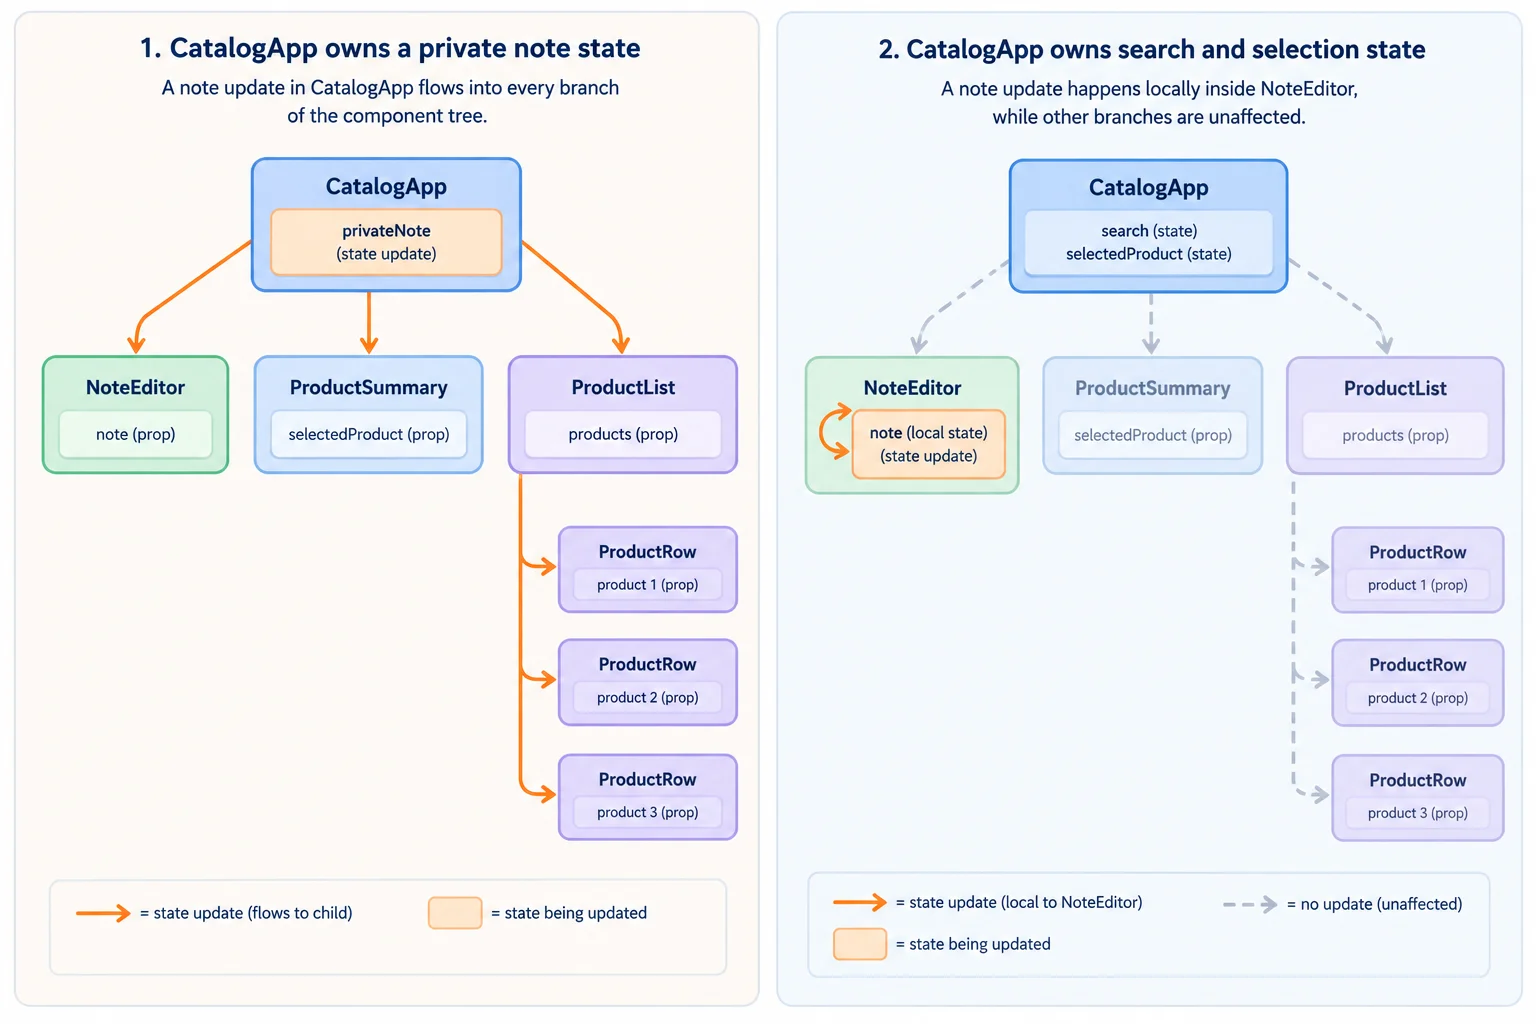
After the move, a Note editing update should be contained within NoteEditor rather than starting at CatalogApp.
Make one ownership change in src/App.tsx: replace the old NoteEditorProps type and prop-based NoteEditor definition with this local-state component. The existing named useState import remains valid.
This keeps one authoritative note value. Do not create a second copy in CatalogApp and synchronize it with an Effect. Because NoteEditor stays mounted while searching or selecting, its note remains present during those interactions. If the application is unmounted and mounted again, the editor starts empty, as it did before.
function NoteEditor() {
  const [note, setNote] = useState('');

  return (
    <label>
      Private note
      <textarea
        value={note}
        onChange={(event) => setNote(event.target.value)}
      />
    </label>
  );
}// Delete this state line from CatalogApp.
const [note, setNote] = useState('');
// Replace the existing prop-based element with this element.
<NoteEditor />Tip
In the baseline shown earlier, the element being replaced is <NoteEditor note={note} onChange={setNote} />. Remove that whole element, including both props, and insert <NoteEditor /> in the same position.
Keep query and selectedIds as one authoritative value each in CatalogApp. Copying either into independent state would require synchronization and could make the search results, selected count, and row checkboxes disagree.
Complete the local state initializer in NoteEditor.
function NoteEditor() {
  const [note, setNote] = ('');

  return (
    <label>
      Private note
      <textarea
        value={note}
        onChange={(event) => setNote(event.target.value)}
      />
    </label>
  );
}Warm up without recording, then restore the fixed Note editing starting state: the note is empty. In React DevTools Profiler, start a fresh recording only after setup. Type review into Private note, then stop recording.
Inspect commits caused by those keystrokes. The prediction is that NoteEditor participates, while CatalogApp, ProductSummary, ProductList, and ProductRow do not participate because of this note update. Record Filtering and Selection separately when needed; moving note state does not itself predict a reduction for those scenarios.
After making the change and recording Note editing locally, write a compact evidence report. Include:
query and selectedIds must remain shared in CatalogApp, rather than being copied into independent state.State your actual observation rather than inventing a duration or result.
Write at least 220 characters (0/220).
Step 4 of 8
Apply React.memo selectively to the measured ProductSummary boundary, then reason about prop identity and updates that can bypass equal parent props.
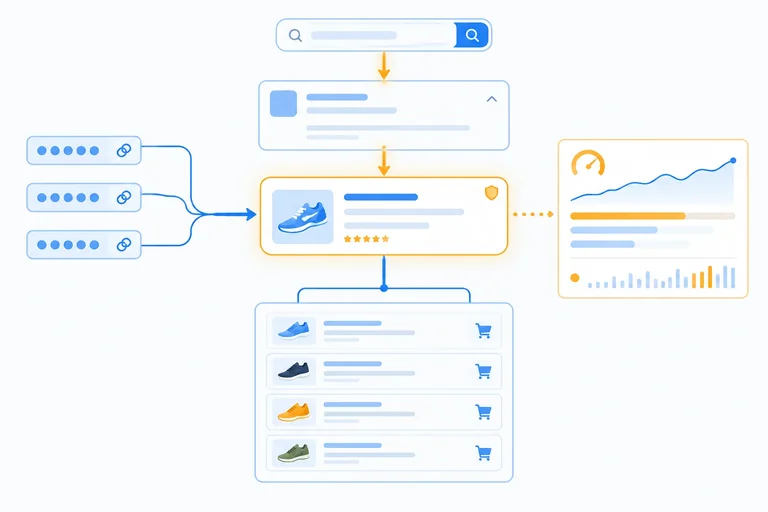
React.memo is a component-boundary optimization. When a parent updates, React can skip rendering a memoized child when every received prop compares equal to its previous value.
This is an opportunity to skip parent-driven work, not a promise that a component will never render. In Product Explorer, Filtering changes query in CatalogApp, while ProductSummary continues to receive the same immutable module-level PRODUCTS reference. Earlier profiling made this summary a candidate worth testing.
State locality remains the better first response when a frequently updated value is private to one component. Memoization is justified only when the measured boundary has meaningful work to avoid.
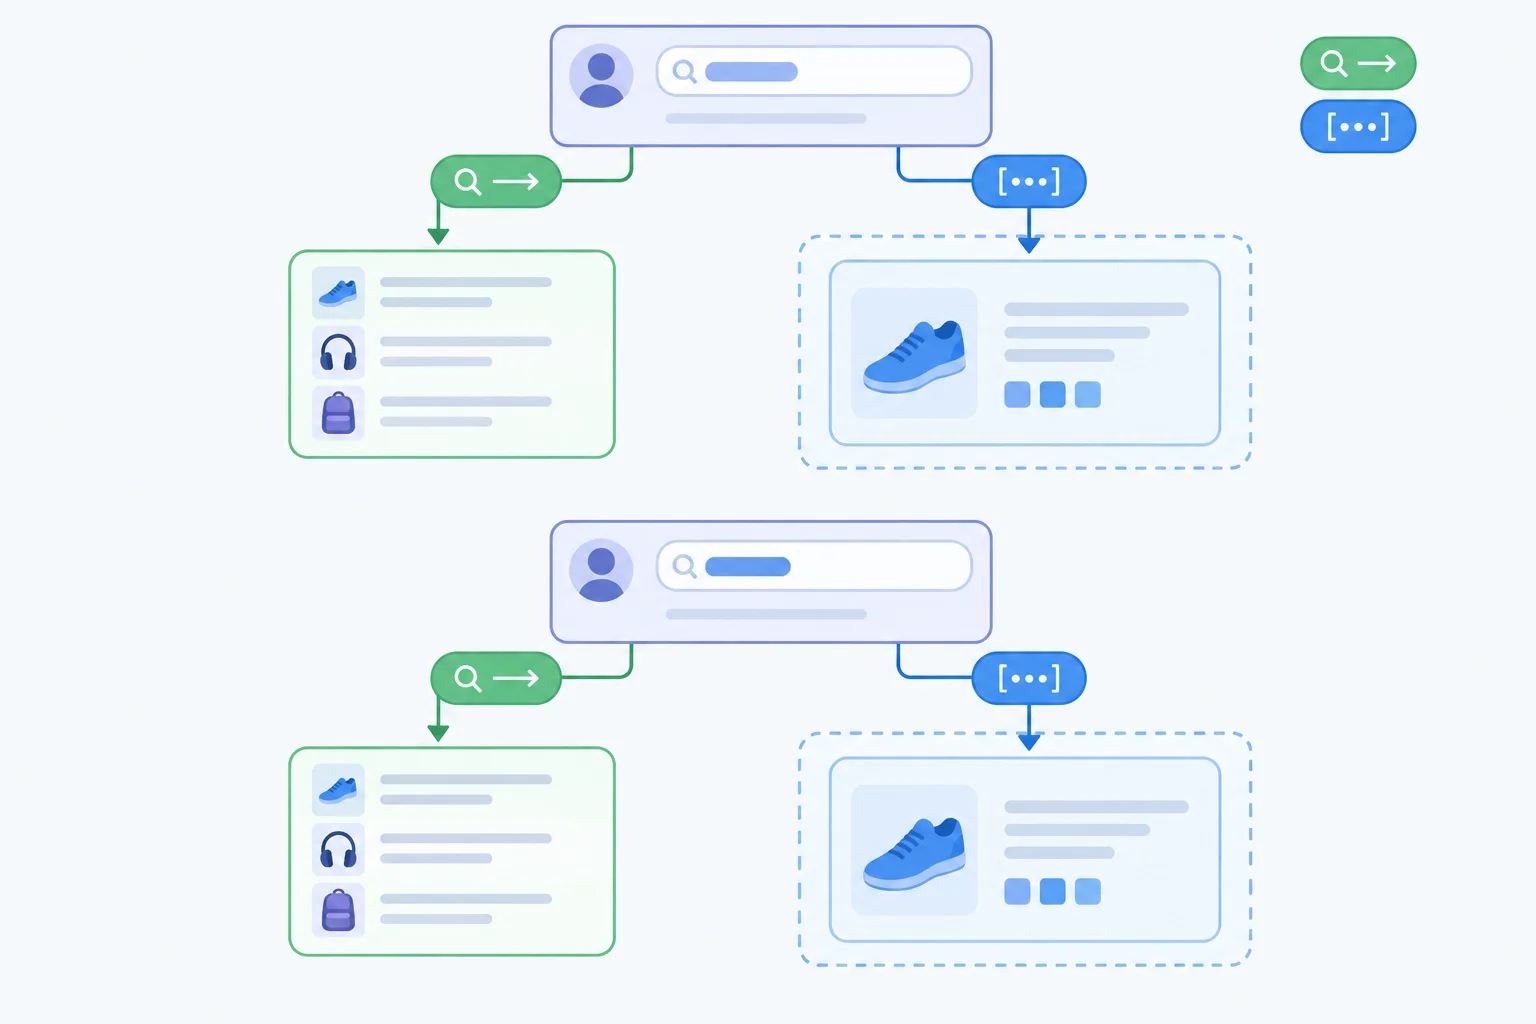
During Filtering, the summary receives the unchanged PRODUCTS reference although its parent updates.
By default, memo compares every prop with Object.is. It does not inspect the contents of an array, object, or function. Equal-looking values are not enough: their identities must compare equal.
A memoized component can still render when its own state changes or when a context value it consumes changes, even if its parent passes equal props. Use relevant Profiler commits and render reasons to check whether the boundary actually avoided useful work.
Each row describes the default comparison during a parent-driven update.
| Prop on two renders | Identity result | Effect on the memo boundary |
|---|---|---|
| `PRODUCTS` reused | Same array reference | Eligible to skip |
| `4` then `4` | Same primitive value | Eligible to skip |
| New `{ category: 'Tools' }` each time | Different object references | Not eligible from that prop |
| New function each time | Different function references | Not eligible from that prop |
Warning
Do not mutate PRODUCTS or one of its product records to preserve identity. A stable reference after mutation can let React skip rendering even though the displayed data should have changed. The source array and its records remain immutable; identity is useful only when it represents correct data.
Make only the following incremental edits in src/App.tsx. Preserve the existing ProductSummary markup, the local NoteEditor state from the previous step, and all of CatalogApp except its one summary element. Do not change the ranking call, list, search, note, or selection behavior.
The wrapper creates a memoized version of the existing component. Its products prop remains the same stable PRODUCTS reference.
src/App.tsx — make these three targeted edits to the existing file
// 1. Replace the existing React import.
import { memo, useState } from 'react';

// 2. Insert this immediately after the existing ProductSummary function.
const MemoizedProductSummary = memo(ProductSummary);

// 3. In the existing CatalogApp return value, replace only this element:
// <ProductSummary products={PRODUCTS} />
<MemoizedProductSummary products={PRODUCTS} />
Tip
Re-record Filtering: reset Search products to empty, warm up outside the recording, reset it again, then record typing tools. Inspect only commits caused by that action.
Check whether ProductSummary is absent from parent-driven render work or has a reduced contribution. The prop comparison also costs work, so leave a cheap summary—or a boundary whose props usually change—unmemoized when repeated recordings do not show meaningful avoided work.
Complete the declaration inserted after the existing ProductSummary function.
const MemoizedProductSummary = ;

// The existing CatalogApp return value uses:
<MemoizedProductSummary products={PRODUCTS} />Match each case to its effect on a React.memo boundary.
Tap an item and then its matching pair.
Step 5 of 8
Use useMemo to cache measured pure ranking work while preserving necessary list updates, the 50-result limit, and complete dependency handling.
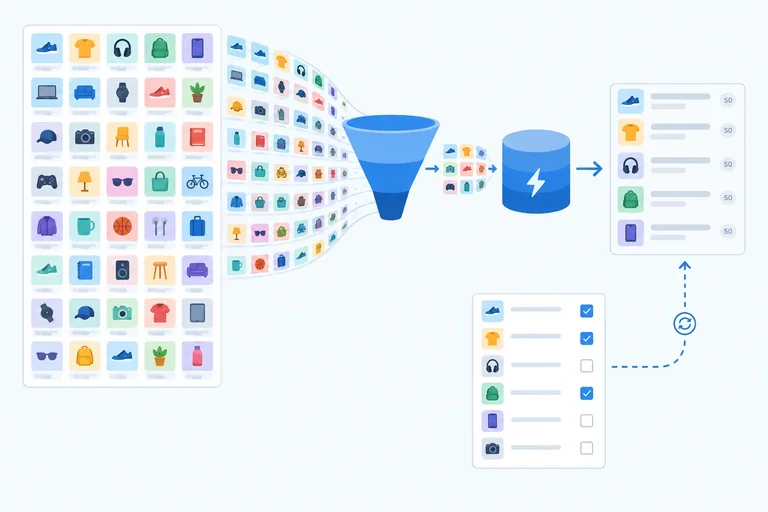
Start with evidence, not the presence of a large list. In the Selection scenario, reset Search products to tools, warm up outside the recording, reset again, then record the two checkbox toggles in React DevTools Profiler.
Inspect the relevant commits and the source. rankProducts(PRODUCTS, query) reads the product collection and query; it does not read selectedIds. Before caching, a CatalogApp render caused by selection can repeat filtering and sorting 5,000 products although the ranking inputs are unchanged.
That makes a narrow hypothesis: reuse the pure, already-limited visible-product calculation during Selection without preventing selection state from updating the list.
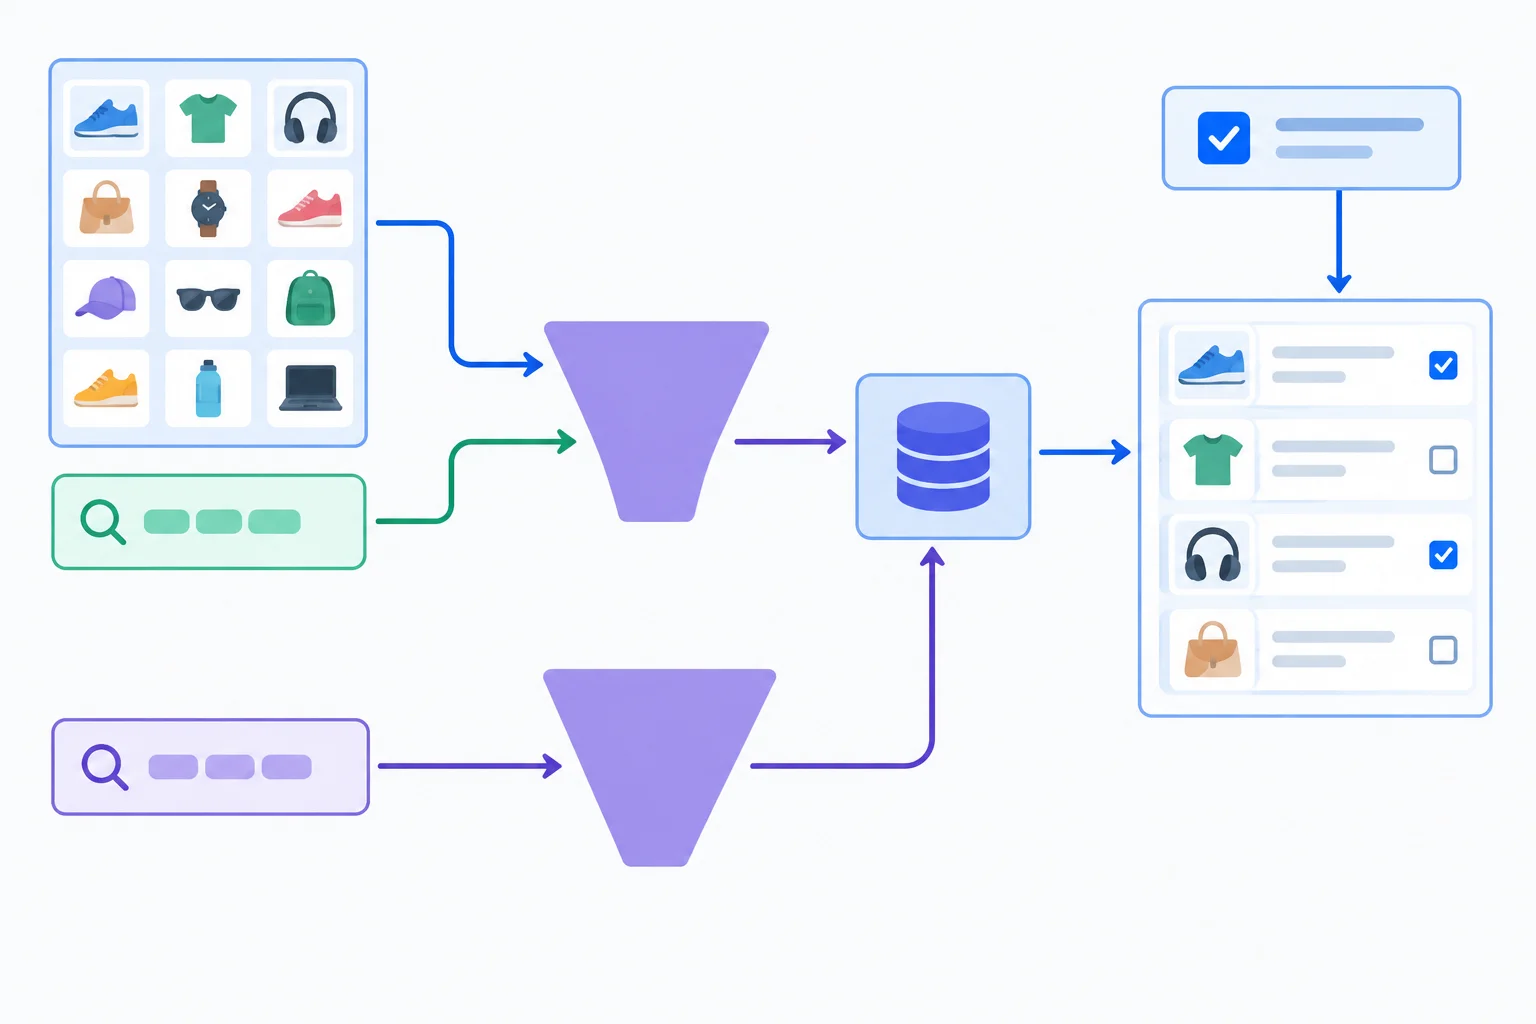
Selection can reuse the visible-product result when ranking inputs are unchanged; a query change requires a new result.
Cache the complete visible-result calculation inside CatalogApp. Add useMemo to the existing named React import, replace the direct ranking expression, and pass visibleProducts to ProductList.
The calculation still ranks all matching products, then non-mutatingly keeps only the first 50. It preserves the existing interface behavior and product object references. Its dependencies are every reactive value read by the calculation: PRODUCTS and query. React compares dependencies with Object.is.
During Selection, CatalogApp can render because selectedIds changed, but unchanged PRODUCTS and query allow React to reuse visibleProducts. During Filtering, query changes, so the cache invalidates and the correct first 50 ranked matches are calculated again.
In src/App.tsx, replace the current React import and the direct rankedProducts calculation. Then replace the existing ProductList prop value with visibleProducts.
import { memo, useMemo, useState } from 'react';

// Inside CatalogApp, replace:
// const rankedProducts = rankProducts(PRODUCTS, query).slice(0, 50);
const visibleProducts = useMemo(
  () => rankProducts(PRODUCTS, query).slice(0, 50),
  [PRODUCTS, query],
);

// In the existing ProductList element, replace only this prop:
<ProductList
  products={visibleProducts}
  selectedIds={selectedIds}
  handleToggle={handleToggle}
/>
Tip
useMemo does not memoize CatalogApp or ProductList. A Selection update still changes selectedIds, so ProductList can render and the toggled checkbox must receive its new selected value. The optimization only avoids rerunning rankProducts(...).slice(0, 50) when its inputs compare equal.
Warning
A memoized calculation must remain correct whenever it runs. Keep rankProducts pure: do not add state updates, Effects, mutations, or correctness-critical side effects to its calculation.
A freshly created array or object used as a dependency compares unequal even if its contents look identical, causing unnecessary invalidation. The opposite mistake is more dangerous: omitting a value that the calculation reads can reuse an obsolete result. React may also discard a memoized value, so the app must be correct if this calculation runs again.
Complete the cache that calculates the same first 50 visible matches as the original expression.
Fill both dependency positions.
const visibleProducts = useMemo(
  () => rankProducts(PRODUCTS, query).slice(0, 50),
  [, ],
);Assume the private note state is already local to NoteEditor. A developer proposes this cache:
const visibleProducts = useMemo(
  () => rankProducts(PRODUCTS, query).slice(0, 50),
  [PRODUCTS],
);
Write exactly three concise bullets:
CatalogApp evaluates this cache and whether the visible-product calculation is reused or invalidated.Write at least 180 characters (0/180).
Step 6 of 8
Stabilize a selection callback only where a measured memoized row boundary can benefit, while preserving correct current-state updates.
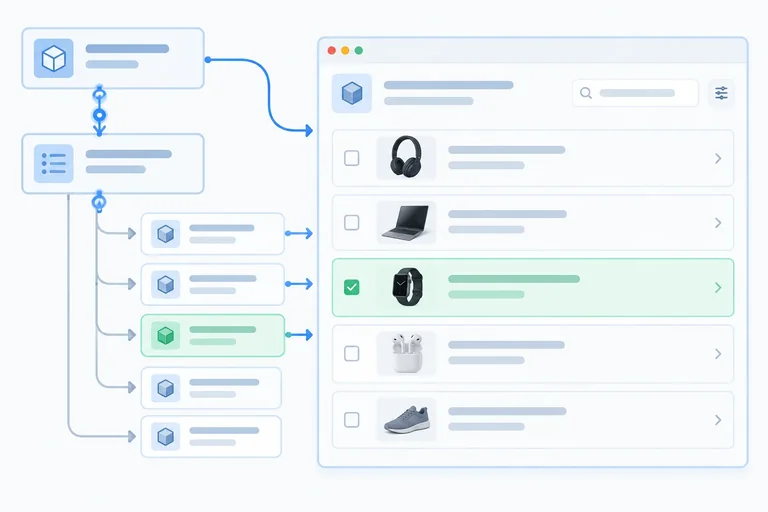
memo(ProductRow) can skip parent-driven rendering only when its relevant props compare equal. A callback declared again during every CatalogApp render is a new function reference, even if it would perform the same selection update.
In the Selection scenario, immutable product objects and an unchanged row’s selected value can remain stable. If onToggle also remains stable, unchanged memoized rows become eligible to skip parent-driven work. The toggled row receives a different selected value and must render so its checkbox stays correct.
This is a measured optimization: use it only if your Selection profile identifies meaningful row work to avoid.
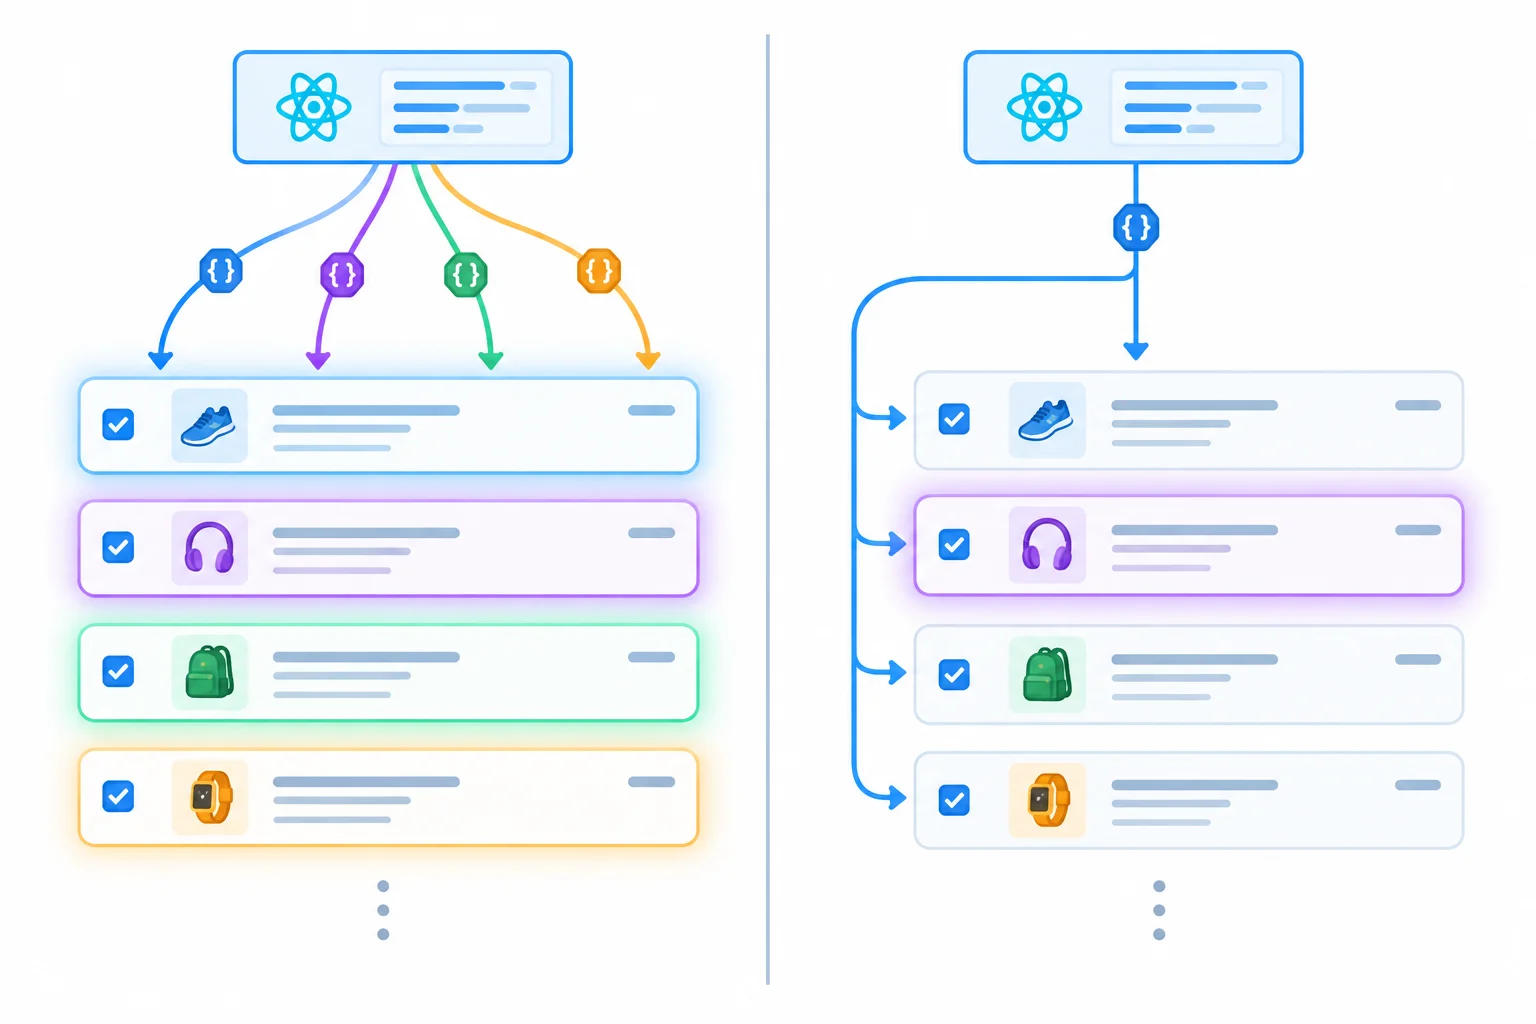
A stable callback removes one prop-identity reason for unchanged memoized rows to render; it does not guarantee a skip.
useCallback reuses a function reference while its dependencies compare equal. It does not cache execution: when a checkbox change calls onToggle, the callback body still runs and updates selection.
Use a functional setSelectedIds update so handleToggle receives the current selection as current; it does not need to capture selectedIds. Therefore this callback can use []. If the callback reads any other reactive value, include that value in its dependency list.
Keep the stable function at the memoized row boundary. Each row may still create its small event handler to supply its own product ID.
In src/App.tsx, make these replacements in the existing file. handleToggle is inside CatalogApp, where its Hook and setSelectedIds are valid. This assumes the visibleProducts calculation from the previous step remains in CatalogApp.
// 1. Replace the existing React import.
import { memo, useCallback, useMemo, useState } from 'react';

// 2. Replace the existing ProductRow function with this declaration.
const ProductRow = memo(function ProductRow({
  product,
  selected,
  onToggle,
}: ProductRowProps) {
  return (
    <li>
      <label>
        <input
          type='checkbox'
          checked={selected}
          aria-label={`Select ${product.name}`}
          onChange={() => onToggle(product.id)}
        />
        {product.name} — {product.category} — score {product.score}
      </label>
    </li>
  );
});

// 3. Replace ProductListProps and ProductList with these versions.
type ProductListProps = {
  products: readonly Product[];
  selectedIds: number[];
  onToggle: (id: number) => void;
};

function ProductList({
  products,
  selectedIds,
  onToggle,
}: ProductListProps) {
  return (
    <ul>
      {products.map((product) => (
        <ProductRow
          key={product.id}
          product={product}
          selected={selectedIds.includes(product.id)}
          onToggle={onToggle}
        />
      ))}
    </ul>
  );
}

// 4. Inside CatalogApp, after visibleProducts and before return, replace
// the existing handleToggle function with this Hook call.
const handleToggle = useCallback((id: number) => {
  setSelectedIds((current) =>
    current.includes(id)
      ? current.filter((selectedId) => selectedId !== id)
      : [...current, id],
  );
}, []);

// 5. In CatalogApp's existing ProductList element, use:
<ProductList
  products={visibleProducts}
  selectedIds={selectedIds}
  onToggle={handleToggle}
/>
Tip
Re-record Selection after this one change: start with Search products set to tools, warm up outside the capture, reset to that state, then toggle the first visible product twice. Check whether unchanged ProductRow instances avoid meaningful render work while the toggled row still participates. The 50-row limit, category and score text, accessible names, and selection behavior must remain unchanged.
Warning
Do not add useCallback by default. A callback passed only to a cheap, non-memoized consumer has no React.memo prop-comparison benefit. Retain memo(ProductRow) and useCallback only when comparable profiles show meaningful avoided work.
An empty dependency list is valid here because the functional updater supplies current selection. It is never a way to conceal another reactive value read by the callback; that would create a stale closure.
Complete the stable callback and its forwarding through the list.
const handleToggle = ((id: number) => {
  setSelectedIds((current) =>
    current.includes(id)
      ? current.filter((selectedId) => selectedId !== id)
      : [...current, id],
  );
}, );

function ProductList({ products, selectedIds, onToggle }: ProductListProps) {
  return (
    <ul>
      {products.map((product) => (
        <ProductRow
          key={product.id}
          product={product}
          selected={selectedIds.includes(product.id)}
          onToggle={}
        />
      ))}
    </ul>
  );
}

<ProductList
  products={visibleProducts}
  selectedIds={selectedIds}
  onToggle={}
/>Review this proposed change for the memoized ProductRow boundary:
const handleToggle = useCallback((id: number) => {
  setSelectedIds(
    selectedIds.includes(id)
      ? selectedIds.filter((selectedId) => selectedId !== id)
      : [...selectedIds, id],
  );
}, []);

<ProductList onToggle={(id) => handleToggle(id)} />
Write a short review with four parts:
handleToggle and the ProductList prop line with correct code.useCallback does not cache function execution.useCallback for a callback passed only to a cheap, non-memoized consumer, and justify the decision from measured work.Write at least 260 characters (0/260).

Step 7 of 8
Verify React rendering optimizations with comparable development profiles, a separate optimized-build browser check, and focused behavior tests.
Treat an optimization as a controlled experiment, not a one-off fast recording. Change one hypothesis at a time. For every relevant scenario, record at least three runs before and three runs after the change.
Keep the data, scenario starting state, browser and extension versions, build mode, React DevTools settings, viewport, CPU throttling, and Strict Mode status identical. Reset before every recording; setup and warm-up actions remain outside the recording.
In React DevTools Profiler, compare the commits caused by the interaction, the participating components, and one consistently defined render-duration summary. For example, calculate the median relevant-commit render duration for each run, then report the range across the three run medians.
A render duration measures React render work in a commit. It is not whole-interaction latency, browser paint time, or INP.
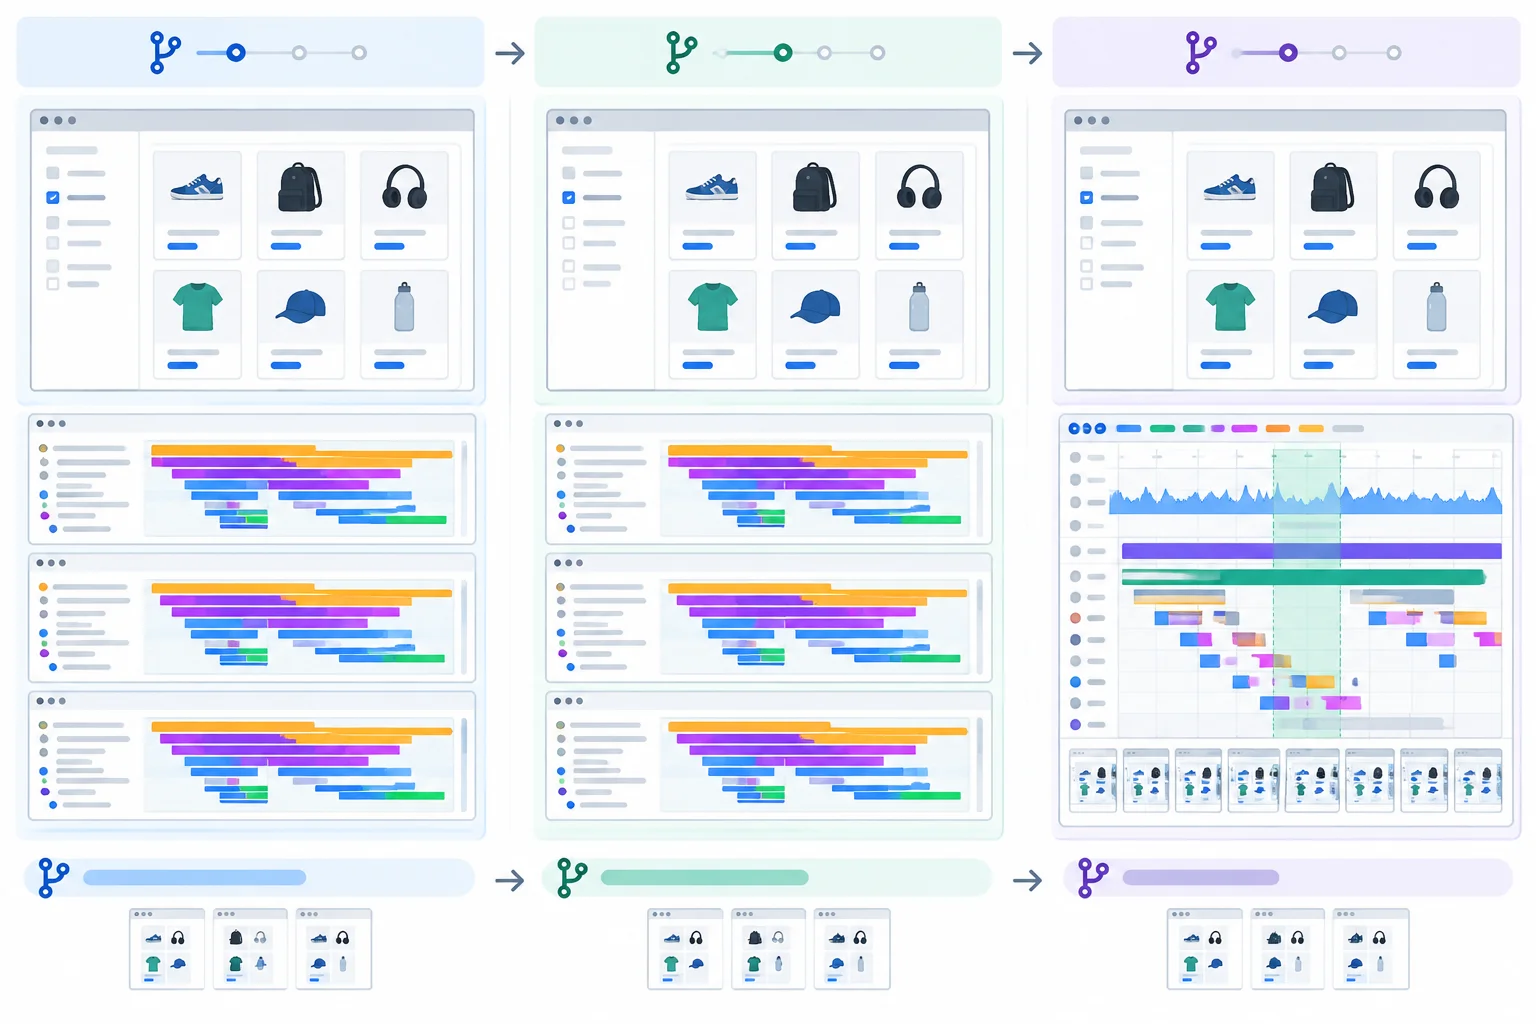
Keep development Profiler evidence separate from the optimized-build browser check.
Illustrative. Each row is a separate, one-change development-profile comparison. Every value uses the same summary: median relevant-commit render duration, with the range across three run medians. These are React render-duration summaries, not whole-interaction timings.
| Scenario | Build mode | Before | After | Decision |
|---|---|---|---|---|
| Note editing | Development Profiler, Strict Mode | 8.4 ms (8.0–9.2) | 2.9 ms (2.6–3.3) | Keep state locality |
| Filtering | Development Profiler, Strict Mode | 15.1 ms (14.5–15.8) | 15.0 ms (14.3–15.9) | Investigate; no measured gain |
| Selection | Development Profiler, Strict Mode | 13.8 ms (13.0–14.4) | 5.2 ms (4.9–5.6) | Keep if behavior passes |
Development profiling and an optimized-build interaction check answer different questions. Keep React DevTools Profiler comparisons development-to-development, with the same Strict Mode setting and profiling overhead. Strict Mode can repeat development checks, and profiling itself adds overhead.
After the comparable profile runs, build locally and inspect the same fixed scenario separately with the browser Performance panel. Record the user action, then inspect its event work, main-thread activity, and presentation-related activity. This can support a local interaction observation, but it does not establish an INP claim.
Use the same data, starting state, viewport, and throttling. A normal optimized build does not provide the same Profiler instrumentation by default, so never compare a development Profiler render duration directly with a browser timing from preview.
Warning
Do not conclude that “render duration fell from 8.4 ms to a 5.1 ms production interaction.” Those numbers come from different tools, modes, and scopes. Report the development render-duration comparison and the optimized-build browser observation as separate results.
Build the local optimized bundle, then serve it locally. Open the Local address printed by preview and record the same fixed scenario in the browser Performance panel.
npm run build
npm run preview> product-explorer@0.0.0 build > tsc -b && vite build vite v6.0.0 building for production... ✓ built in 1.02s > product-explorer@0.0.0 preview > vite preview ➜ Local: http://localhost:4173/ ➜ press h + enter to show help
Exact Vite versions, asset names, build duration, and preview address vary. Keep the preview server running while you make the separate browser recording.
Behavior checks protect the user task while you evaluate cost. The supplied tests verify query-dependent catalog results, selection and deselection, note independence, keyboard checkbox operation, the required accessible checkbox names, focus continuity, and visible selection state.
They deliberately do not assert render counts or timing thresholds. Those are implementation details that vary by machine and mode. The files below run against the cumulative Product Explorer fixture after the state-locality and memoization changes from the preceding steps.
Create these two files. They configure Vitest with jsdom and load the Testing Library matchers used by the focused suite.
// vitest.config.ts
import { defineConfig } from 'vitest/config';

export default defineConfig({
  test: {
    environment: 'jsdom',
    setupFiles: ['./src/setupTests.ts'],
  },
});

// src/setupTests.ts
import '@testing-library/jest-dom/vitest';
import { cleanup } from '@testing-library/react';
import { afterEach } from 'vitest';

afterEach(cleanup);Create src/App.test.tsx. The deterministic ranking places Product 1027 — Books — score 999 among the first 50 Books results, while Product 0027 — Tools — score 999 is excluded by that query.
import { render, screen } from '@testing-library/react';
import userEvent from '@testing-library/user-event';
import { describe, expect, it } from 'vitest';
import CatalogApp from './App';

describe('CatalogApp behavior', () => {
  it('shows query-dependent catalog results', async () => {
    const user = userEvent.setup();
    render(<CatalogApp />);
    const search = screen.getByLabelText('Search products');

    expect(
      screen.getByText('Product 0027 — Tools — score 999'),
    ).toBeInTheDocument();

    await user.type(search, 'books');

    expect(search).toHaveValue('books');
    expect(screen.getAllByRole('checkbox')).toHaveLength(50);
    expect(
      screen.getByText('Product 1027 — Books — score 999'),
    ).toBeInTheDocument();
    expect(
      screen.queryByText('Product 0027 — Tools — score 999'),
    ).not.toBeInTheDocument();

    await user.clear(search);

    expect(
      screen.getByText('Product 0027 — Tools — score 999'),
    ).toBeInTheDocument();
  });

  it('selects and deselects with the keyboard', async () => {
    const user = userEvent.setup();
    render(<CatalogApp />);
    const checkbox = screen.getByRole('checkbox', {
      name: 'Select Product 0027',
    });

    checkbox.focus();
    await user.keyboard('{Space}');

    expect(checkbox).toHaveFocus();
    expect(checkbox).toBeChecked();
    expect(screen.getByText('Selected products: 1')).toBeInTheDocument();

    await user.keyboard('{Space}');

    expect(checkbox).toHaveFocus();
    expect(checkbox).not.toBeChecked();
    expect(screen.getByText('Selected products: 0')).toBeInTheDocument();
  });

  it('preserves filtering and selection while a private note changes', async () => {
    const user = userEvent.setup();
    render(<CatalogApp />);

    const search = screen.getByLabelText('Search products');
    await user.type(search, 'books');
    const checkbox = screen.getByRole('checkbox', {
      name: 'Select Product 1027',
    });
    await user.click(checkbox);

    const note = screen.getByLabelText('Private note');
    await user.type(note, 'review');

    expect(note).toHaveFocus();
    expect(note).toHaveValue('review');
    expect(search).toHaveValue('books');
    expect(checkbox).toBeChecked();
    expect(screen.getByText('Selected products: 1')).toBeInTheDocument();
    expect(
      screen.getByText('Product 1027 — Books — score 999'),
    ).toBeInTheDocument();
  });
});Install the local test dependencies if they are not already present, then run the focused suite once. Investigate a failing behavior check before keeping an optimization.
npm install -D vitest jsdom @testing-library/react @testing-library/user-event @testing-library/jest-dom
npm exec vitest run RUN v3.0.0 /your-local-product-explorer
✓ src/App.test.tsx (3 tests) 184ms
Test Files 1 passed (1)
Tests 3 passed (3)
Start at 10:24:16
Duration 1.12sPackage-manager progress and Vitest durations vary. The important result is that all three tests pass.
A teammate changed only note-state placement and claims the interaction improved by comparing a React DevTools development Profiler render duration of 8.4 ms with a browser Performance panel timing of 5.1 ms from local preview.
After running the supplied behavior checks locally, write a concise verification record. Reject or accept that numeric comparison and explain why. Then provide a valid verification sequence for the change: comparable development-profile runs, a separate optimized-build browser check, and the targeted behavior checks. Report your actual local test outcome and measurements or explicitly state what you did not measure.
Finish with keep, revert, or investigate. Distinguish render duration from whole-interaction timing, and do not call either local measurement INP.
Write at least 300 characters (0/300).

Step 8 of 8
Turn React profiling evidence into a small, testable optimization decision and document how you would verify it without changing behavior.
A profiling decision is defensible when every link is explicit:
Do not optimize because a component rendered. Optimize when the measured work, its cause, and a safe intervention form one testable claim.
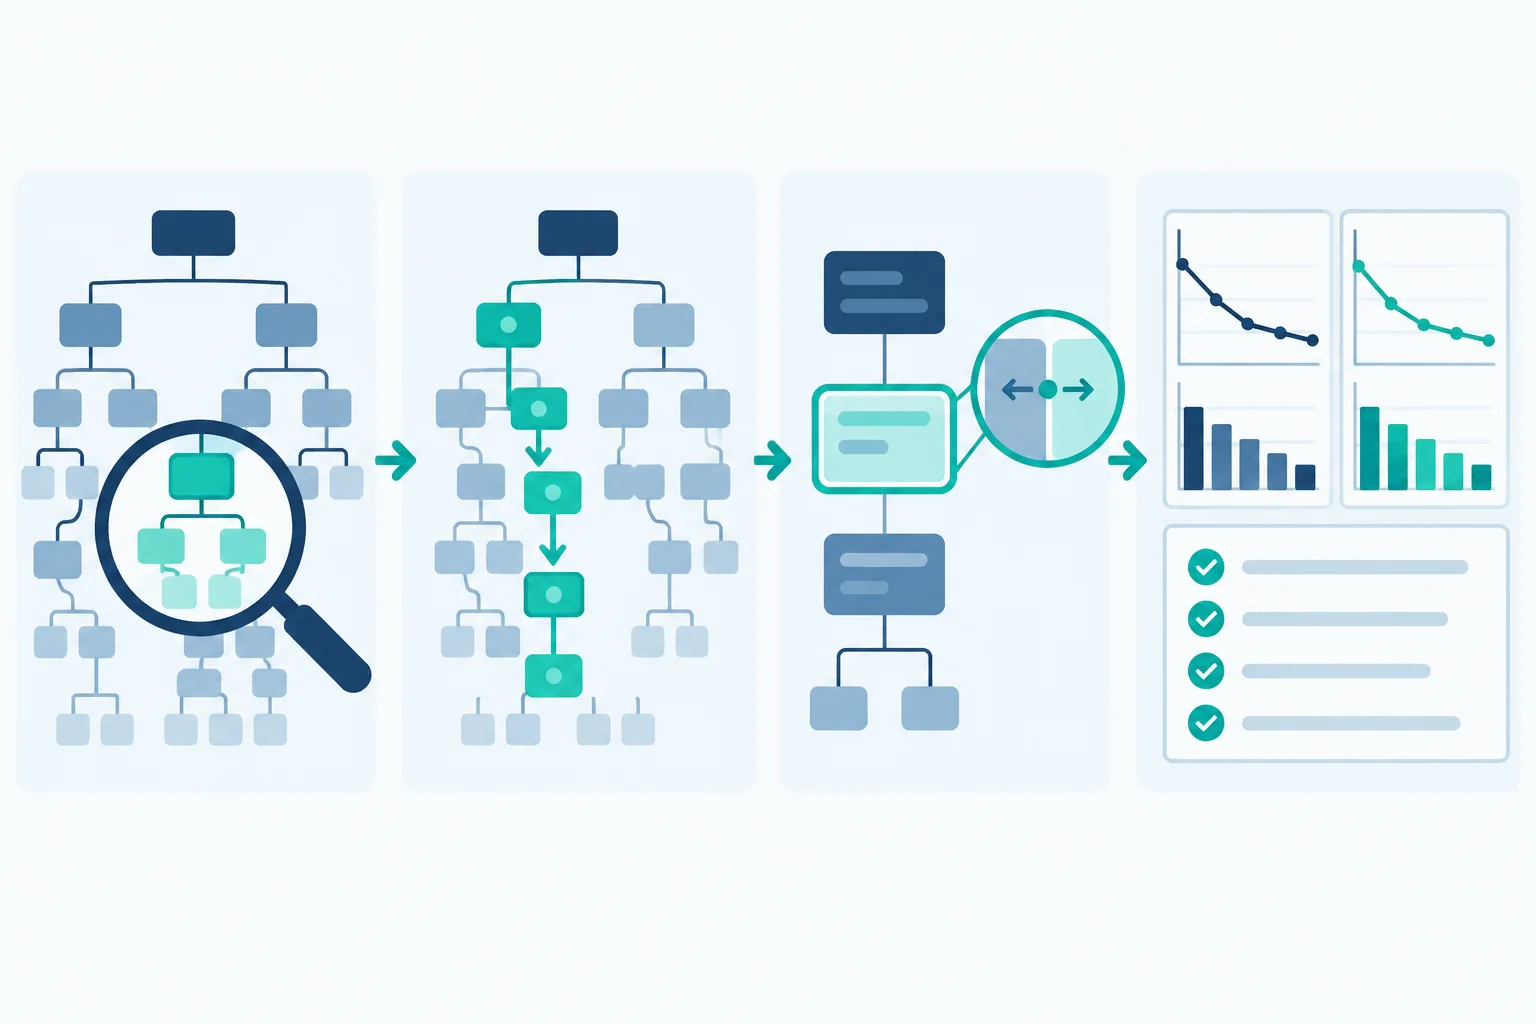
Use this order: evidence, cause, smallest intervention, then verification.
Tip
A React DevTools Profiler render duration measures component render work in recorded commits. It is not a whole-interaction browser timing and it is not INP. Keep development-profile comparisons like-for-like; use a separate optimized-build check in the browser Performance panel for the user interaction.
Consider this compact Product Explorer case. In the Note editing scenario, the learner resets the note to empty, warms up the app, then records typing review. The Profiler shows a state update in CatalogApp; NoteEditor, ProductSummary, ProductList, and 50 visible ProductRow components participate because their parent rendered.
The note is private: no sibling reads it. The products reference, query, selection, and summary inputs are unchanged. Render reasons support the update path; color alone would not be enough evidence.
The following supplied measurements are Illustrative development Profiler summaries. They compare the same scenario, data, starting state, tool settings, and Strict Mode status. They do not represent optimized-build browser timing.
| Scenario | Build mode | Before | After | Decision |
|---|---|---|---|---|
| Note editing | Development Profiler, Strict Mode on | Illustrative: 9.8 ms median render duration; app, editor, summary, list, and 50 rows participate | Illustrative: 1.4 ms median render duration; only the editor branch participates | Keep if behavior checks also pass |
| Filtering | Development Profiler, Strict Mode on | Illustrative: 11.2 ms median render duration | Not measured for this change | Do not claim an improvement |
| Selection | Development Profiler, Strict Mode on | Illustrative: 10.7 ms median render duration | Not measured for this change | Do not claim an improvement |
Warning
The behavior evidence must match the change. For this case, verify that typing still displays and preserves the private note, filtering still returns query-dependent results, and selecting then deselecting a product still updates the visible selection. A lower duration without preserved behavior is not a successful optimization.
A concise evidence report contains six parts:
Name what was measured. If an optimized-build interaction check or an after recording is missing, say so; do not fill the gap with an invented number.
Match each observation to the smallest justified response.
Tap an item and then its matching pair.
Create a concise local evidence report for this supplied decision.
You recorded Note editing with an empty note and otherwise unchanged Product Explorer state. The development Profiler shows CatalogApp updating because of note state, followed by participation from NoteEditor, ProductSummary, ProductList, and 50 visible rows. The note has no consumer outside NoteEditor. A first behavior check confirms that typing displays the note.
Select the smallest first intervention. In your report, explain why at least two alternatives are unnecessary or unsafe from this evidence. State the scenario, hypothesis, intervention, prediction, comparable measurement plan or results, behavior checks, and a Keep, Revert, or Investigate decision. If you have not completed the after-profile and separate optimized-build interaction check locally, legitimately conclude Investigate rather than inventing results.
Write at least 400 characters (0/400).
Congratulations! You completed: Reduce React Rendering Costs with Profiling
Thousands of online courses in video, ebooks and audiobooks.
To test your knowledge during online courses
Generated directly from your cell phone's photo gallery and sent to your email

Download our app via QR Code or the links below:.



Carry knowledge in your pocket.
Download the Cursa app.
There are hundreds of free courses available, with a free certificate of completion that is saved in your mobile image gallery.
Download the app to access the Course Completion Certificate for Free.


+ 10 million
students

Free and Valid
Certificate

60 thousand free
exercises

4.8/5 rating in
app stores

Free courses in
video and ebooks