
Step 1 of 8
Read the Report Before Calculating
Identify what each Starter Kit campaign report count measures and establish its reporting window before interpreting performance.

Learning path · Level 8 · Tutorial 4
Interpret text-based email and automation reports, calculate meaningful rates, and recommend a focused improvement. Account for unreliable opens, automated clicks, delivery failures, and incomplete workflow observation before judging results.

 Read the Report Before Calculating
Identify what each Starter Kit campaign report count measures and establish its reporting window before interpreting performance. 2 min
 Calculate Click, Bounce, and Unsubscribe Rates
Calculate the Starter Kit campaign’s click, bounce, and unsubscribe rates while preserving the denominator and reporting window behind each percentage. 3 min
 Choose a Meaningful Conversion Rate
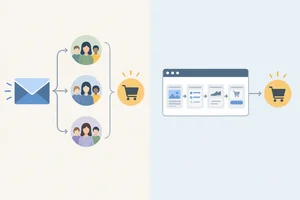
Calculate recipient-based and session-based conversion rates for Northstar Stationery’s Starter Kit campaign while preserving the correct unit, denominator, attribution context, and reporting window. 2 min
 Treat Opens and Clicks as Imperfect Signals
Interpret Reported opens and Reported clicks cautiously, then select corroborating evidence without claiming certainty about deliberate human engagement. 2 min
 Turn Delivery Failures and Opt-Outs into Actions
Use bounce and unsubscribe evidence to select proportionate list-health and eligibility actions without bypassing suppression or overstating causes. 2 min
 Compare Workflow Cohorts at the Same Stage
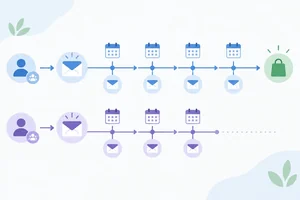
Assess Welcome workflow cohorts by entry timing and complete observation windows before judging performance. 3 min
 Choose One Evidence-Linked Improvement
Use connected evidence to select one proportionate improvement or test while protecting conversion measurement and list health. 2 min
 Complete an Evidence-Based Campaign Review
Synthesize campaign and workflow evidence into a concise review with one cautious, measurable next action. 3 min
Step 1 of 8
Identify what each Starter Kit campaign report count measures and establish its reporting window before interpreting performance.
Before interpreting Northstar Stationery’s Starter Kit campaign, establish what was counted and when.
Reporting window: First 7 complete days after sending
This is a one-time email: each recipient receives at most one message. The report uses both message counts and recipient counts, so equal-looking numbers must not be treated as the same kind of evidence.
Read the labels before making any judgment. A count alone does not tell you whether delivery, engagement, or purchasing performance was good.
Starter Kit campaign report for the First 7 complete days after sending.
| Report field | Count | What it counts |
|---|---|---|
| Attempted sends | 2,000 | Messages the provider tried to send |
| Delivered messages | 1,900 | Messages accepted by the receiving provider |
| Bounces | 100 | Messages not delivered in this snapshot |
| Unique clicking recipients | 152 | Recipients recorded clicking at least once |
| Attributed purchasing recipients | 38 | Delivered recipients with a qualifying purchase |
| Unsubscribes | 19 | Unique recipients who unsubscribed |
The first split is delivery status. In this simplified report, the 2,000 attempted sends resolve into either a delivered message or a bounce: 1,900 + 100 = 2,000.
That reconciliation is useful here because the snapshot explicitly assigns every attempted send one delivery outcome. In a live provider report, first check the provider’s definitions, statuses, and reporting timing before expecting totals to reconcile this way.
A delivered message means the receiving provider accepted it. It does not prove that a person saw or read it.
This diagram represents the simplified delivery outcome split, not proof of human attention.
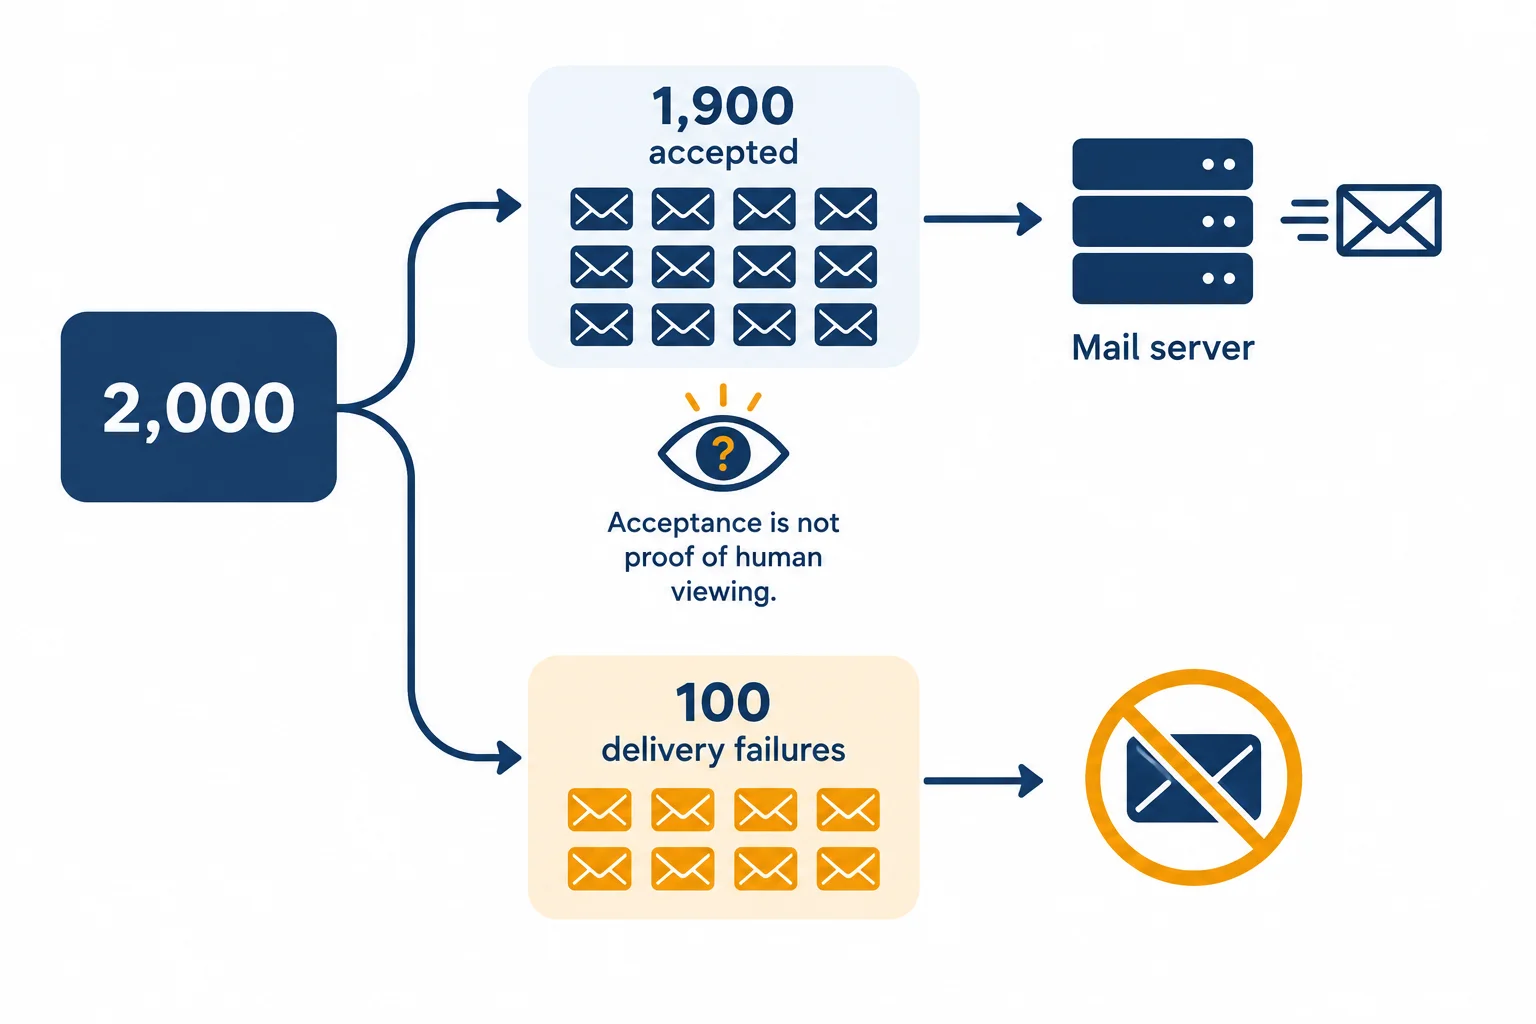
Provider acceptance is a delivery signal, not evidence that a person saw the email.
The remaining fields use different counting units:
A label such as “total clicks” would need another definition: does it include repeated clicks by the same recipient? Always establish whether activity is unique or total before comparing reports.
The separate website report contains:
These are session counts, not recipient counts. The number 38 happens to appear in both reports, but that does not make a purchasing recipient interchangeable with a session containing a purchase.
Keep the unit beside any observation you summarize. Also keep the reporting window beside it; otherwise two counts may cover different periods.
Tip
Before comparing two report values, ask: “Do they use the same unit, definition, and reporting window?” A matching number is not enough.
Match each report item or comparison claim to its counting unit or missing requirement.
Tap an item and then its matching pair.

Step 2 of 8
Calculate the Starter Kit campaign’s click, bounce, and unsubscribe rates while preserving the denominator and reporting window behind each percentage.
Use the report definition before you calculate. Every rate follows the same structure:
Rate = numerator / denominator × 100%
For Northstar Stationery’s Starter Kit campaign, each recipient can receive at most one message. Therefore, Unique clicking recipients and Unsubscribes are compared with Delivered messages. Bounces are compared with Attempted sends, because a bounce is a delivery outcome of an attempted send.
Keep the reporting window with every result: First 7 complete days after sending. A rate describes observed activity under this definition; it does not, by itself, judge whether the campaign succeeded.
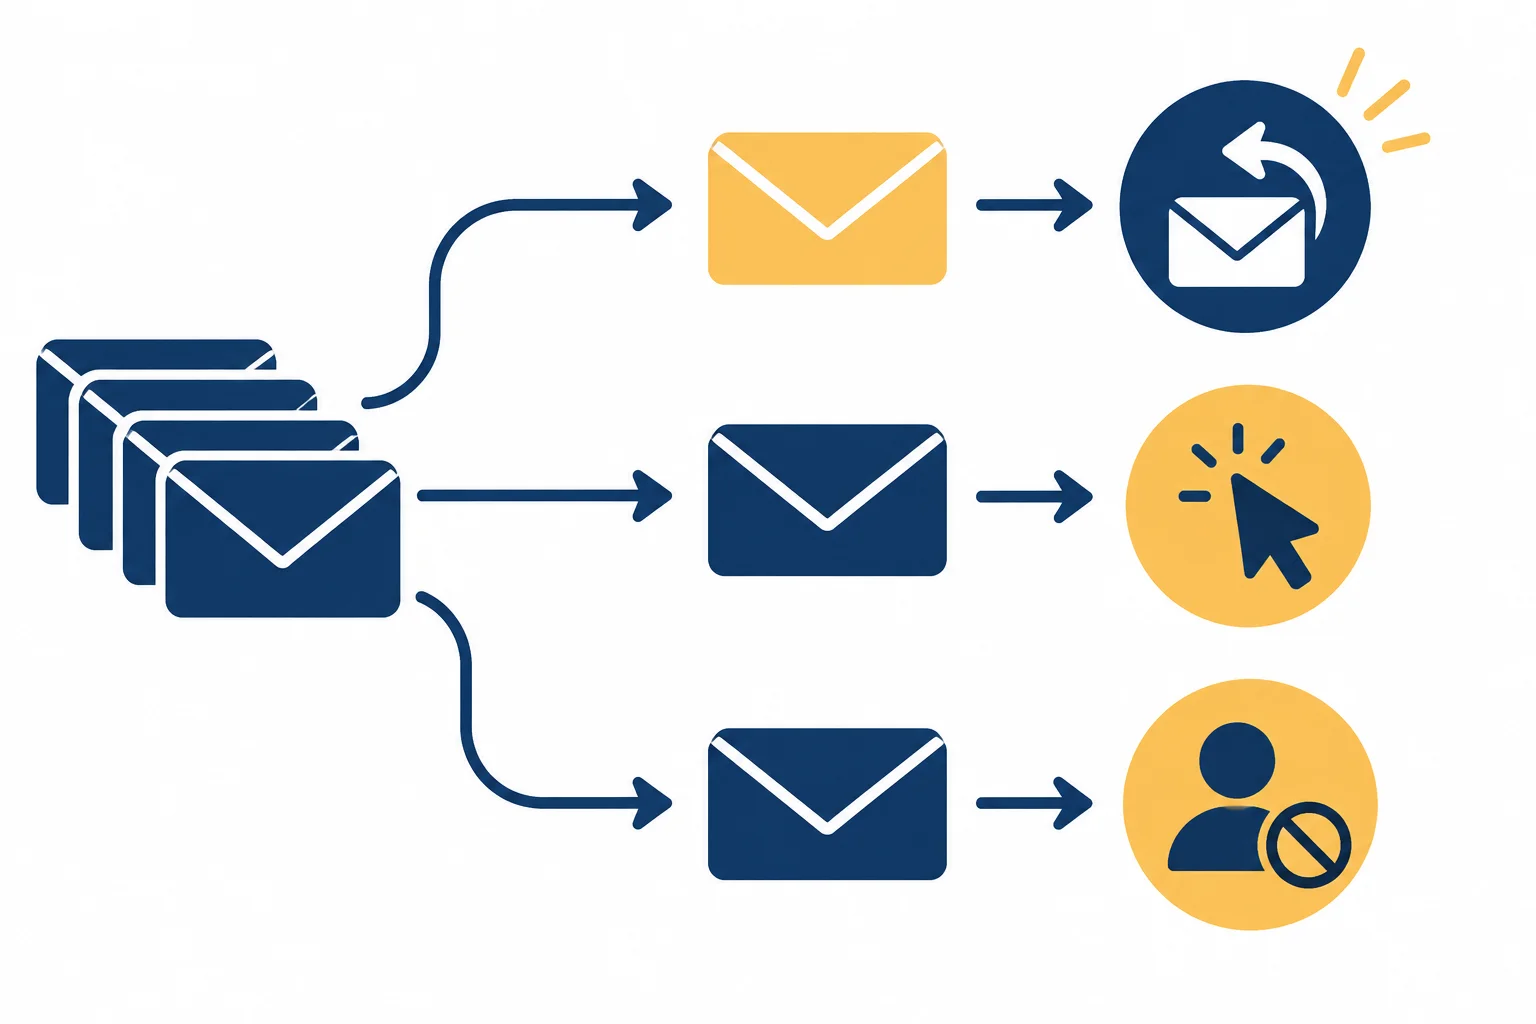
Bounces use Attempted sends as their denominator. Unique clicks and Unsubscribes use Delivered messages in this one-message-per-recipient campaign.
The denominator answers “out of which population?” Write its label beside the percentage so that another reader can interpret the rate without guessing.
All calculations use the Starter Kit campaign window: First 7 complete days after sending.
| Rate | Numerator | Denominator | Calculation | Result |
|---|---|---|---|---|
| Unique click rate | 152 Unique clicking recipients | 1,900 Delivered messages | Rate = 152 / 1,900 × 100% | 8.00% |
| Bounce rate | 100 Bounces | 2,000 Attempted sends | Rate = 100 / 2,000 × 100% | 5.00% |
| Unsubscribe rate | 19 Unsubscribes | 1,900 Delivered messages | Rate = 19 / 1,900 × 100% | 1.00% |
A provider dashboard displays a metric named “click rate.” Which underlying calculation matches the Starter Kit campaign definition?
Complete this campaign reporting template. Enter each denominator label and calculated percentage using two decimal places.
Reporting window: First 7 complete days after sending

Input counts
Unique clicking recipients: 152
Bounces: 100
Unsubscribes: 19
Delivered messages: 1,900
Attempted sends: 2,000

Unique click rate — denominator: ; Rate = 152 / 1,900 × 100% =
Bounce rate — denominator: ; Rate = 100 / 2,000 × 100% =
Unsubscribe rate — denominator: ; Rate = 19 / 1,900 × 100% = 
Step 3 of 8
Calculate recipient-based and session-based conversion rates for Northstar Stationery’s Starter Kit campaign while preserving the correct unit, denominator, attribution context, and reporting window.
Northstar Stationery’s Starter Kit campaign uses two reports for the same window: First 7 complete days after sending.
The email report contains 1,900 Delivered messages—a message count—and 38 Attributed purchasing recipients—a recipient count. In this one-message-per-recipient campaign, each recipient received at most one message. That design makes Delivered messages the prescribed denominator for the recipient-based email conversion rate, but it does not change Delivered messages into a recipient count.
The separate website report contains 190 Campaign-attributed sessions and 38 Sessions with a purchase. Both are session counts. A matching number, such as 38, does not make recipients and sessions interchangeable.
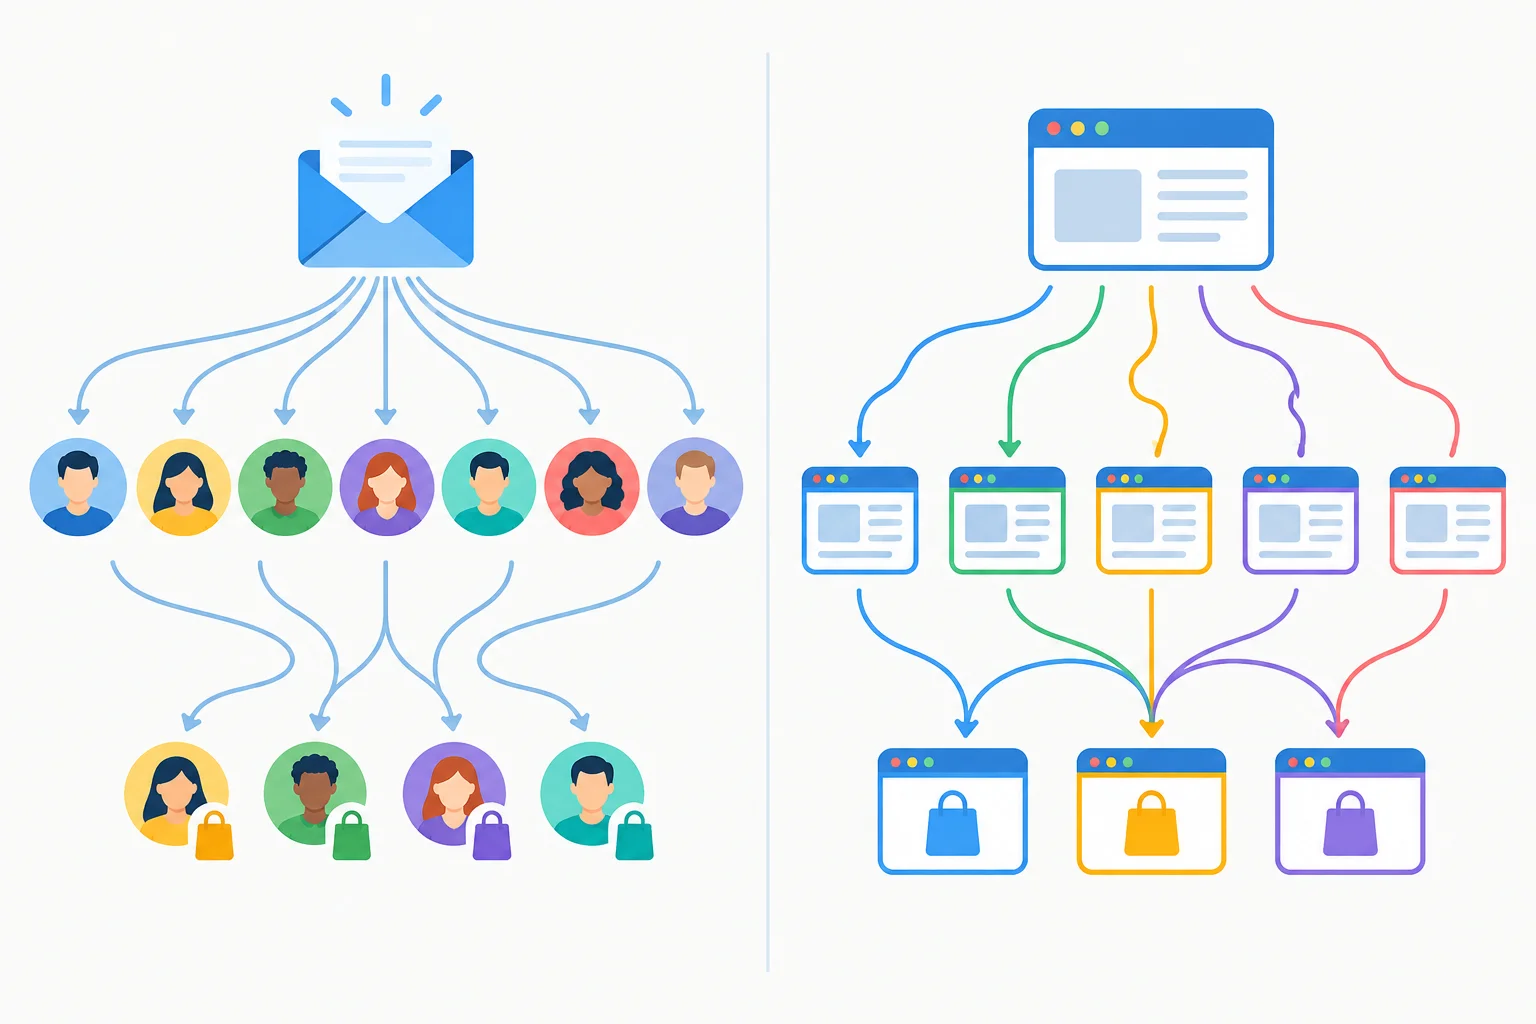
The campaign window can be the same while the reports count different units.
The numerator and denominator define the question.
For the email report, a purchasing recipient is counted once when that delivered recipient has at least one purchase following a tracked campaign click within the reporting window. The numerator is therefore a recipient count. The denominator remains Delivered messages, a message count, because this one-time campaign sends at most one message to each recipient.
For the website report, both the numerator and denominator are session counts. A purchasing recipient is not necessarily a conversion event: one person could create more than one purchase event in a different report design. Confirm whether each report counts recipients, sessions, or events before comparing results.
Both calculations use the Starter Kit campaign reporting window: First 7 complete days after sending.
| Report | Calculation | Question answered |
|---|---|---|
| Email recipient report | Rate = 38 / 1,900 × 100% = 2.00% | What share of Delivered messages corresponds to a unique attributed purchasing recipient in this one-message-per-recipient campaign? |
| Website session report | Rate = 38 / 190 × 100% = 20.00% | What share of Campaign-attributed sessions included a purchase? |
Example
Do not substitute the 20.00% session-based rate for the 2.00% recipient-based email rate. The denominators answer different questions.
Attribution rules determine which purchases appear in each report. Consent limitations, cross-device journeys, attribution differences, and reporting delays can make email and website totals differ. Even when a report attributes a purchase to the campaign, that observed attribution is not proof that the campaign created an incremental purchase.
Complete the denominator label and percentage for each report. Use two decimal places for the calculated rates.
Reporting window: First 7 complete days after sending

Email report
Attributed purchasing recipients: 38
Delivered messages: 1,900
Recipient-based email conversion rate — denominator:
Rate = 38 / 1,900 × 100% =

Website report
Sessions with a purchase: 38
Campaign-attributed sessions: 190
Session-based conversion rate — denominator:
Rate = 38 / 190 × 100% = Write a concise review note for the Starter Kit campaign.
Include both conversion-rate calculations with their denominator labels and reporting window. State the question each rate answers. Then reject the claim that the website session rate can replace the email rate, and explain why a website rate measured over 14 days cannot be directly compared with these 7-day results.
Write at least 260 characters (0/260).

Step 4 of 8
Interpret Reported opens and Reported clicks cautiously, then select corroborating evidence without claiming certainty about deliberate human engagement.
An email platform usually records an open when a tracking image is requested. That request can happen without deliberate reading: privacy protections may preload or proxy images, and automated systems may request them.
The signal can also miss real reading. If images are blocked or tracking is otherwise limited, a person may read the email without producing a recorded open.
Treat Reported opens as an imperfect observation in both directions—not a count of people who definitely read the message.
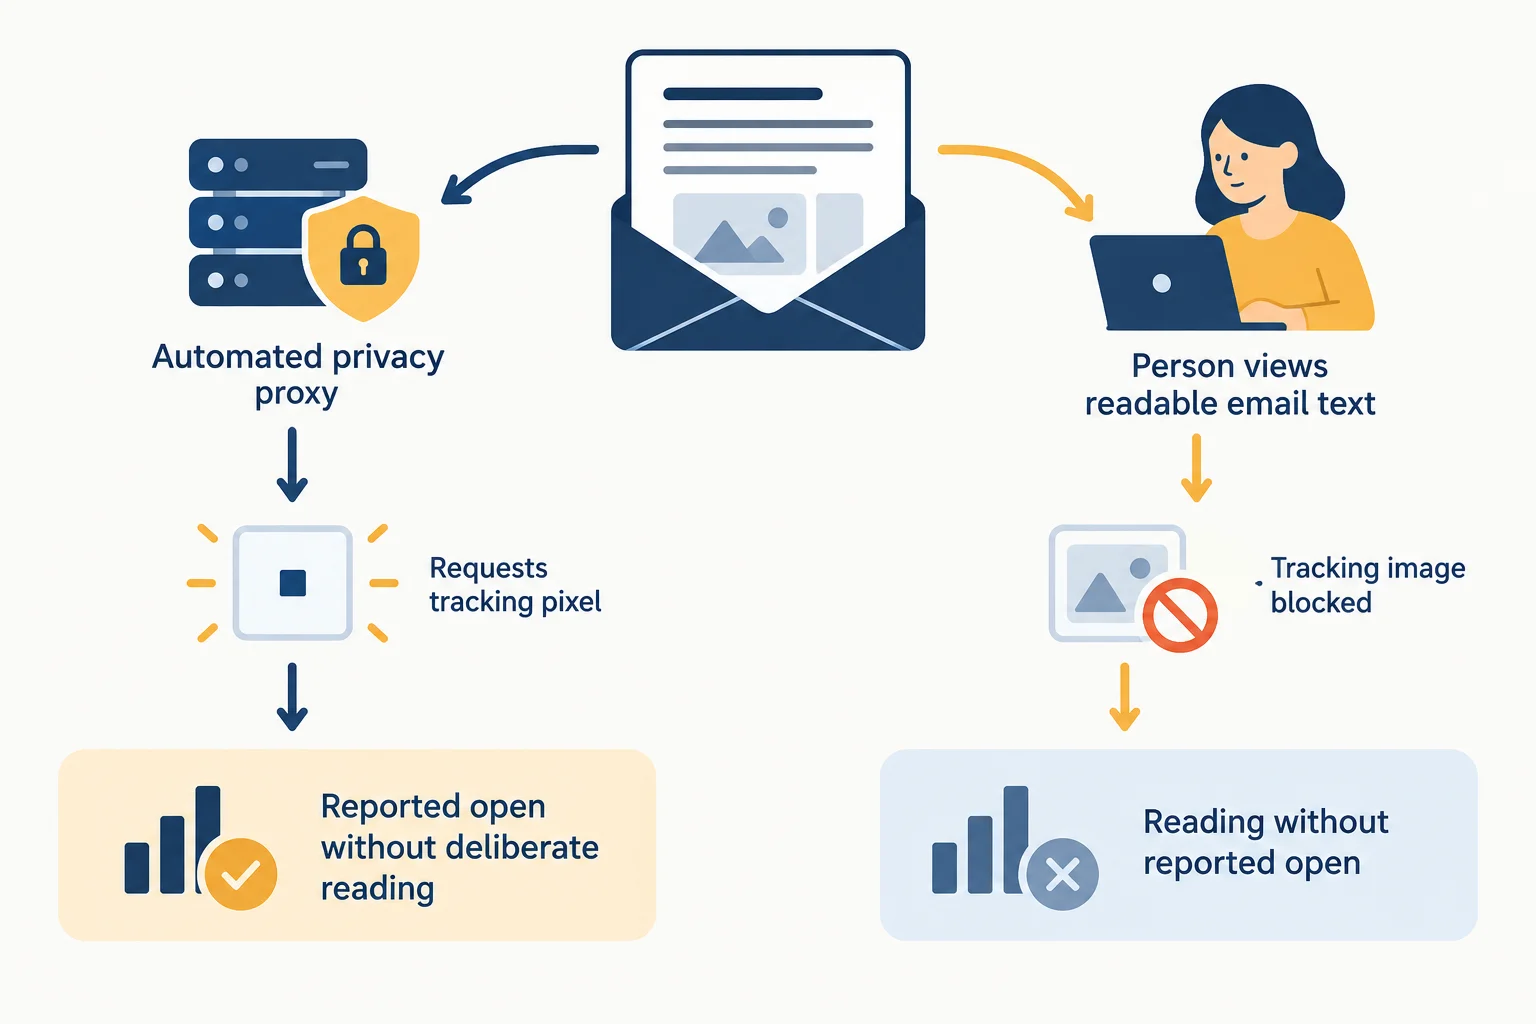
Both false positives and missed reads make Reported opens an incomplete engagement signal.
Warning
Do not use Reported opens as the only success measure or as the only condition for an automation branch. A contact who did not generate an open may still have read the message; a reported open may not reflect a person’s attention.
Security scanners and other automated systems can activate tracked links to inspect them. An unusually fast burst of activity or activation across many links is a reason to investigate, not proof that automation occurred.
For the Starter Kit campaign, the provider reports 152 Unique clicking recipients during the First 7 complete days after sending. This is a recipient count: each recipient is counted once, even if they activate more than one link. It is still a Reported clicks signal and does not prove deliberate interest.
Look for corroborating evidence while keeping each report’s unit and reporting window visible.
Use multiple signals to investigate Reported clicks from the Starter Kit campaign. Each signal adds context, but none establishes certainty by itself.
| Signal | What it can corroborate | What it cannot prove |
|---|---|---|
| Provider filtering information | Possible scanner or filter activity | That every remaining reported click was human |
| 190 campaign-attributed sessions | Some downstream visit activity | That sessions equal Unique clicking recipients |
| 38 sessions with a purchase | A downstream purchase outcome | That every Reported click reflected interest |
| Click timing and link spread | A pattern worth investigating | Automation or intent with certainty |
True or false: If many tracked links are activated seconds after delivery, you can conclude that recipients deliberately reviewed all of them.
For the Starter Kit campaign in the First 7 complete days after sending, the provider reports 152 Unique clicking recipients. This is a recipient count, counted once per recipient, and is an imperfect Reported clicks signal. A burst of tracked-link activity occurred soon after sending across multiple links.
Write a short review note that:
Write at least 120 characters (0/120).

Step 5 of 8
Use bounce and unsubscribe evidence to select proportionate list-health and eligibility actions without bypassing suppression or overstating causes.
For the Northstar Stationery Starter Kit campaign, the reporting window is First 7 complete days after sending. The report shows 100 Bounces: 60 classified as hard bounces and 40 as soft bounces. It also shows 19 Unsubscribes.
Treat these labels as operational signals, not a diagnosis of every address. A hard bounce generally indicates a permanent delivery failure. A soft bounce generally indicates a temporary failure. The provider’s current classification and handling rules remain the source of truth.
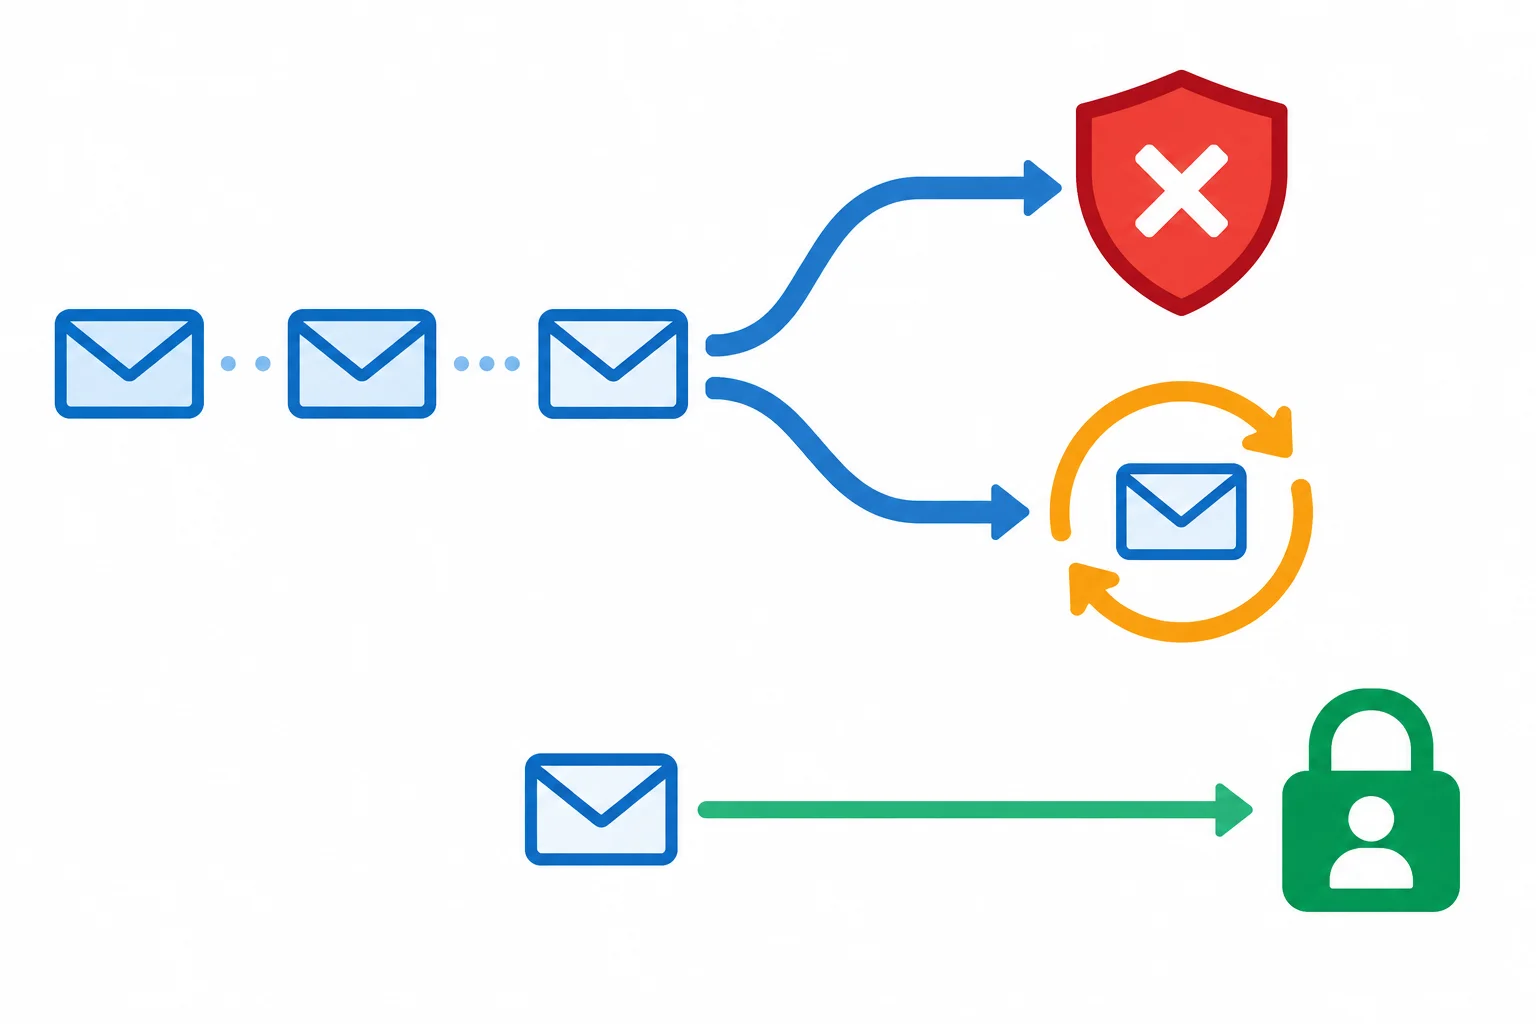
Hard bounces, soft bounces, and unsubscribes are different signals. Their labels and handling should not be treated as interchangeable.
Use the provider’s classification, retry behavior, and suppression rules before deciding what to do with an address.
| Signal | What it generally indicates | Appropriate action |
|---|---|---|
| Hard bounce | Likely permanent delivery failure | Honor suppression; review the provider failure reason and look for address-quality or signup-source patterns. |
| One soft bounce | A temporary delivery problem may be possible | Allow provider-managed retries and monitor the address under the provider’s policy. |
| Repeated soft failures | A continuing issue needs review | Follow provider policy; investigate failure reasons, source quality, and address accuracy rather than resending indefinitely. |
Warning
Do not manually reactivate a hard-bounced address or an unsubscribed address to make reach look better. Marketing suppression protects people and list quality. If an address can legitimately receive a message again, that decision must follow the provider process and the person’s valid, current permissions—not a reporting target.
Unsubscribes can point to a mismatch worth investigating: signup expectations, segment relevance, lifecycle timing, or overlapping marketing sends. They do not prove which one caused an opt-out.
Examine a rate change alongside its underlying count, and compare only reasonably comparable segments and send conditions. There is no universal “safe” bounce or unsubscribe threshold that replaces provider guidance and audience context.
Example
Evidence: 19 Unsubscribes were recorded for the Starter Kit campaign during the First 7 complete days after sending.
Reasonable checks: Were recipients expecting desk-organizer promotions? Was the segment relevant? Did a recent lifecycle message or another marketing send overlap?
Unsupported conclusion: “The desk organizer offer caused every unsubscribe.” The count supports investigation, not certainty about the cause.
Match each situation to the most appropriate response.
Tap an item and then its matching pair.
Step 6 of 8
Assess Welcome workflow cohorts by entry timing and complete observation windows before judging performance.
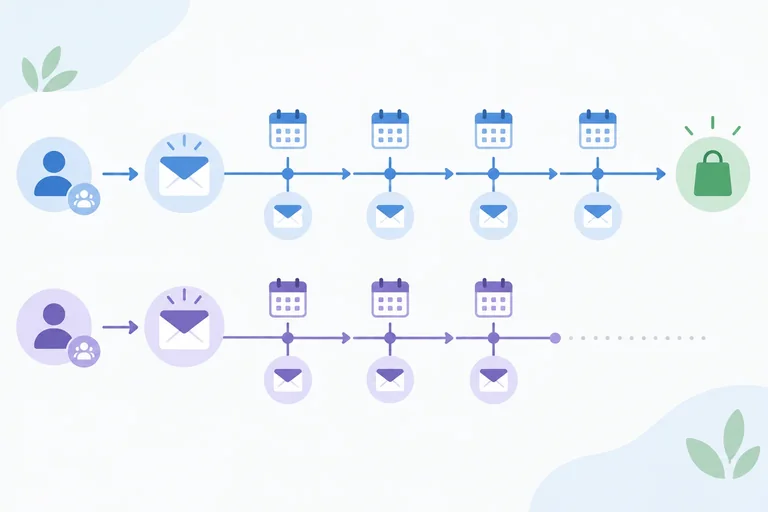
A workflow entry cohort groups contacts by when they entered the same workflow. This lets you ask a fair timing question: have both cohorts had the same opportunity to receive scheduled messages and produce the defined outcome?
For Northstar Stationery’s Welcome workflow, messages are scheduled on Day 0, Day 2, and Day 5. The complete outcome window ends after Day 12, leaving 7 days after the final scheduled message for purchases to occur.
A cohort observed only through Day 6 is not yet ready for a final workflow-outcome comparison.
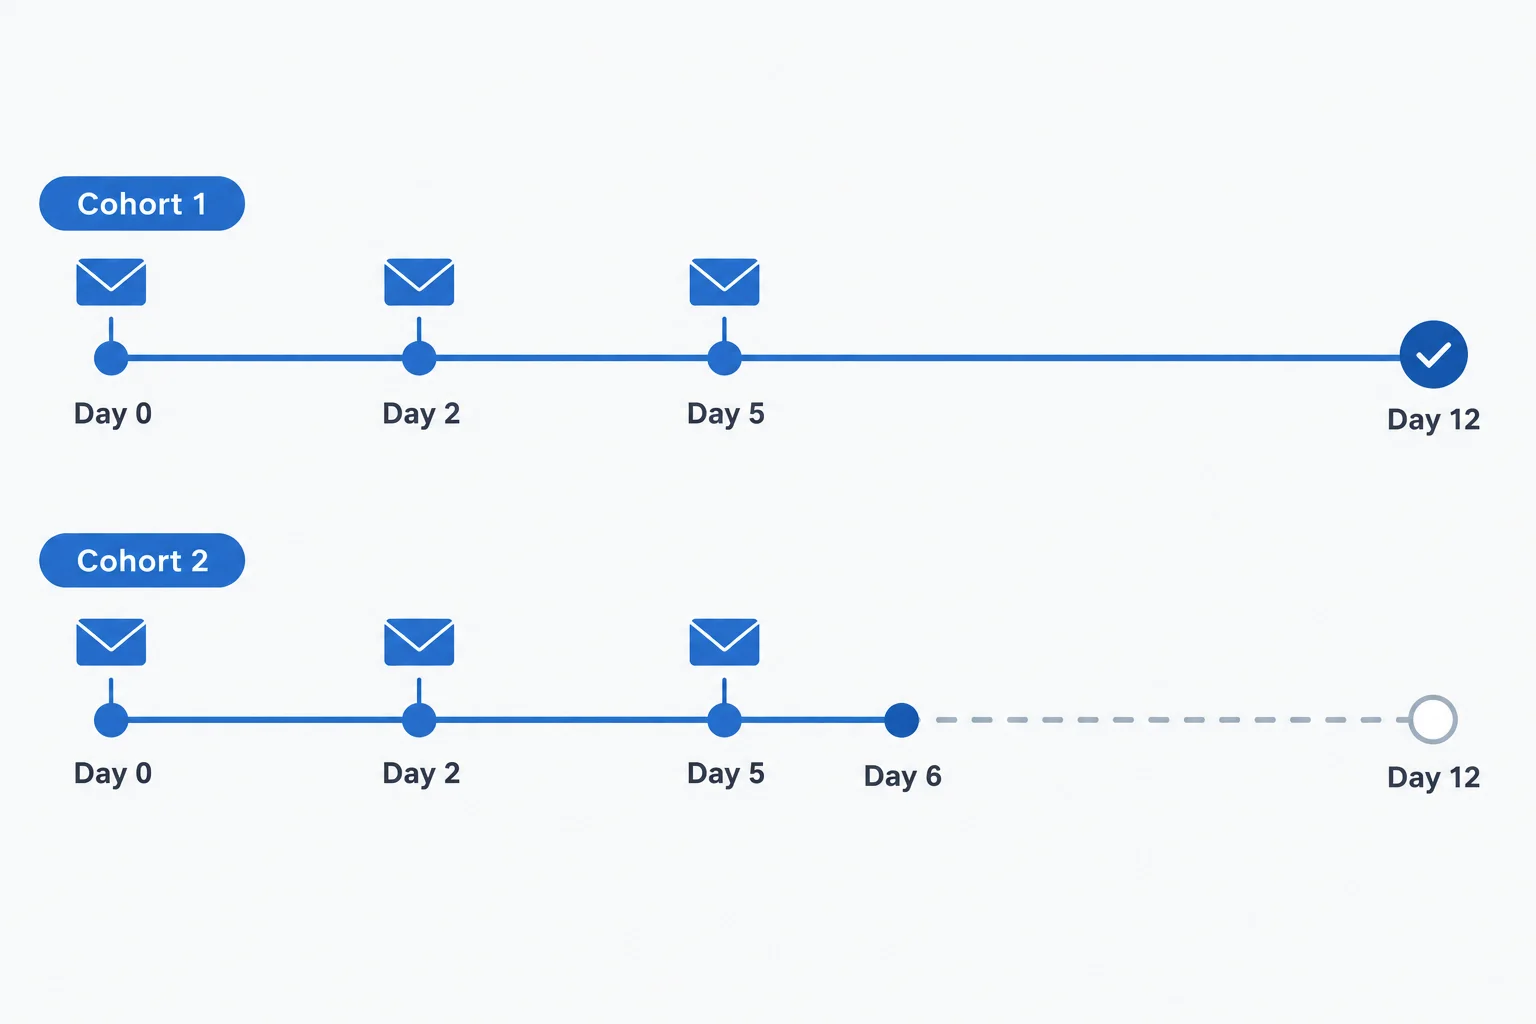
Compare cohorts only after each has reached the same Day 12 outcome cutoff.
Use eligible entrants as the fixed denominator for an entrant-level workflow purchase outcome. Retain entrants in their original cohort denominator even if they exit early after a valid purchase or eligibility rule.
Do not treat a contact still waiting for a scheduled message as a failure. Also keep this outcome separate from per-message delivery or reported-click rates: those measure messages or recipients at a message level, while this rate measures workflow entrants.
Both cohorts entered the same Welcome workflow under the same stated outcome definition: a purchasing entrant by Day 12. Only the Earlier cohort has complete observation.
| Cohort | Eligible entrants | Purchase outcome | Observation status |
|---|---|---|---|
| Earlier cohort | 200 | 20 purchasing entrants by Day 12 | Complete through Day 12 |
| Recent cohort | 200 | 8 purchasing entrants so far | Observation incomplete: through Day 6 only |
Example
For the completed cohort:
Workflow purchase outcome rate = purchasing entrants by Day 12 / eligible entrants × 100%
For the recent cohort, you may calculate a descriptive result so far, but label both its denominator and its incomplete observation status. It is not a Day 12 result and does not establish that cohort as lower-performing.
Which conclusion is supported by the Welcome workflow snapshot?
Use the Welcome workflow snapshot below to write a short cohort-status note.
Include: (1) the status of each cohort, (2) each calculated rate with its numerator, denominator, and time label, and (3) whether you would name a winner now and why.
Write at least 180 characters (0/180).

Step 7 of 8
Use connected evidence to select one proportionate improvement or test while protecting conversion measurement and list health.
A useful diagnosis follows the path from sending to outcome instead of optimizing one isolated number:
For the Northstar Stationery Starter Kit campaign, keep the units and window visible: 2,000 Attempted sends, 1,900 Delivered messages, 152 Reported unique clicking recipients, 38 Attributed purchasing recipients, 100 Bounces, and 19 Unsubscribes during the First 7 complete days after sending.
These observations do not, by themselves, prove a cause or tell you whether a result is “good.”
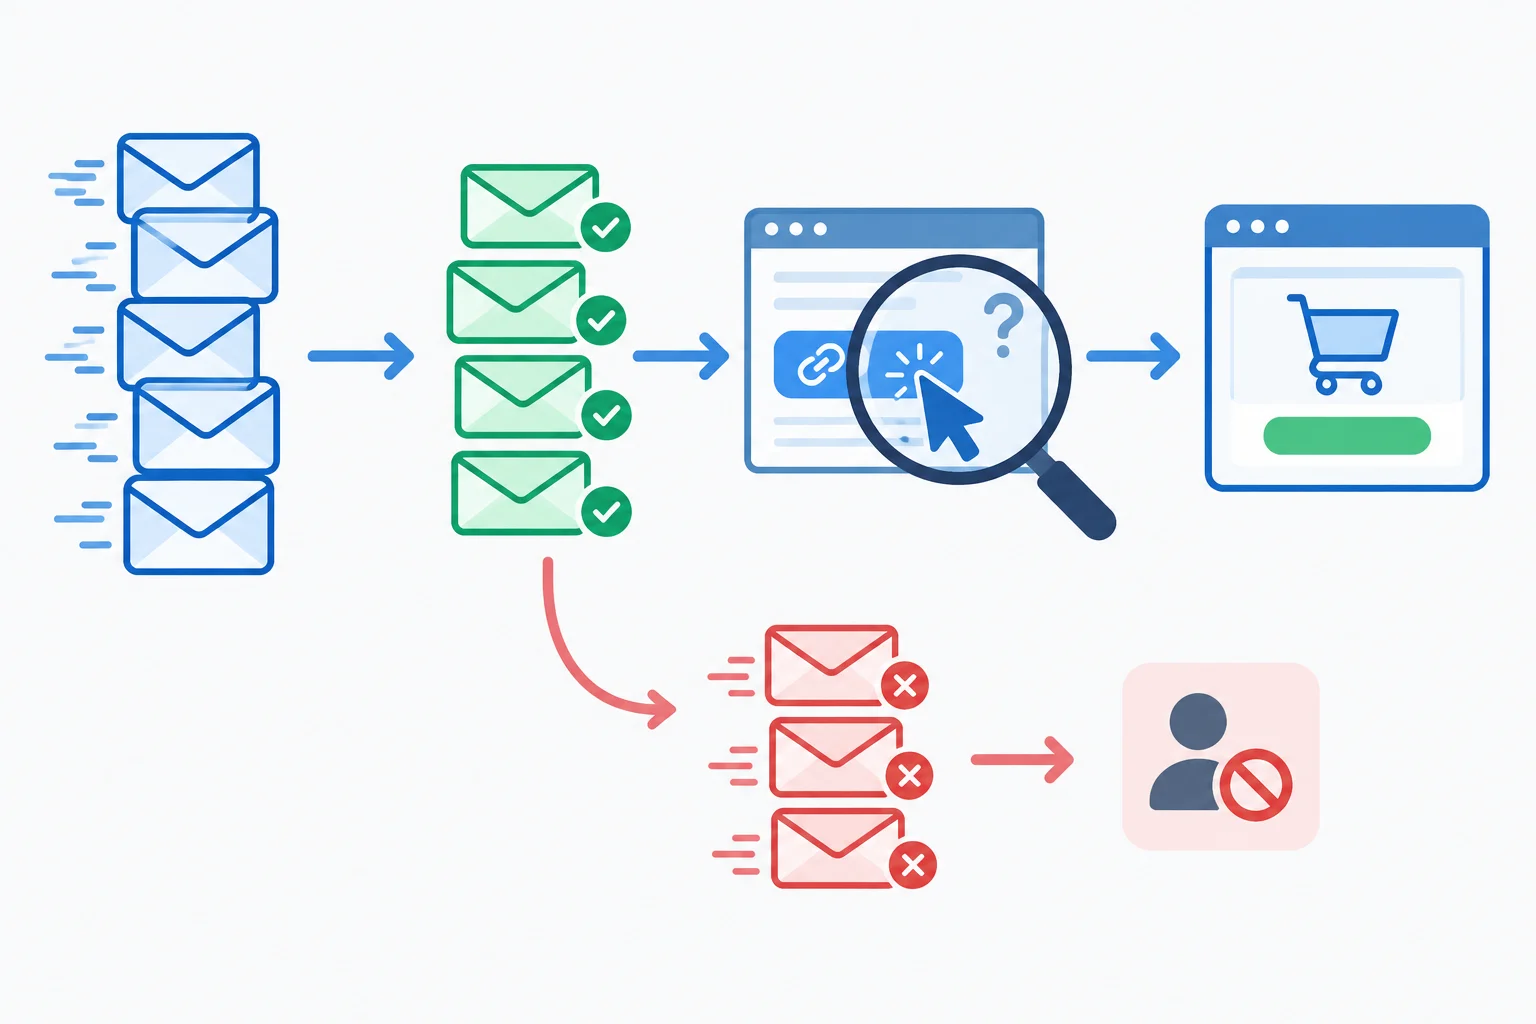
Read delivery, Reported clicks, destination outcomes, Bounces, and Unsubscribes together. Reported clicks are a signal to corroborate, not proof of deliberate interest.
Use a pattern only after checking that the comparison is fair: the same outcome definition, a comparable audience and eligibility rules, and a completed observation window. A historical difference can support a hypothesis; it cannot prove that a proposed change caused the difference.
For example, a recent Welcome workflow cohort observed only through Day 6 is still marked Observation incomplete. Do not compare its 8 purchasing entrants so far with an earlier cohort’s Day 12 result as if both had the same opportunity to convert.
Examples of proportionate diagnosis. “Weak” means lower than a comparable, fully observed baseline—not lower than a universal benchmark.
| Observed pattern | Possible explanation | Proportionate next step |
|---|---|---|
| Stable delivery; lower Reported clicks in a comparable group | Relevance, call-to-action, audience, or tracking difference | Check comparability; then test one relevance or CTA change |
| Reported clicks without downstream corroboration | Automated activity or measurement issue | Check tracking and provider filtering before changing the destination |
| Corroborated visits; lower purchase outcome in a comparable group | Message-to-destination mismatch or purchase-path friction | Inspect the path; test one aligned message or destination change |
| Hard bounces or Unsubscribes increase | Address quality, expectations, timing, or overlap issue | Follow suppression rules; review failure reasons or eligibility before more sends |
| Recent workflow cohort only through Day 6 | Observation incomplete | Wait for the Day 12 outcome window before judging it |
Match each evidence pattern to the most proportionate next move.
Tap an item and then its matching pair.
Write a concise recommendation for the Northstar Stationery Starter Kit campaign.
Use these observations from the First 7 complete days after sending: 2,000 Attempted sends; 1,900 Delivered messages; 100 Bounces, including 60 hard bounces; 19 Unsubscribes; 152 Reported unique clicking recipients; 38 Attributed purchasing recipients; and 190 campaign-attributed sessions with 38 sessions with a purchase.
Include:
Do not claim that a metric proves a cause or use a universal “good” benchmark.
Write at least 250 characters (0/250).

Step 8 of 8
Synthesize campaign and workflow evidence into a concise review with one cautious, measurable next action.
A useful campaign review is a decision brief, not a verdict. Separate what the reports show from what they cannot prove, then name one next action and the safeguards for reviewing it.
Use these seven labels in order:
A proposed explanation is not evidence. A change can be reasonable to test, but the historical report does not prove that the change will cause an improvement.
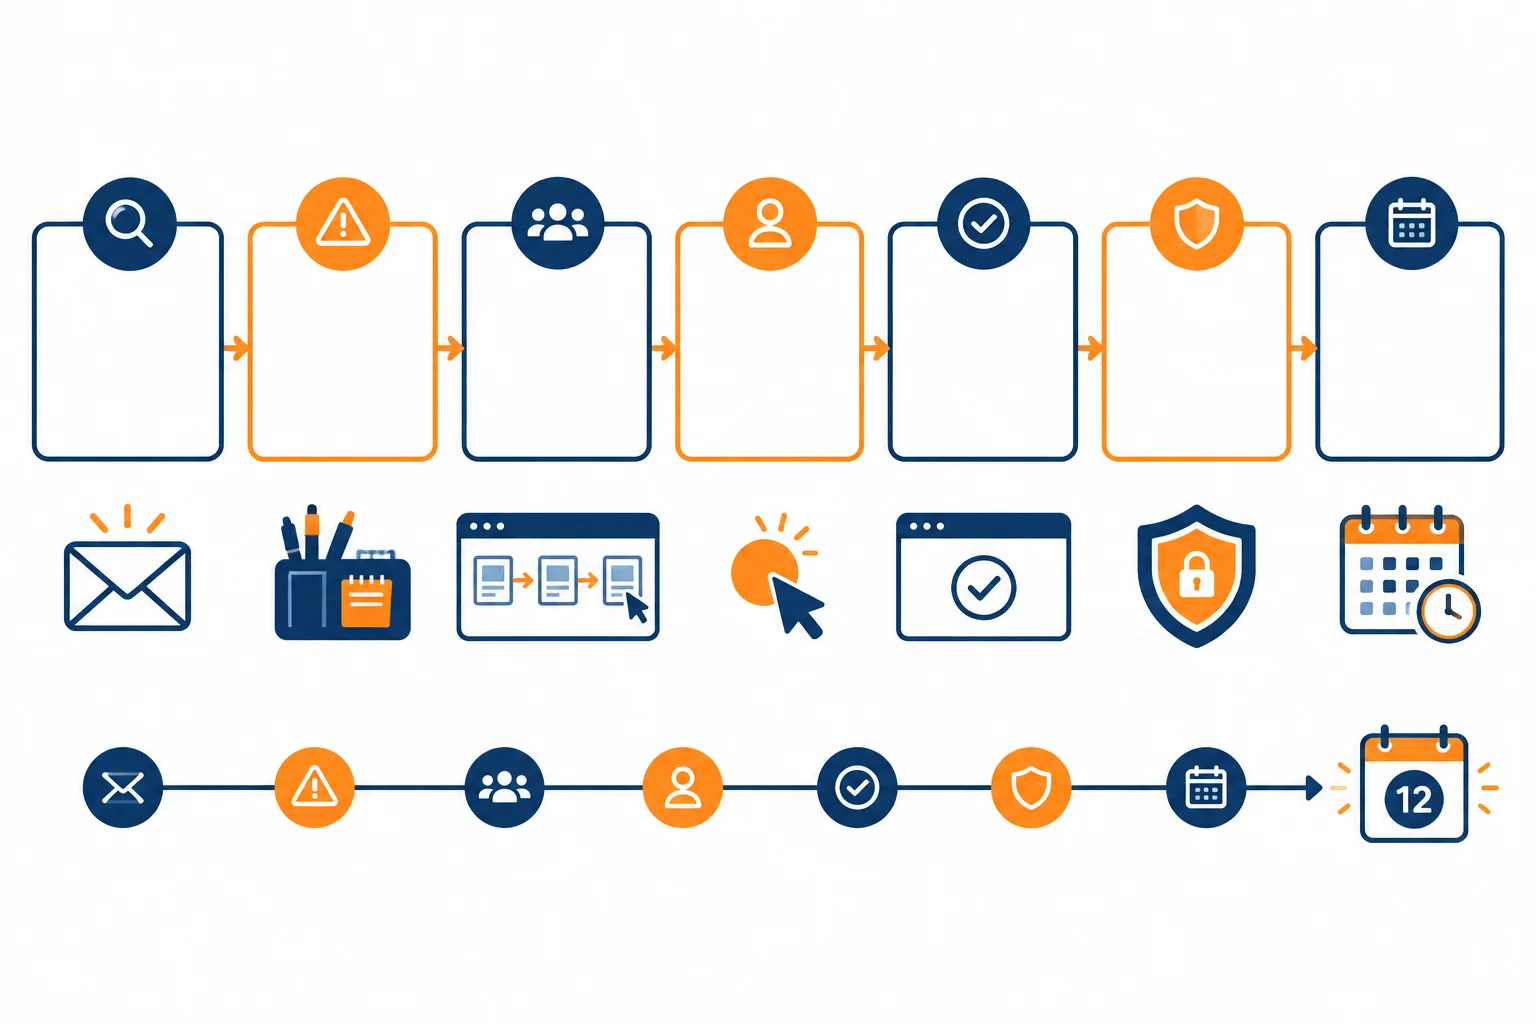
Use the brief to connect observed evidence to one cautious next action instead of optimizing an isolated metric.
Use these fictional reports for your Northstar Stationery review. The Starter Kit campaign promoted a desk organizer. Its reporting window is First 7 complete days after sending.
The website figures are session counts, not recipient counts. Reported clicks can include automated activity, and attributed purchases do not prove incremental impact.
For the Welcome workflow, messages are scheduled on Day 0, Day 2, and Day 5. A complete outcome window ends after Day 12, allowing 7 days after the last scheduled message. Eligible entrants remain in their original cohort denominator even if they exit early.
Starter Kit campaign — First 7 complete days after sending
| Metric | Counting unit | Count | Detail |
|---|---|---|---|
| Attempted sends | Messages | 2,000 | One delivery outcome each |
| Delivered messages | Messages | 1,900 | Provider acceptance, not proof of reading |
| Unique clicking recipients | Recipients | 152 | Reported clicks |
| Attributed purchasing recipients | Recipients | 38 | Counted once per qualifying recipient |
| Bounces | Messages | 100 | 60 hard bounces; 40 soft bounces |
| Unsubscribes | Unique recipients | 19 | One-time campaign |
| Campaign-attributed sessions | Sessions | 190 | Website report |
| Sessions with a purchase | Sessions | 38 | Website report |
Welcome workflow outcome snapshot
| Entry cohort | Eligible entrants | Observed through | Purchasing entrants | Cohort status |
|---|---|---|---|---|
| Earlier cohort | 200 | Day 12 | 20 | Complete |
| Recent cohort | 200 | Day 6 | 8 | Observation incomplete |
Write a concise Northstar Stationery review brief using the reports on the previous screen.
Use every required label exactly once: Evidence, Limitation, Cohort status, One change, Conversion outcome, Guardrail, and Review window.
In Evidence, calculate at least one campaign rate using Rate = numerator / denominator × 100%, name its denominator, and state the campaign reporting window. In Limitation, identify an engagement or attribution uncertainty. In Cohort status, address whether the Recent Welcome workflow cohort can be judged against the Earlier cohort. Propose only one evidence-linked change. Include a conversion outcome, an unsubscribe or delivery guardrail, and a fair review window.
Write at least 500 characters (0/500).
Summary
Your review is decision-ready when it keeps these distinctions visible: report evidence versus hypothesis, recipients versus sessions, reported engagement versus deliberate engagement, and completed workflow observation versus pending time in sequence.
Congratulations! You completed: Use Email Metrics to Improve Campaigns
You completed this level!
Up next: AI-Assisted Marketing Workflows
 Choose Marketing Tasks for AI AssistanceChoose suitable marketing tasks for AI assistance by weighing likely time savings, quality requirements, information risks, and current free-tier limits. Make a defensible choice without purchasing software or using real customer data.
Thousands of online courses in video, ebooks and audiobooks.
To test your knowledge during online courses
Generated directly from your cell phone's photo gallery and sent to your email
Download our app via QR Code or the links below:.



Carry knowledge in your pocket.
Download the Cursa app.
There are hundreds of free courses available, with a free certificate of completion that is saved in your mobile image gallery.
Download the app to access the Course Completion Certificate for Free.

+ 10 million
students

Free and Valid
Certificate

60 thousand free
exercises

4.8/5 rating in
app stores

Free courses in
video and ebooks