
Step 1 of 8
Define the Funnel Before Reading the Losses
Define the ordered session funnel and its counting contract before interpreting losses.

Learning path · Level 6 · Tutorial 3
Combine funnel counts and structured usability observations to identify plausible conversion barriers and prioritize improvements. Work from report tables and interface descriptions presented in the tutorial, with no analytics account or live store required.

 Define the Funnel Before Reading the Losses
Define the ordered session funnel and its counting contract before interpreting losses. 2 min
 Calculate Completion and Drop-Off
Calculate step completion rates, lost-session counts, and drop-off rates from adjacent milestones in the Cedar Trail simulated funnel. 3 min
 Turn Funnel Losses into Investigation Questions
Use funnel losses to choose an investigation focus while keeping explanations provisional. 2 min
 Write a Neutral Usability Task
Create a neutral usability task for the Cedar Trail simulated case and define what an observer should record. 2 min
 Separate Observations from Interpretations
Classify simulated usability-case records without turning observations or self-review into unsupported causal or frequency claims. 3 min
 Build an Evidence-Linked Backlog Record
Connect a plausible conversion barrier to evidence, a calibrated confidence rating, and a next check that reduces uncertainty. 3 min
 Rank Improvements by Impact and Effort
Make an evidence-led ranking of improvement candidates while keeping likely impact, effort, and uncertainty distinct. 3 min
 Finalize and Defend Your Priorities
3 min
Step 1 of 8
Define the ordered session funnel and its counting contract before interpreting losses.
Conversion rate optimization is an evidence-led cycle: identify a possible barrier, propose a focused change, then check what happens. Before interpreting any loss, make sure the funnel itself measures a consistent journey.
An ordered funnel is not a list of unrelated totals. Each later milestone must follow the earlier one for the same counting unit. In this case, the unit is a session.
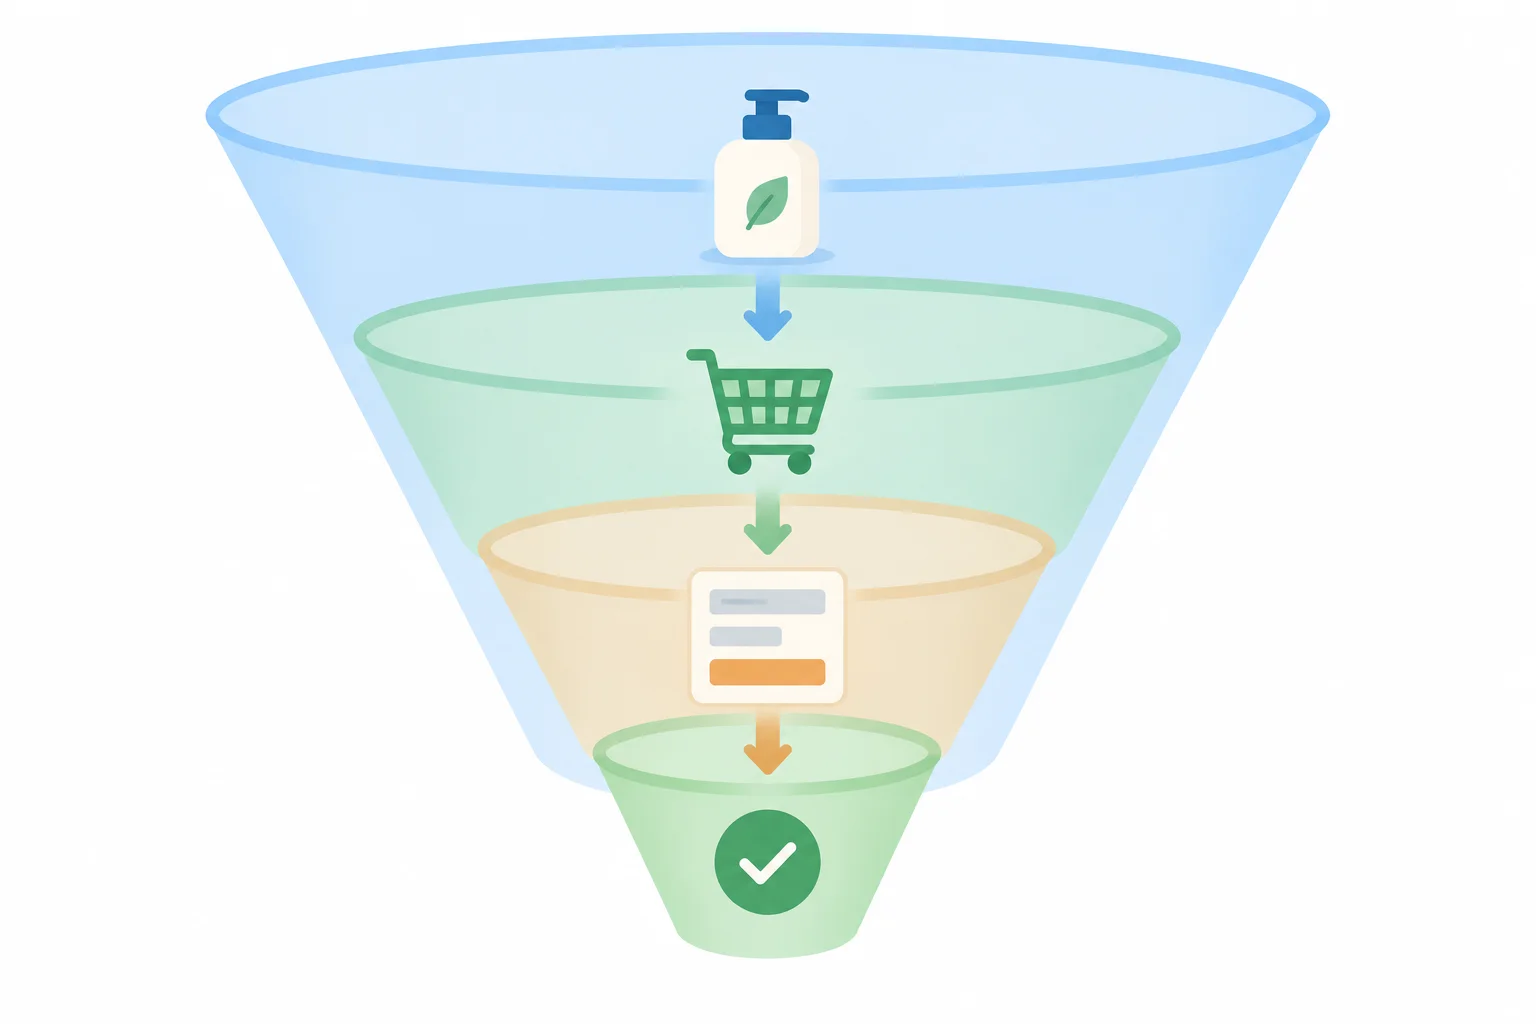
Simulated case: the ordered milestones are Product view, Cart addition, Checkout start, and Order confirmation. A session can reach a later milestone only after reaching the earlier milestones in that same session.
This report is a closed, ordered funnel for Cedar Trail's Trail Bottle. Read each number as sessions, not raw button clicks or event totals.
Simulated case: eligible sessions entered through Product view during the same seven-day reporting period. They were observed through the end of their session.
| Ordered milestone | Sessions |
|---|---|
| Product view | 1,000 |
| Cart addition | 400 |
| Checkout start | 250 |
| Order confirmation | 75 |
The counting contract makes the rows comparable. Keep it intact before drawing conclusions from the counts.
| Part of the contract | Rule |
|---|---|
| Counting unit | Session |
| Entry requirement | A session must reach Product view |
| Milestone order | Product view → Cart addition → Checkout start → Order confirmation |
| Time window | Session starts in the same seven-day reporting period |
| Completion rule | Milestones occur in order within that same session |
| Repeat counting | At most once per milestone per session |
Which statement is a valid interpretation of the Simulated case funnel report?
Step 2 of 8
Calculate step completion rates, lost-session counts, and drop-off rates from adjacent milestones in the Cedar Trail simulated funnel.
For one adjacent funnel transition, the current-step sessions are the earlier milestone and the next-step sessions are the milestone immediately after it. Use the current-step sessions as the denominator for both rates.
In the Cedar Trail funnel, moving from Product view to Cart addition means 1,000 current-step sessions and 400 next-step sessions. Do not use a later or earlier milestone as the denominator.
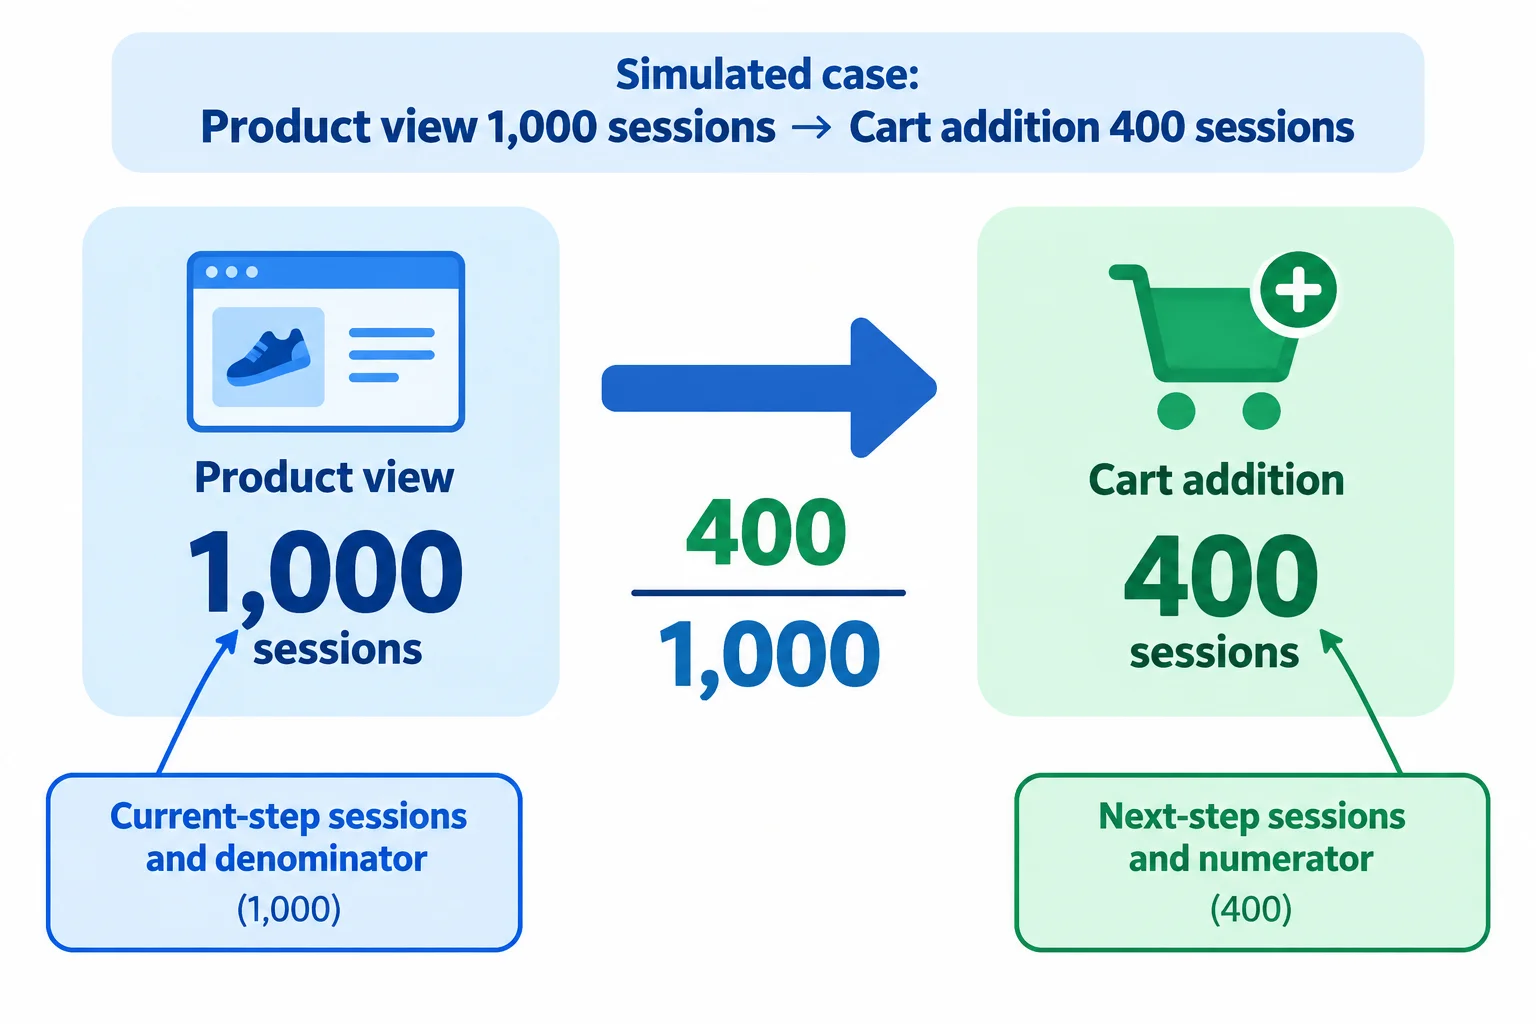
Simulated case: the earlier milestone supplies the denominator; the following milestone supplies the numerator for step completion.
Use these three calculations for every adjacent transition:
step completion rate (%) = next-step sessions / current-step sessions × 100
lost sessions = current-step sessions - next-step sessions
drop-off rate (%) = lost sessions / current-step sessions × 100
The two rates describe complementary outcomes for the same defined transition, so they add to 100.0%. A lost-sessions value is a count, not a percentage.
Example
Simulated case calculation for Cart addition → Checkout start:
Current-step sessions = 400
Next-step sessions = 250
Step completion rate = 250 / 400 × 100 = 62.5%
Lost sessions = 400 - 250 = 150
Drop-off rate = 150 / 400 × 100 = 37.5%
Both percentages use 400 as their denominator: 62.5% + 37.5% = 100.0%.
Simulated case: calculations for the Cart addition to Checkout start transition.
| Measure | Calculation | Result |
|---|---|---|
| Step completion rate | 250 / 400 × 100 | 62.5% |
| Lost sessions | 400 - 250 | 150 |
| Drop-off rate | 150 / 400 × 100 | 37.5% |
A rate needs a nonzero denominator. If current-step sessions are 0, neither step completion rate nor drop-off rate can be calculated: the transition rate is undefined, not 0%.
Report the zero current-step count and check the report definition or data collection before drawing conclusions. A 0% rate would claim a calculated result; here, division by zero prevents one.
Warning
Keep the labels precise: a zero count at the current step does not mean “zero drop-off.” It means there is no valid current-step denominator for that transition.
Simulated case: Checkout start has 250 sessions and Order confirmation has 75 sessions. Enter the number of lost sessions for this transition.
Simulated case: Checkout start has 250 sessions and Order confirmation has 75 sessions. Enter the drop-off rate for this transition.

Step 3 of 8
Use funnel losses to choose an investigation focus while keeping explanations provisional.
Simulated case — ordered funnel report
For each adjacent transition, read two different signals:
The largest count can point to the largest volume of unrecorded progression. The highest rate can point to the transition where progression is weakest relative to the sessions that reached it. They do not have to be the same transition.
Simulated case: Funnel transitions and calculated losses.
| Transition | Lost sessions | Drop-off rate |
|---|---|---|
| Product view → Cart addition | 600 | 60.0% |
| Cart addition → Checkout start | 150 | 37.5% |
| Checkout start → Order confirmation | 175 | 70.0% |
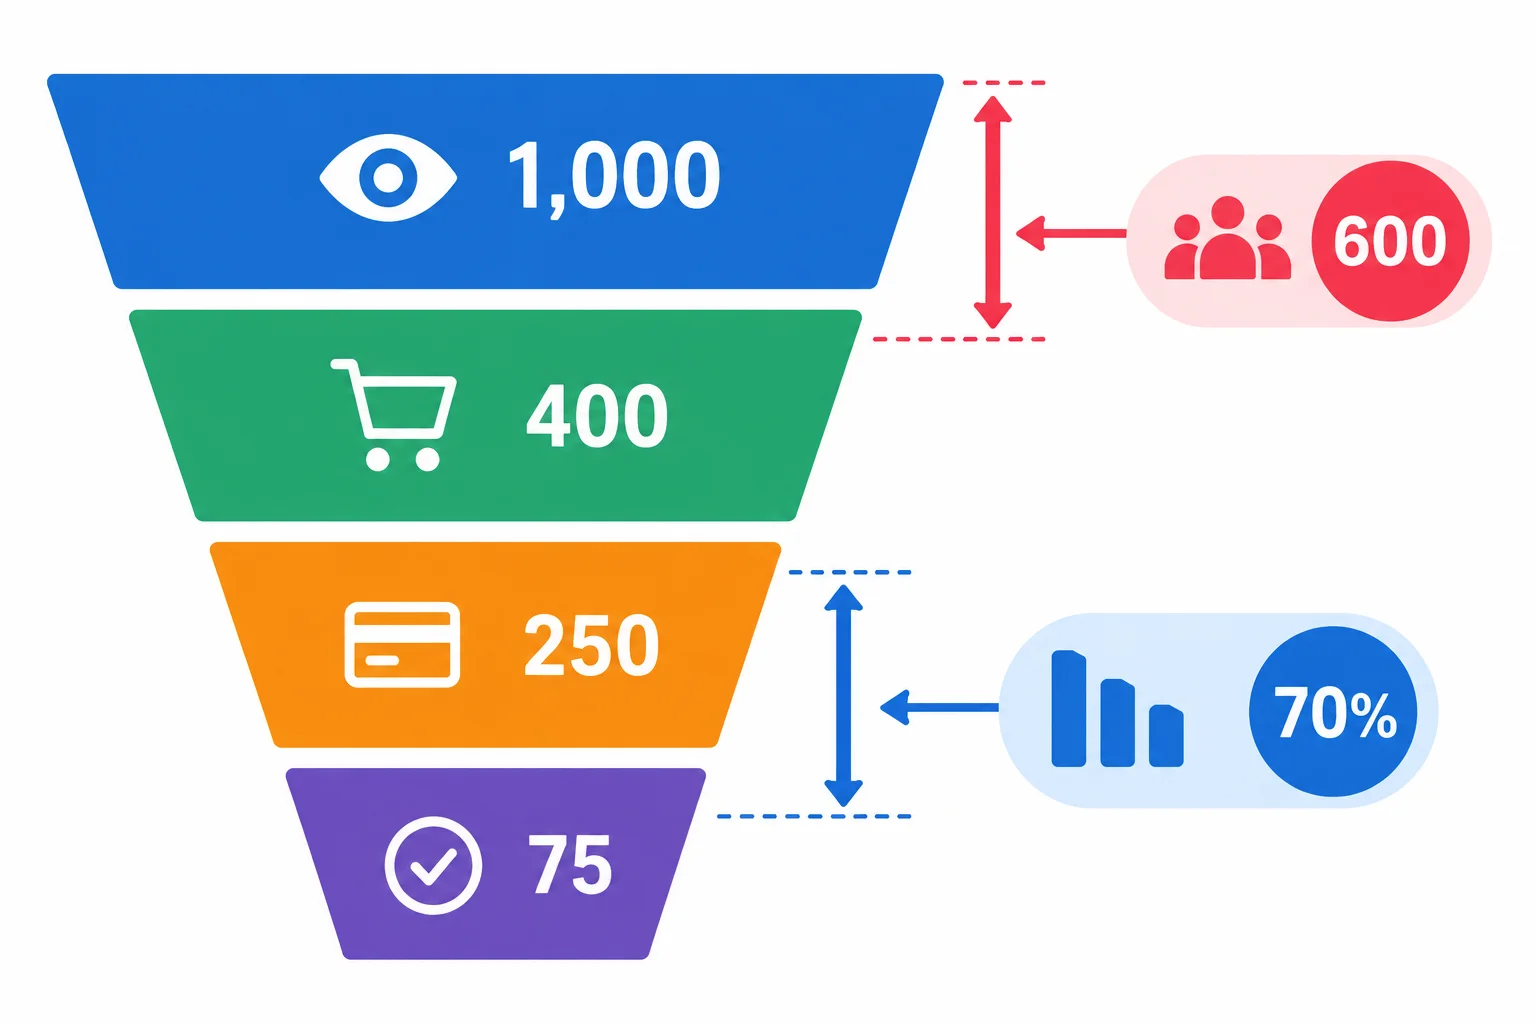
The first transition has the greatest lost-session count; the final transition has the highest drop-off rate.
A funnel loss is an investigation signal, not a diagnosis.
Under this funnel definition, a loss means a session did not record the next milestone in order before that session ended. It does not mean the person was permanently lost. They may return in another session, purchase elsewhere, or decide the product is not a fit.
Use the loss to choose where to look next. Do not treat it as proof of why the progression was not recorded.
The same pattern can have different explanations:
These explanations can also coexist. Funnel counts alone cannot tell you which explanation caused a loss.
Example
Start with a descriptive finding, then state the uncertainty.
Descriptive finding: “In the Simulated case, 175 sessions did not progress from checkout start to order confirmation; the drop-off rate was 70.0%.”
Unsupported causal claim: “The checkout has a broken form.”
The finding accurately describes recorded progression. The causal claim adds an explanation that the funnel table has not established.
Suppose you choose the checkout-start-to-order-confirmation transition as an investigation focus because its drop-off rate is highest.
A useful question is: What prevents some mobile checkout sessions from reaching order confirmation, if anything?
To narrow the possibilities, seek evidence that can distinguish them. For example, inspect whether order confirmation is recorded correctly, review the checkout flow for obstacles, and gather relevant observations from people attempting the flow. Each source has limits; none should be stretched beyond what it shows.
Tip
The Simulated case provides a possible clue: shipping first appears at final order review, and mobile postal-code errors say “Check your details” without identifying the field.
Those interface details make shipping disclosure and error guidance reasonable topics to investigate. They still do not prove that either detail caused the 70.0% drop-off rate. A high rate may reflect a mix of intent, friction, and measurement factors.
Phrase the next claim proportionately: “These details are plausible barriers worth checking.”
Example
What the case supports: “The product-view-to-cart-addition transition has the largest lost-session count, so it is a reasonable place to investigate high-volume exposure.”
What it does not support: “A brighter Add to cart button will recover those 600 sessions.”
The second statement assumes both a cause and an outcome. More evidence is needed before making either conclusion.
Which statement correctly interprets the Simulated case funnel?

Step 4 of 8
Create a neutral usability task for the Cedar Trail simulated case and define what an observer should record.
Simulated case — Cedar Trail mobile text wireframe
A shopper sees the Trail Bottle product page, priced at $30.00, with an Add to cart button. The cart shows the selected bottle and a checkout action. Checkout includes contact details and a postal-code field. At final order review, shipping is shown as $5.00 and the total is $35.00. An order confirmation appears after a completed order.
You can use this description to write and review a task; no working store is needed.
A structured usability task gives a shopper a realistic scenario while leaving their route open. It contains:
The task asks the participant to act naturally. It is not a test of whether they can guess what the observer suspects.
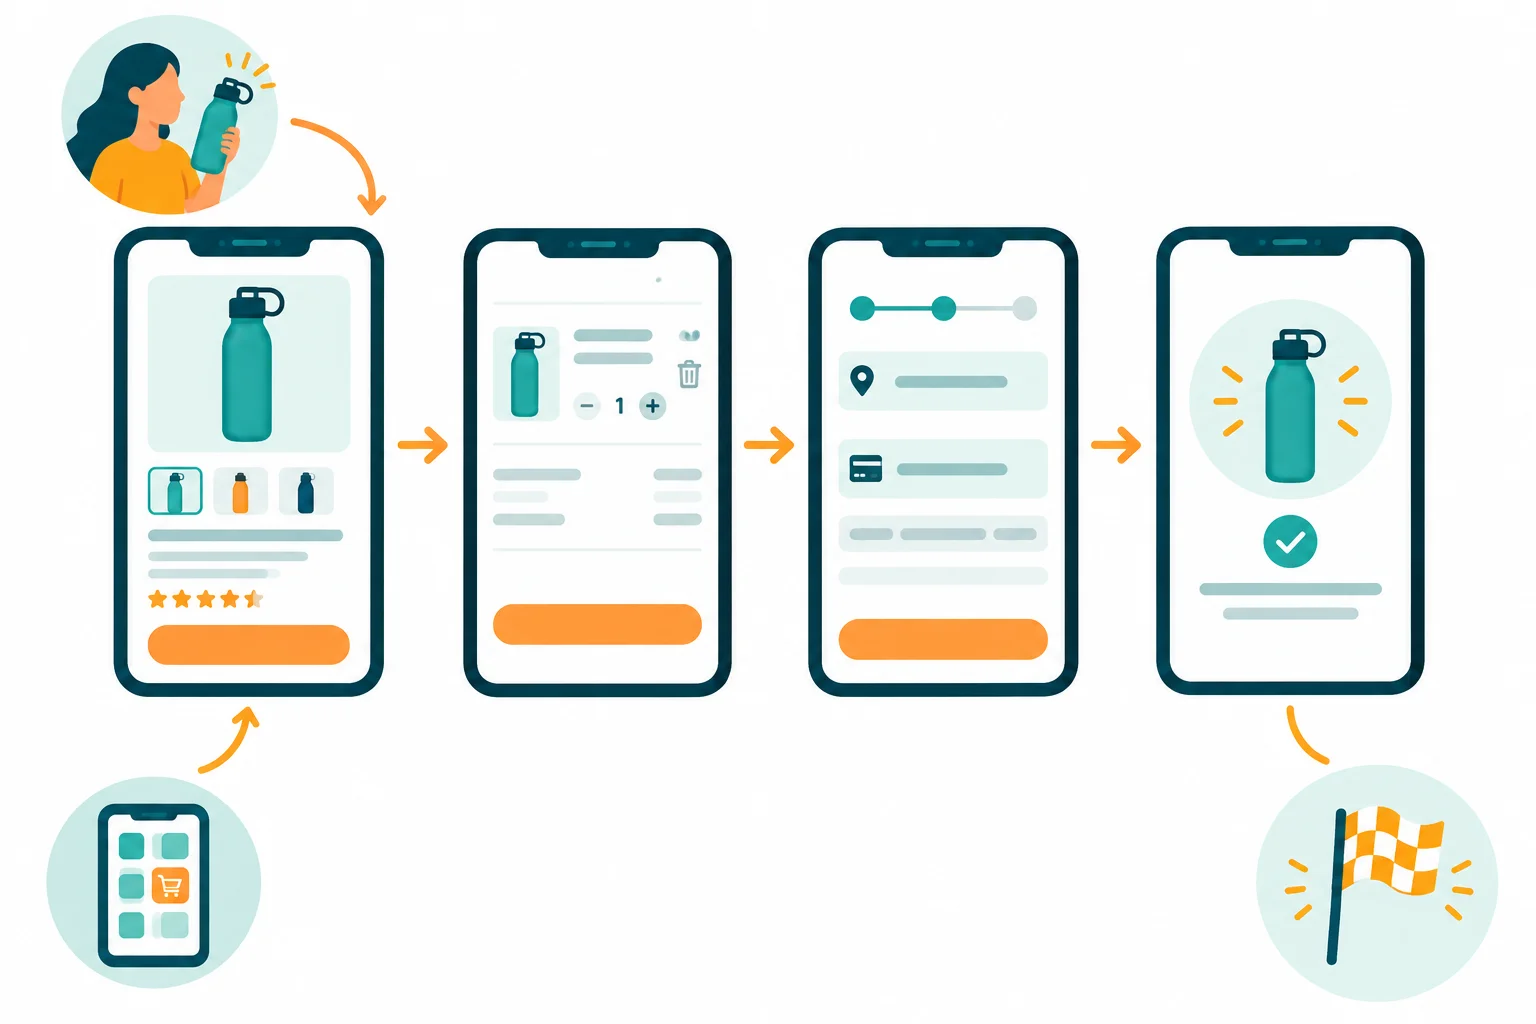
A task defines the destination and the boundaries of observation, not the path the shopper must take.
Use ordinary shopper language. State the goal, where to begin, and when to stop. Do not name a suspected defect, predict what the participant will feel, or tell them which button or field to use.
After the task begins, use a neutral follow-up only when useful. Good prompts invite description without suggesting an answer:
Avoid prompts that imply a correct reaction, such as “Was that confusing?”
Example
Leading version
“Find the checkout problem and explain why the price changes.”
This tells the participant what to look for and frames the expected reaction.
Neutral version
“You are considering one Trail Bottle for your own use. Starting on the product page, proceed as you normally would to buy it. Stop when you reach the order confirmation.”
Neutral follow-up
“What are you thinking as you go through this step?”
Record what happens before explaining what it might mean. A compact observation note can contain four factual fields:
Capture the sequence and exact words or messages when possible. Keep a separate space for possible interpretations so an explanation does not get written as if it were an observed fact.

First record the sequence of observable events; keep possible explanations in a separate note.
Using the Cedar Trail mobile text-wireframe description, write a short usability task and one neutral follow-up prompt.
Your task must include a shopper goal, a clear starting point, and an observable completion condition. Do not name a suspected problem or direct the shopper to a particular control.
Write at least 160 characters (0/160).

Step 5 of 8
Classify simulated usability-case records without turning observations or self-review into unsupported causal or frequency claims.
A source label tells you where a record came from. An evidence-category label tells you what the record says.
For this tutorial, label the supplied material Simulated case because it describes fictional Cedar Trail sessions. Then classify each record as one of these categories:
Keep these two dimensions separate: Simulated case is the source; Behavior, Participant opinion, and Analyst assumption are evidence categories.
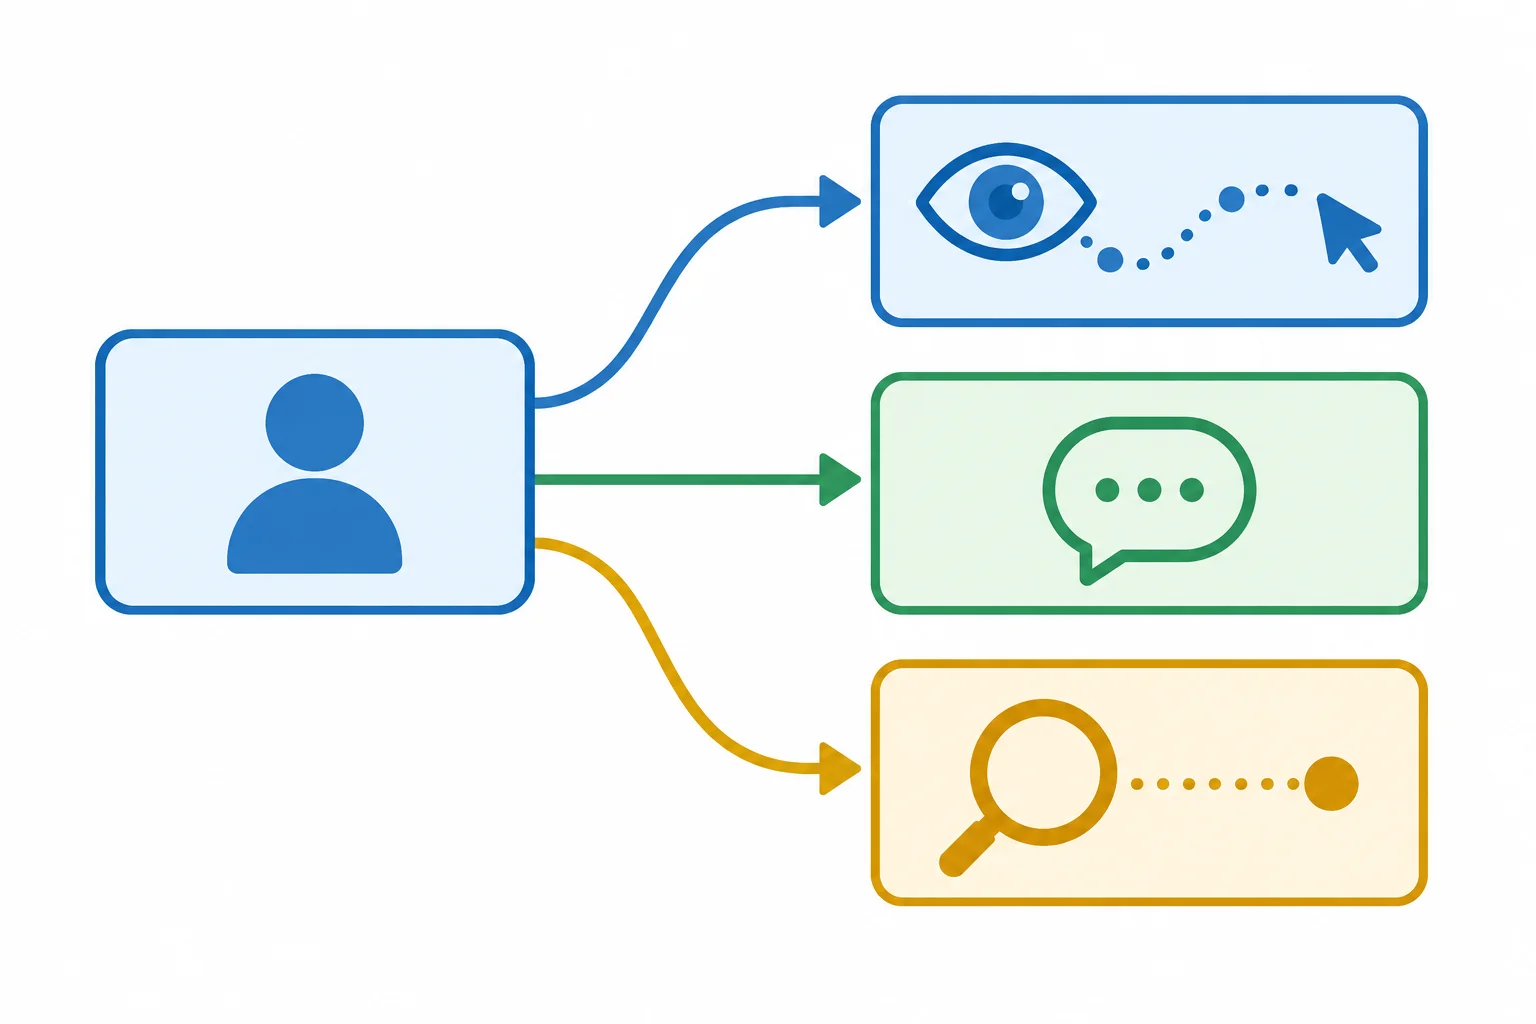
Use “Simulated case” as the source label, then apply one evidence-category label to the record.
The wording determines the category. Notice how the Behavior records describe sequences, while the Analyst assumption adds a cause that was not directly observed.
All records below have the source label Simulated case.
| Record | Evidence category | What it supports |
|---|---|---|
| Three of four participants returned to the cart after the $5.00 shipping charge first appeared at final order review. | Behavior | A visible sequence; not a stated motive. |
| A participant says, “I could not tell which detail needed fixing.” | Participant opinion | A reported perception; not proof of a design cause. |
| The shipping charge caused participants to return to the cart. | Analyst assumption | A possible explanation that needs checking. |
| Two participants encountered the generic postal-code message, “Check your details.” | Behavior | An observed error state; not evidence that it caused stopping. |
A text-wireframe walkthrough or your own self-review can reveal possible issues: unclear copy, missing information, an awkward sequence, or an error message that does not identify a field. Treat those discoveries as questions to investigate.
It does not reproduce another person’s attention, device conditions, prior expectations, typing behavior, or interpretation. A walkthrough is therefore not a substitute for observing real interaction on a functioning interface.
Warning
Simulated case contains four fictional mobile sessions. The behavior groups overlap: three participants returned to the cart after shipping appeared, two encountered the generic postal-code error, and one stopped without order confirmation while the other three reached confirmation.
These records can point to plausible barriers. They cannot establish how frequent a behavior would be among real Cedar Trail sessions, and a sequence of events does not establish that one event caused the next.
For each record, write its evidence category: Behavior, Participant opinion, or Analyst assumption.
Then explain why four fictional sessions and your own text-wireframe walkthrough cannot establish real-world frequency or causality.
Write at least 250 characters (0/250).

Step 6 of 8
Connect a plausible conversion barrier to evidence, a calibrated confidence rating, and a next check that reduces uncertainty.
An improvement backlog turns a clue into a decision-ready record. It does not declare a cause or promise more purchases.
Start with a specific plausible Barrier. Link it to a Proposed change, then state the Evidence and a Confidence rating. Add a Next check that can reduce a named uncertainty.
Use the full field names: Barrier, Proposed change, Evidence, Confidence, Likely impact, Effort, Next check, and Priority. This step focuses on the evidence-linked portion of a backlog record; impact, effort, and final priority come next.
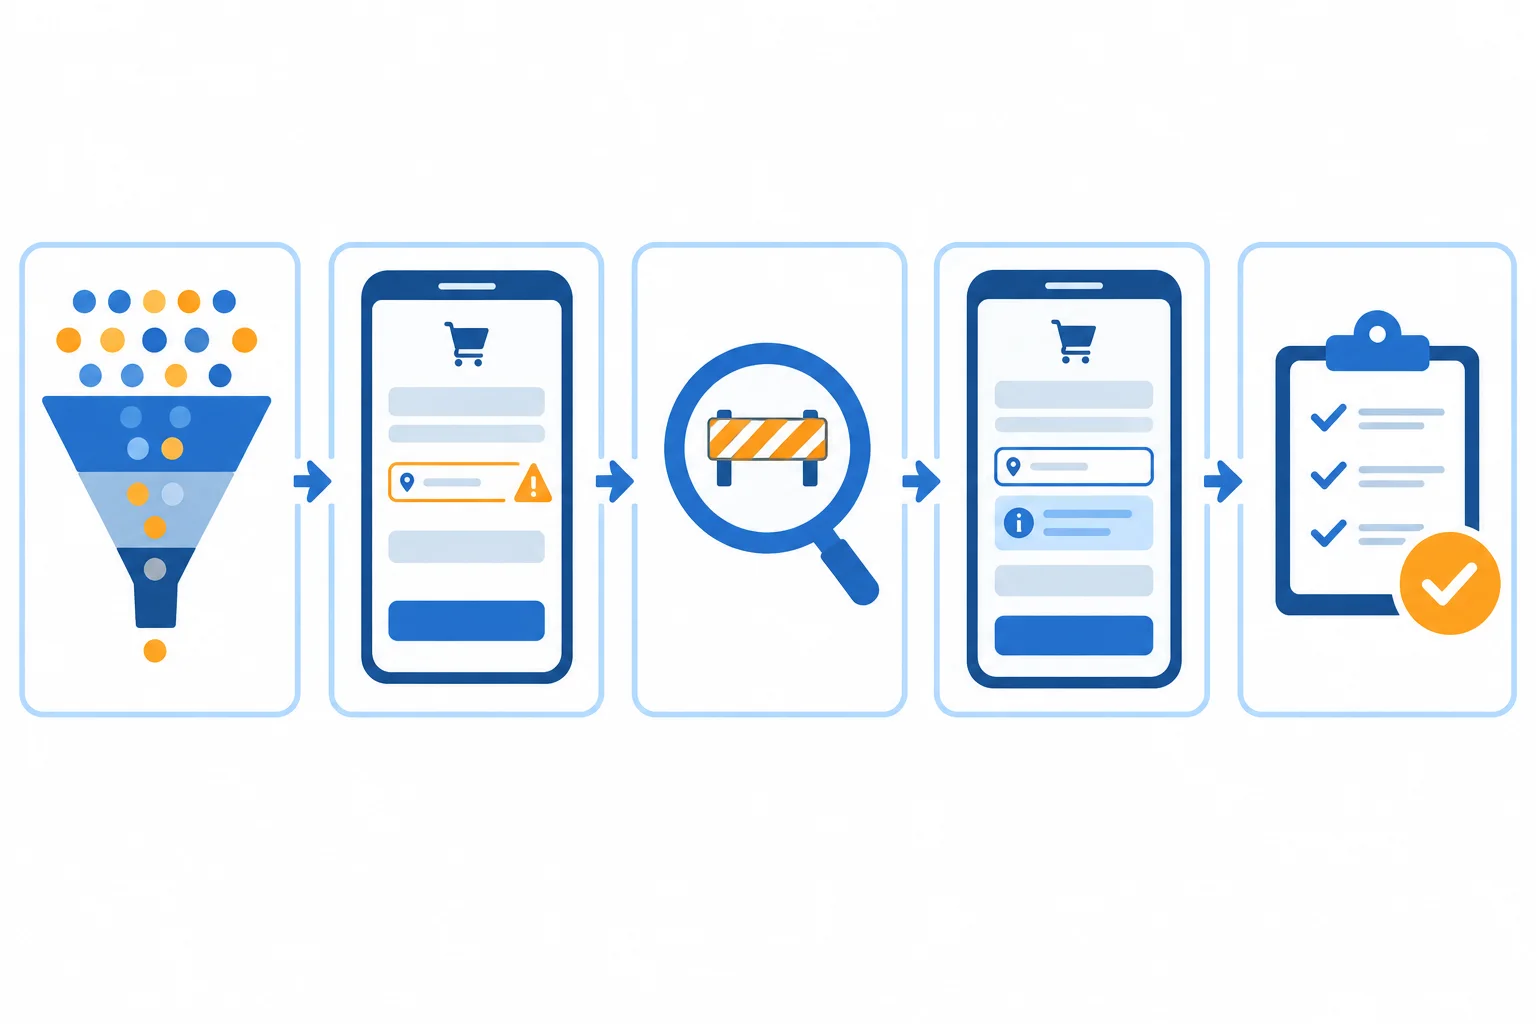
A backlog record makes each link visible: evidence supports a plausible barrier, which motivates a proposed change and a focused next check.
Tip
Write the barrier as a condition that may hinder progress, not as a claim about a visitor's hidden motive. “A generic postal-code error may make correction difficult on mobile” is more useful than “Visitors dislike checkout.”
Keep the scope of each source visible. The funnel is an ordered session report; the usability case contains four fictional mobile sessions. They can point toward the same investigation, but they are not one combined sample.
The behavior groups in the case overlap. Do not add three of four and two of four together as though they describe separate participants.
Both sources are labeled Simulated case. The evidence-category label describes what the record is; the source label describes where it came from.
| Source | Evidence category | Record | Scope |
|---|---|---|---|
| Simulated case | Behavior | 250 sessions started checkout; 75 reached order confirmation | Ordered eligible sessions in the seven-day report |
| Simulated case | Behavior | three of four participants returned to the cart after shipping appeared at review | Four fictional mobile sessions |
| Simulated case | Behavior | two participants encountered a generic postal-code error | Four fictional mobile sessions |
| Simulated case | Behavior | one of those two stopped without confirmation | Four fictional mobile sessions |
Tip
A Participant opinion can report a perception, while an Analyst assumption proposes an explanation still needing support. Neither should be rewritten as observed Behavior.
Confidence answers a narrow question: how plausible and relevant is this barrier, given the available evidence? It is not certainty that the Proposed change will increase purchases.
Use Low when the claim is mainly an unsupported Analyst assumption. Use Medium when limited, relevant evidence supports it but important alternatives remain. Use High only when relevant evidence converges and fewer alternatives remain unresolved.
For example, the shipping pattern has Medium confidence: three of four mobile participants returned to the cart after the $5.00 shipping charge appeared at final order review, but this small simulated case cannot establish why each participant returned.
Example
A useful Next check names the uncertainty it addresses.
“Launch the change and expect more orders” is not a next check; it leaves the uncertainty unnamed.
Warning
A brighter Add to cart button is not automatically a strong backlog record. Without relevant Behavior or Participant opinion, “it will get more clicks” is an Analyst assumption and begins with Low confidence. A next check should seek relevant evidence rather than predict an uplift.
Draft the evidence-linked portion of one backlog record for the mobile postal-code experience. Include all five requested fields. Use only the Simulated case records from the previous screen, keep the Barrier provisional, and make the Next check address a real uncertainty rather than promise an uplift.
Write at least 250 characters (0/250).

Step 7 of 8
Make an evidence-led ranking of improvement candidates while keeping likely impact, effort, and uncertainty distinct.
Likely impact is a judgment about what could matter if a plausible barrier is real. Consider three questions:
The Simulated case has 250 Checkout start sessions and 75 Order confirmation sessions. That makes the final checkout transition an important investigation area. But 175 sessions without recorded progression are not automatically 175 recoverable orders, and they do not identify a cause.
For example, three of four mobile participants returned to the cart after the $5.00 shipping charge appeared at final review. That makes earlier shipping disclosure a plausible candidate with possible reach. It does not establish why they returned or prove that disclosure would change their outcome.
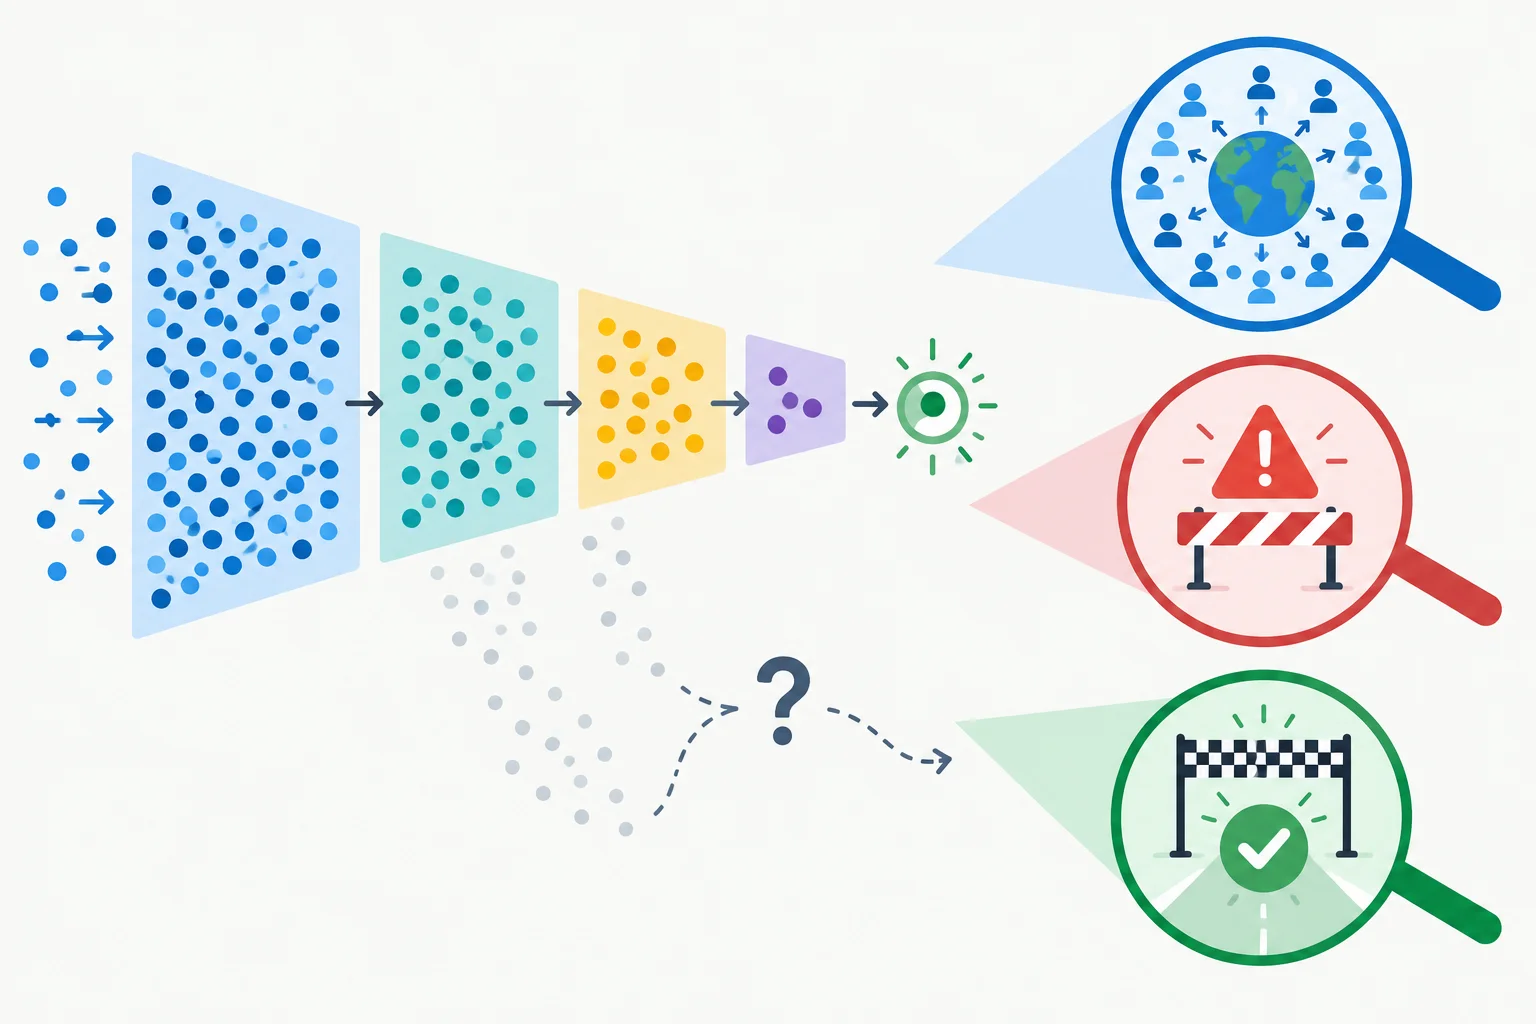
Simulated case funnel volume can indicate possible exposure. It cannot show that every lost session was caused by one barrier or can be recovered.
Tip
Do not let a large count become an outcome promise. The 600 sessions that did not progress from Product view to Cart addition show possible exposure at that transition; they do not show that a brighter Add to cart button would recover 600 sessions.
Compare backlog records side by side, but do not hide judgment inside a precise-looking composite score. Use the existing fields—Barrier, Proposed change, Evidence, Confidence, Likely impact, Effort, Next check, and Priority—and explain the trade-off.
Both evidence-supported candidates have Medium Confidence in this Simulated case. The shipping pattern is relevant but does not establish why participants returned. The postal-code pattern shows a real generic error state, but the small case cannot establish how often it prevents completion.
Likely impact can reasonably be judged differently. A team may emphasize shipping's broader possible checkout reach and Small effort, or the error guidance's direct relevance to correcting a blocking-looking state and its closer link to one observed noncompletion. State which consideration you give more weight.
These are comparison inputs, not a hidden scoring formula. Behavior groups overlap, so do not add their participant counts together.
| Proposed change | Evidence | Impact consideration | Effort |
|---|---|---|---|
| Earlier shipping disclosure | Behavior: three of four returned to the cart after the $5.00 shipping charge appeared at final order review. | Possible exposure across checkout; repeated returns, but the reason for returning is unknown. | Small |
| Field-specific error guidance | Behavior: two of four encountered the generic postal-code error; one of those two stopped without Order confirmation. | Potentially narrower reach; directly relevant to correction and close to successful completion. | Medium |
| Brighter Add to cart button | 1,000 Product view sessions and 400 Cart addition sessions, but no Behavior record identifies the button as a barrier. | Possible high-volume exposure only; no case evidence connects the button to the loss. | Small |
Tip
A worthwhile investigation is not automatically a worthwhile improvement. Keep the brighter button behind candidates with relevant evidence until a Next check investigates whether button visibility is actually a barrier.
Conversely, if direct inspection verifies a functional or accessibility problem, fixing it can deserve priority on its own merits even when conversion uplift is unknown. The Simulated case's generic message is a clue to inspect; do not label it a verified accessibility failure without checking the interaction.
Which decision principle best supports a transparent ranking of the three Simulated case candidates?
Rank all three Simulated case candidates with Priority 1, 2, and 3, where 1 is highest:
Give one concise rationale for your ranking. Name the main trade-off between the two evidence-supported candidates, using evidence, likely impact, and effort. Also explain why the brighter button does not earn an early priority merely because its Effort is Small. End with one specific Next check for your Priority 1 candidate.
Write at least 220 characters (0/220).

Step 8 of 8
You now have the full decision path: define a consistent funnel, locate a loss, examine structured observations, describe a plausible barrier, and prioritize the next action.
The result is an improvement backlog—not a verdict. It helps a team decide what to address or investigate first. A funnel loss can point to a stage worth investigating, while a behavior record can make one explanation more plausible. Neither source alone proves a cause or guarantees more purchases.
Your final rationale should separate:

Use the funnel and observations as inputs to a decision, while keeping the decision provisional.
Use this recap as your source material. The report is a closed, ordered funnel: eligible sessions started during the same seven-day period, completed milestones in order within one session, and counted at most once per milestone.
For the final transition, use:
step completion rate (%) = next-step sessions / current-step sessions × 100
The current step is Checkout start; the next step is Order confirmation. Show the resulting percentage to one decimal place in the evidence for your top-ranked backlog record.
Simulated case — funnel report
| Transition | Current-step sessions | Next-step sessions |
|---|---|---|
| Product view → Cart addition | 1,000 | 400 |
| Cart addition → Checkout start | 400 | 250 |
| Checkout start → Order confirmation | 250 | 75 |
Simulated case — candidate changes, observation records, and relative implementation estimates. The behavior groups overlap: they do not describe separate groups of participants.
| Proposed change | Case clue | Effort |
|---|---|---|
| Earlier shipping disclosure | Behavior: three of four participants return to the cart after the $5.00 shipping charge appears at final order review. | Small |
| Field-specific error guidance | Behavior: two of four encounter the generic postal-code error; one of those two stops without Order confirmation. | Medium |
| Brighter Add to cart button | The funnel shows fewer Cart additions than Product views, but the case contains no behavior record about the button. | Small |
Create a concise improvement backlog from the Simulated case recap.
Write exactly three backlog records: one for each proposed change. Use these field names in every record: Barrier, Proposed change, Evidence, Confidence, Likely impact, Effort, Next check, and Priority.
Requirements:
Your Next check should target a specific unresolved uncertainty, not promise a test result.
Write at least 700 characters (0/700).
Summary
Congratulations! You completed: Prioritize Conversion Improvements from Evidence
Thousands of online courses in video, ebooks and audiobooks.
To test your knowledge during online courses
Generated directly from your cell phone's photo gallery and sent to your email

Download our app via QR Code or the links below:.



Carry knowledge in your pocket.
Download the Cursa app.
There are hundreds of free courses available, with a free certificate of completion that is saved in your mobile image gallery.
Download the app to access the Course Completion Certificate for Free.

+ 10 million
students

Free and Valid
Certificate

60 thousand free
exercises

4.8/5 rating in
app stores

Free courses in
video and ebooks