
Step 1 of 9
Start with the Decision
Define a focused dashboard brief for Northstar Studio before building the report.

Learning path · Level 5 · Tutorial 5
Build a focused Looker Studio dashboard using practice rows written on screen and manually entered into your own Google Sheet, or a suitable source you can access. Validate the results and use them to explain a business-relevant finding without a live website or paid connector.
 Start with the Decision
Define a focused dashboard brief for Northstar Studio before building the report. 2 min
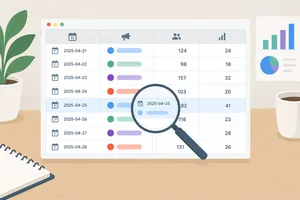 Create a Chart-Ready Practice Sheet
Create the complete Northstar Studio practice table in your own Google Sheet, using consistent records and field types that will be ready for later charting. 4 min
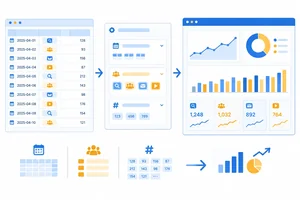 Connect the Sheet and Check the Fields
Connect the practice sheet through Looker Studio’s free Google Sheets connector and verify the field settings needed for reliable count-based charts. 3 min
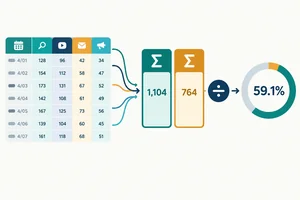 Calculate a Rate That Aggregates Correctly
Create a calculated Session key-event rate that stays valid when the underlying rows are grouped or filtered. 3 min
 Build the Overview Scorecards
Create a focused one-page overview with three readable, verifiable scorecards. 2 min
 Add the Trend and Channel Comparison
Build complementary trend and channel-comparison views that keep inquiry-session rates connected to their supporting counts. 3 min
 Test Dates, Totals, and Freshness
4 min
 Share Without Exposing the Source
Choose a restricted sharing setup and understand how report permission differs from access to the underlying source. 2 min
 Present One Finding and One Next Check
Present a validated dashboard finding carefully, with an appropriate next check, limitations, and sharing boundary. 3 min
Step 1 of 9
Define a focused dashboard brief for Northstar Studio before building the report.
A useful dashboard brief names three things:
For Northstar Studio, the audience is the marketing lead. The question is: Which acquisition channel deserves the next inquiry-performance check?
This is deliberately narrow. The dashboard should help prioritize an investigation, not attempt to explain why a result happened.
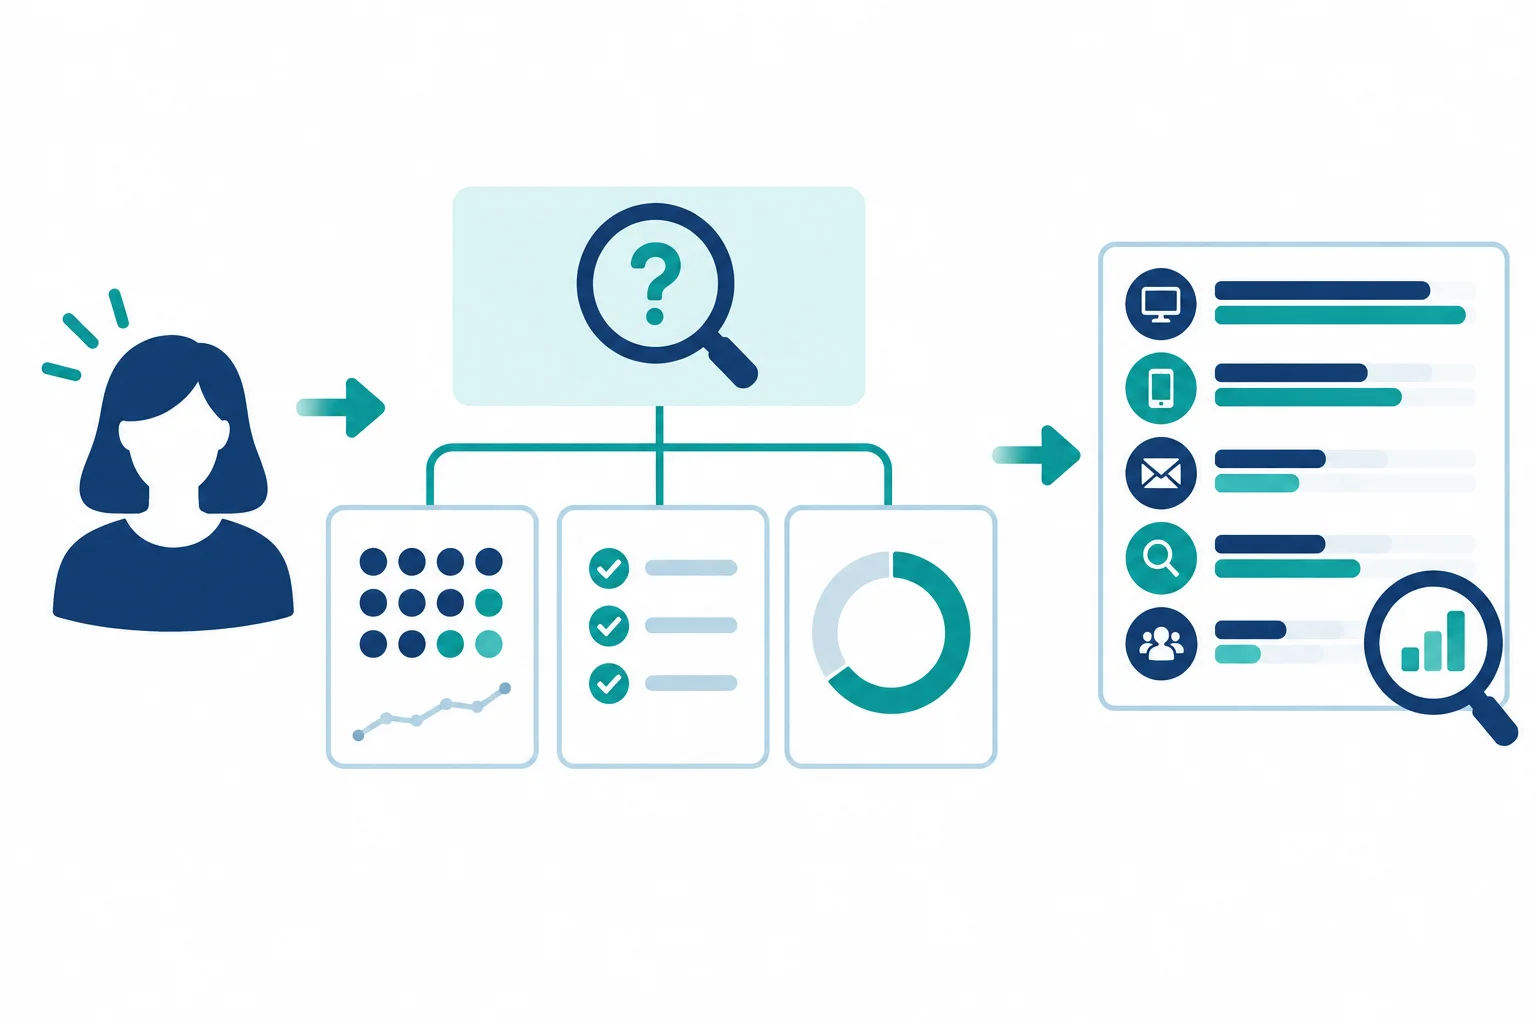
A decision-focused dashboard connects its audience, question, measures, and next check.
Use these three measures, viewed by date and channel:
In this practice, the only designated key event is an inquiry submission. A session with one or more inquiry submissions contributes once to Sessions with key event.
Together, the measures show volume and inquiry-session performance. A rate without its supporting counts can be misleading, so the dashboard will keep them together.
Example
Dashboard brief example
The dashboard can show a difference. It cannot, from these measures alone, prove a cause or prescribe a budget change.
You will build in your own browser with your own Google Sheet and Looker Studio account, using free features. No live website, paid connector, supplied project, or downloadable file is required.
If you cannot access an account, continue with the on-screen planning and validation work. You can still create a dashboard specification, but you will not create a live report.
Which dashboard brief is the best fit for Northstar Studio's stated business question?
Step 2 of 9
Create the complete Northstar Studio practice table in your own Google Sheet, using consistent records and field types that will be ready for later charting.
Create a Google Sheet named Northstar Studio - Dashboard Practice. Name its worksheet Daily channels.
This sheet is a small, rectangular practice source: one header row followed by 12 records. Each record represents exactly one Date + Channel combination. The three channels repeat once for each of four dates.
Use the headers exactly as shown in the next screen and keep their order. This source is synthetic practice data, so you can enter it manually in your own Sheet—no download, live website, or external dataset is needed.
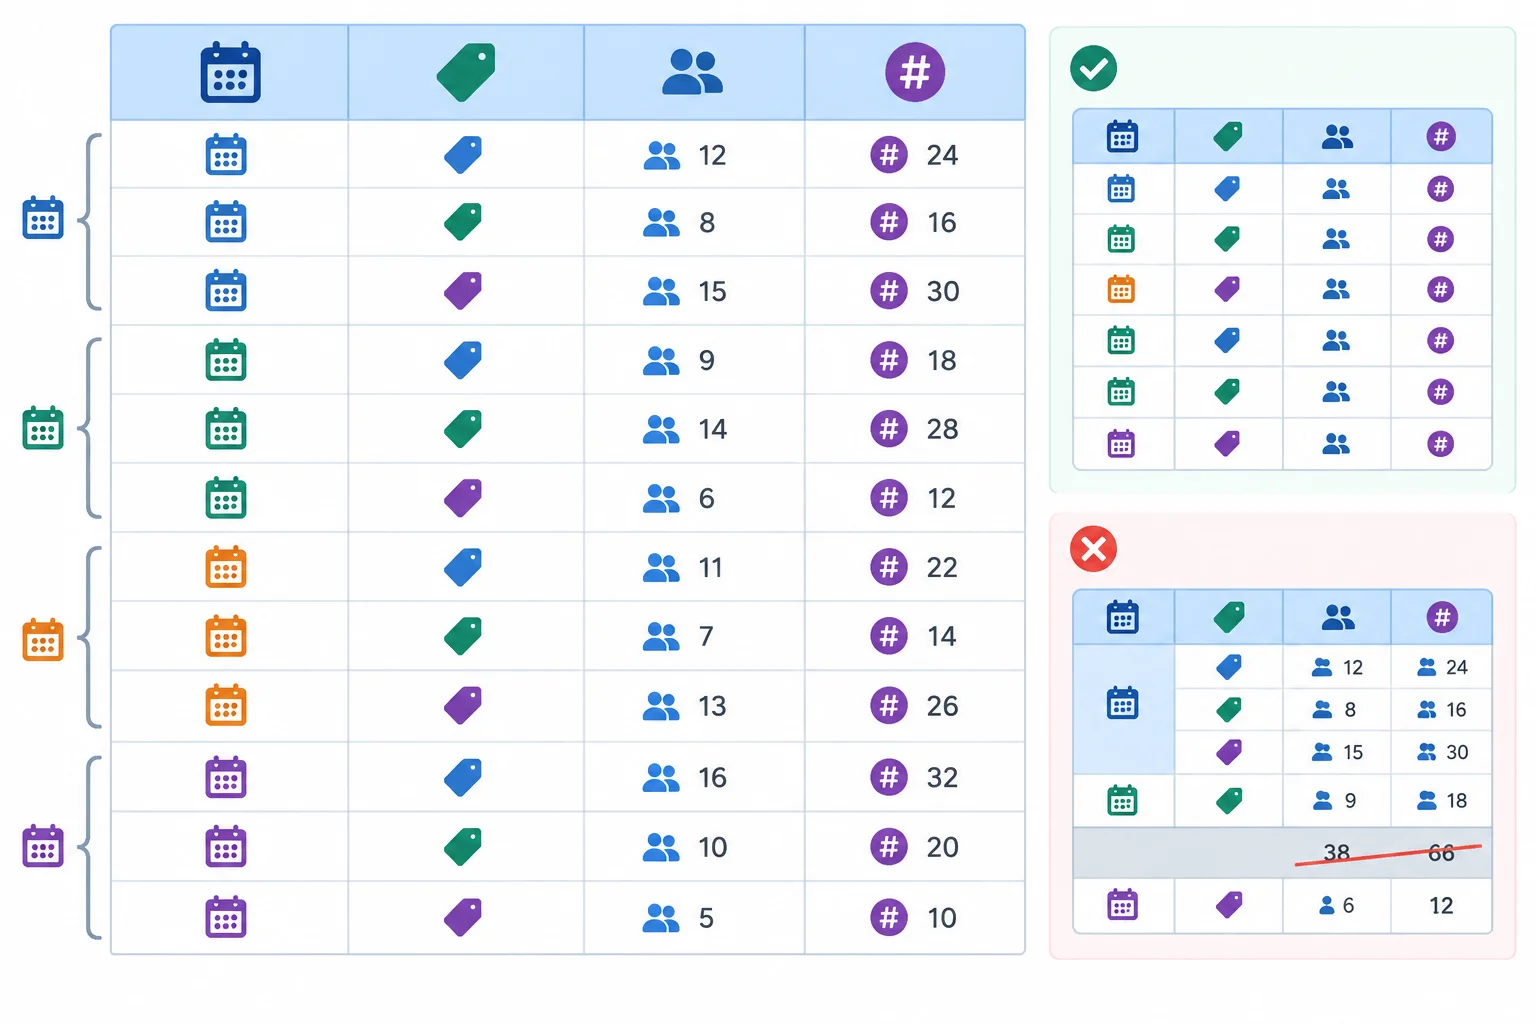
A chart-ready source has one consistent row grain: one date and one channel in every data row.
Enter the following four headers in row 1, from left to right: Date, Channel, Sessions, and Sessions with key event.
Then enter the 12 rows below. Enter dates as real date values, not as labels or plain text, and format the Date column to display YYYY-MM-DD. Keep both count columns as whole numbers. Do not add a total row.
Synthetic practice data for Northstar Studio. Each row is one date-and-channel combination.
| Date | Channel | Sessions | Sessions with key event |
|---|---|---|---|
| 2025-06-01 | Organic Search | 100 | 10 |
| 2025-06-01 | 20 | 4 | |
| 2025-06-01 | Organic Social | 80 | 4 |
| 2025-06-02 | Organic Search | 120 | 12 |
| 2025-06-02 | 30 | 6 | |
| 2025-06-02 | Organic Social | 100 | 5 |
| 2025-06-03 | Organic Search | 80 | 8 |
| 2025-06-03 | 40 | 8 | |
| 2025-06-03 | Organic Social | 120 | 6 |
| 2025-06-04 | Organic Search | 200 | 10 |
| 2025-06-04 | 10 | 2 | |
| 2025-06-04 | Organic Social | 100 | 5 |
Tip
Use the channel labels exactly: Organic Search, Email, and Organic Social. Small label differences, such as “Organic search” or extra spaces, can split one channel into separate groups later.
Before using the sheet, check its field roles. A date must remain a date so records can be organized by time. Channel is descriptive text. The two count fields must be numeric values, not numbers stored as text.
This source deliberately contains counts only. Do not add a precomputed percentage column: rates need to be calculated from the relevant grouped counts later.
Use this structure when reviewing the columns in your Sheet.
| Field | Stored as | Role |
|---|---|---|
| Date | Actual date value | Time dimension |
| Channel | Text | Channel dimension |
| Sessions | Numeric whole number | Session count |
| Sessions with key event | Numeric whole number | Key-event session count |
Warning
Keep the grid plain: no merged cells, embedded subtotals, blank separator rows, or duplicate Date + Channel records. A recorded 0 means the value was observed as zero. A blank means the value is missing or unknown; do not silently treat it as zero.
For every row, Sessions with key event must be zero or greater and must not exceed Sessions. The supplied rows meet that check.
Match each field or table condition to its required type, role, or consequence.
Tap an item and then its matching pair.
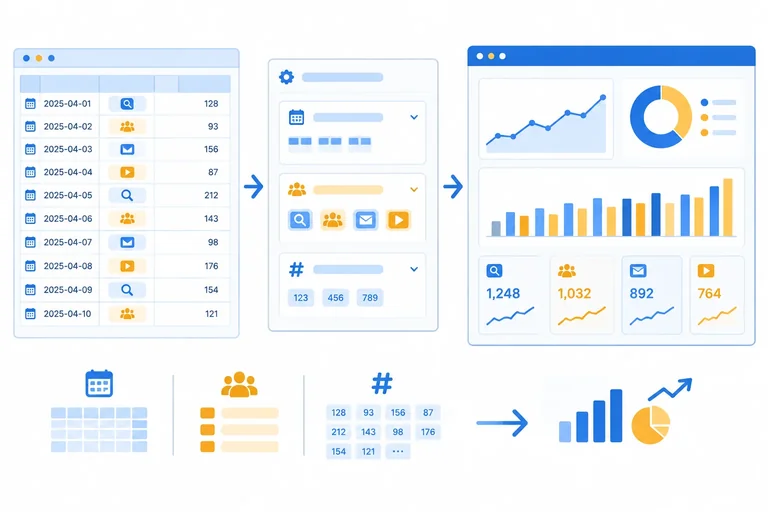
Step 3 of 9
Connect the practice sheet through Looker Studio’s free Google Sheets connector and verify the field settings needed for reliable count-based charts.
Before connecting, confirm that you can open the Google Sheet Northstar Studio - Dashboard Practice and its Daily channels worksheet. Also sign in to Looker Studio with a Google account that can create a report.
Builder route: If you have access, create a blank report named Northstar Studio - Acquisition Review.
Observation-only route: If you cannot open the Sheet, authorize the connector, or create a report because of account or organization restrictions, continue with this step’s diagram, field settings, and sequencing practice. You can record the expected setup without claiming that you created a live connection. Ask a Sheet owner or administrator for access only if you later want to build the report.
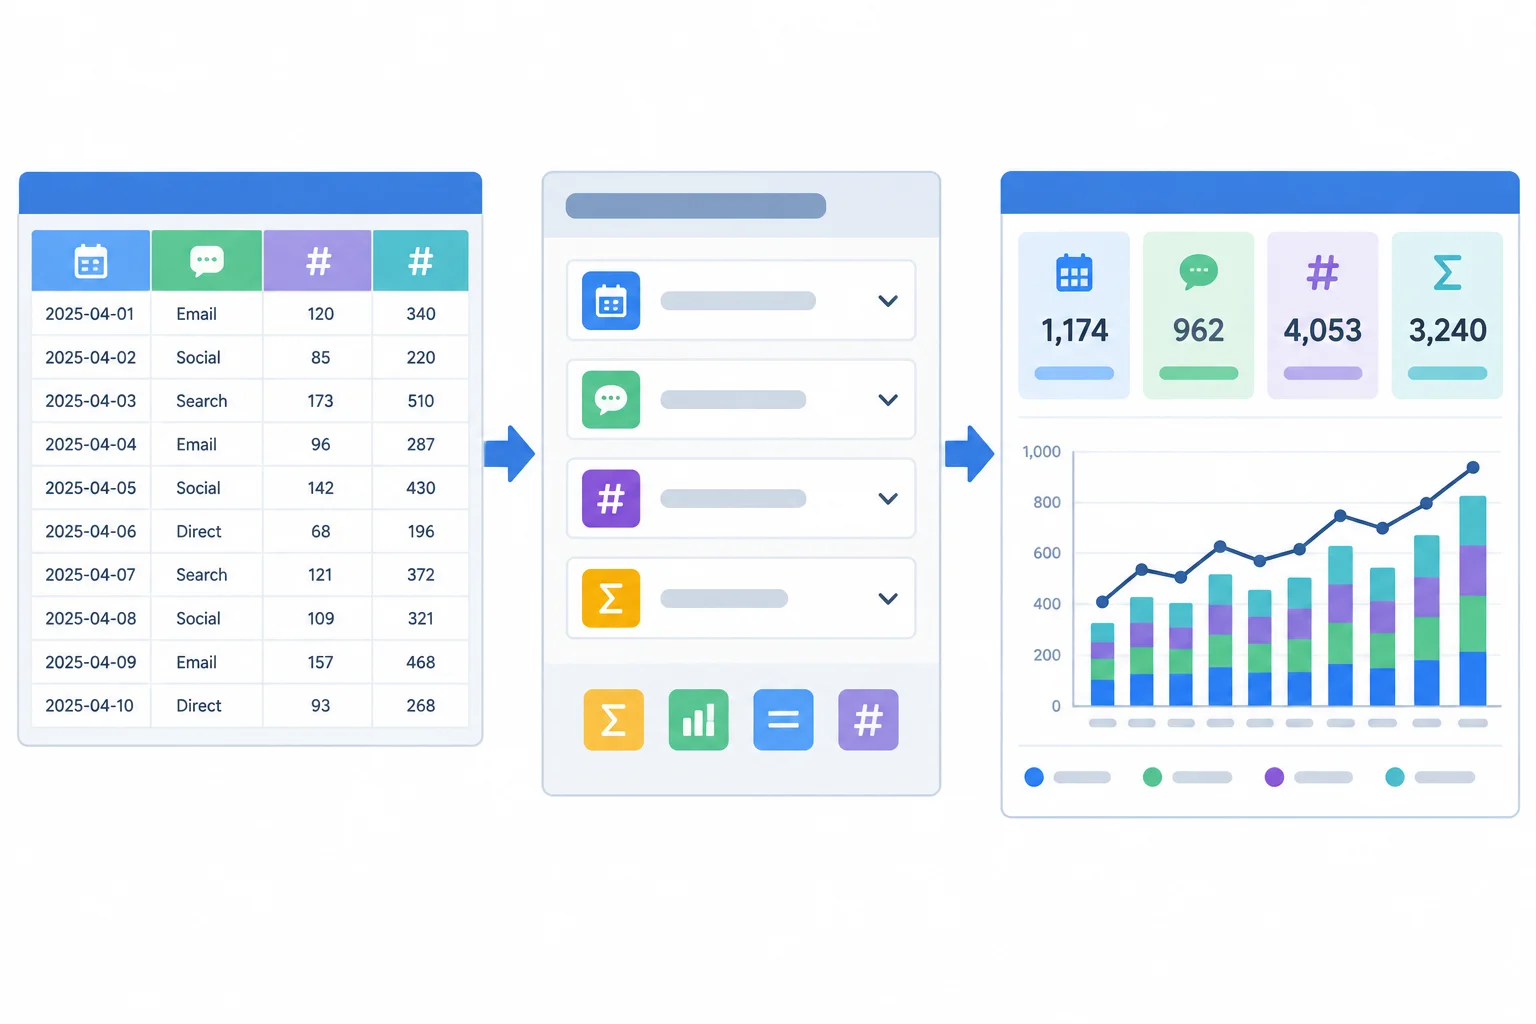
The worksheet supplies rows; the connected data source interprets fields; the report displays charts.
Builder route: In Looker Studio, choose Add data and select the free Google Sheets connector. Authorize access if prompted. Select Northstar Studio - Dashboard Practice, then choose the Daily channels worksheet. Confirm that the first row is used as headers, then add the data to your report.
Interface wording can vary slightly, but the choices should correspond to the spreadsheet, worksheet, and header row.
Observation-only route: Record this intended connection sequence: Google Sheets connector → Northstar Studio - Dashboard Practice → Daily channels → first row as headers. Do not state that the source was connected unless you completed it in your own account.
Tip
An existing source is suitable only when it has compatible date-and-channel detail and a genuine numerator for sessions containing one or more inquiry submissions. If you use one, validate it against its own records—not against this tutorial’s synthetic practice totals.
After connecting, open the data source field list before creating charts. Looker Studio detects field types, but detection is not proof.
Builder route: Inspect the detected fields in your connected data source and correct any mismatch.
Observation-only route: Use the required settings below as your field-settings specification. They describe what a correctly connected practice source must show before charts are built.
Use these settings for the practice source.
| Field | Role and type | Aggregation |
|---|---|---|
| Date | Dimension · Date | Not applicable |
| Channel | Dimension · Text | Not applicable |
| Sessions | Metric · Number | Sum |
| Sessions with key event | Metric · Number | Sum |
Warning
Fix a field before relying on a chart. A Date detected as text cannot drive date behavior correctly. A count detected as text cannot be summed reliably. Set both count metrics to Sum; do not use an average for these row-level counts.
If you are observing only, identify these as required corrections in your setup notes rather than attempting a live edit.
Put the connection and inspection tasks in the only workable order before building charts. This sequence also identifies the source settings that must be corrected if detection is wrong.
Step 4 of 9
Create a calculated Session key-event rate that stays valid when the underlying rows are grouped or filtered.
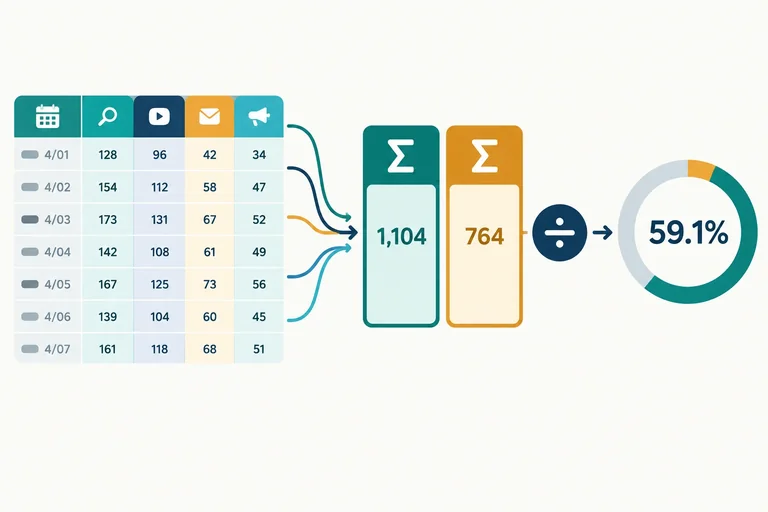
A rate must be calculated from counts that belong to the same slice of data. For this dashboard, divide the total Sessions with key event by the total Sessions.
Create this as a reusable data-source metric, not as a manually typed percentage. When a chart groups rows by Channel or shows a subset of dates, Looker Studio can recalculate both totals for that same set of rows before dividing.
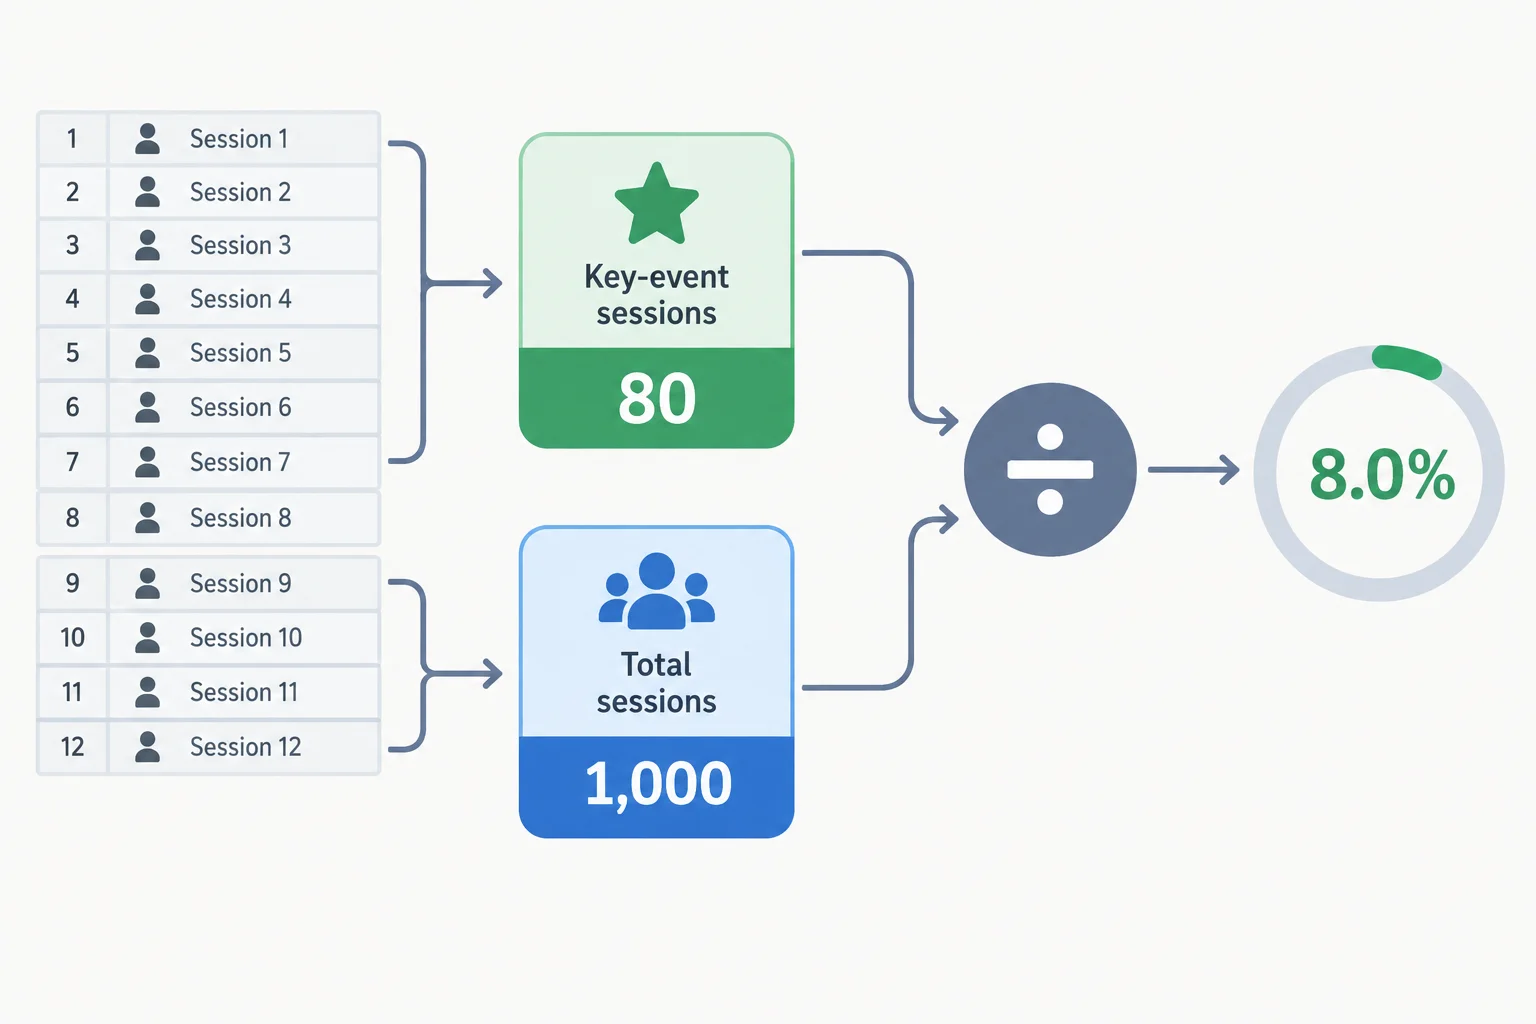
For all 12 practice rows, aggregate first: 80 ÷ 1,000 = 8.0%.
In the connected data source, add a calculated metric. Set its field name to Session key-event rate, then paste only this expression into the formula editor.
SUM(Sessions with key event) / SUM(Sessions)8.0%
Expected result when the full 12-row practice dataset is included and the field is formatted as Percent.
Use these settings after saving the metric.
| Setting | Value | Why |
|---|---|---|
| Field name | Session key-event rate | Matches the dashboard measure |
| Display type | Percent | Shows a decimal ratio as a percentage |
| Formula | Ratio of summed counts | Keeps numerator and denominator aligned |
| Aggregation | Auto | Retains the calculated metric behavior |
Do not average the percentage for each source row. Rows have different session volumes, so an unweighted average gives every row the same influence.
With the full practice dataset, the ratio of totals is 80 ÷ 1,000 = 8.0%. The simple mean of the 12 row-level percentages is 11.25%, which is not the dashboard's Session key-event rate.
Two methods can produce different results from the same rows.
| Method | Calculation scope | Full-period result | Use for this rate? |
|---|---|---|---|
| Ratio of totals | All matching key-event sessions ÷ all matching sessions | 8.0% | Yes |
| Unweighted row average | Mean of 12 row percentages | 11.25% | No |
Warning
A rate has no meaningful value when its total Sessions denominator is zero. Treat that result as undefined, not as 0% performance. Every supplied practice row has a positive Sessions value.
Complete the calculated-field expression for Session key-event rate.
SUM() / SUM()Why is an unweighted average of the 12 row-level rates not the correct full-period rate?
Step 5 of 9
Create a focused one-page overview with three readable, verifiable scorecards.
Work in one single-page decision view in the report. Builder route: Open your existing Looker Studio report and rename it exactly Northstar Studio - Acquisition Review before adding scorecards. Observation-only route: Record Northstar Studio - Acquisition Review as the required report name in your dashboard specification; do not claim that you renamed or created a live report.
Place a clear report title at the top, then a compact context area, then a row for three scorecards. Leave uncluttered space below for supporting views you will add later.
Use these context labels exactly:
Replace the final placeholder with the date you actually checked the source. Coverage describes dates available in the source; it does not describe a viewer-selected reporting period.
Use a simple reading path: title and context first, then the three decision measures. Alignment makes the cards read as one set rather than unrelated widgets.
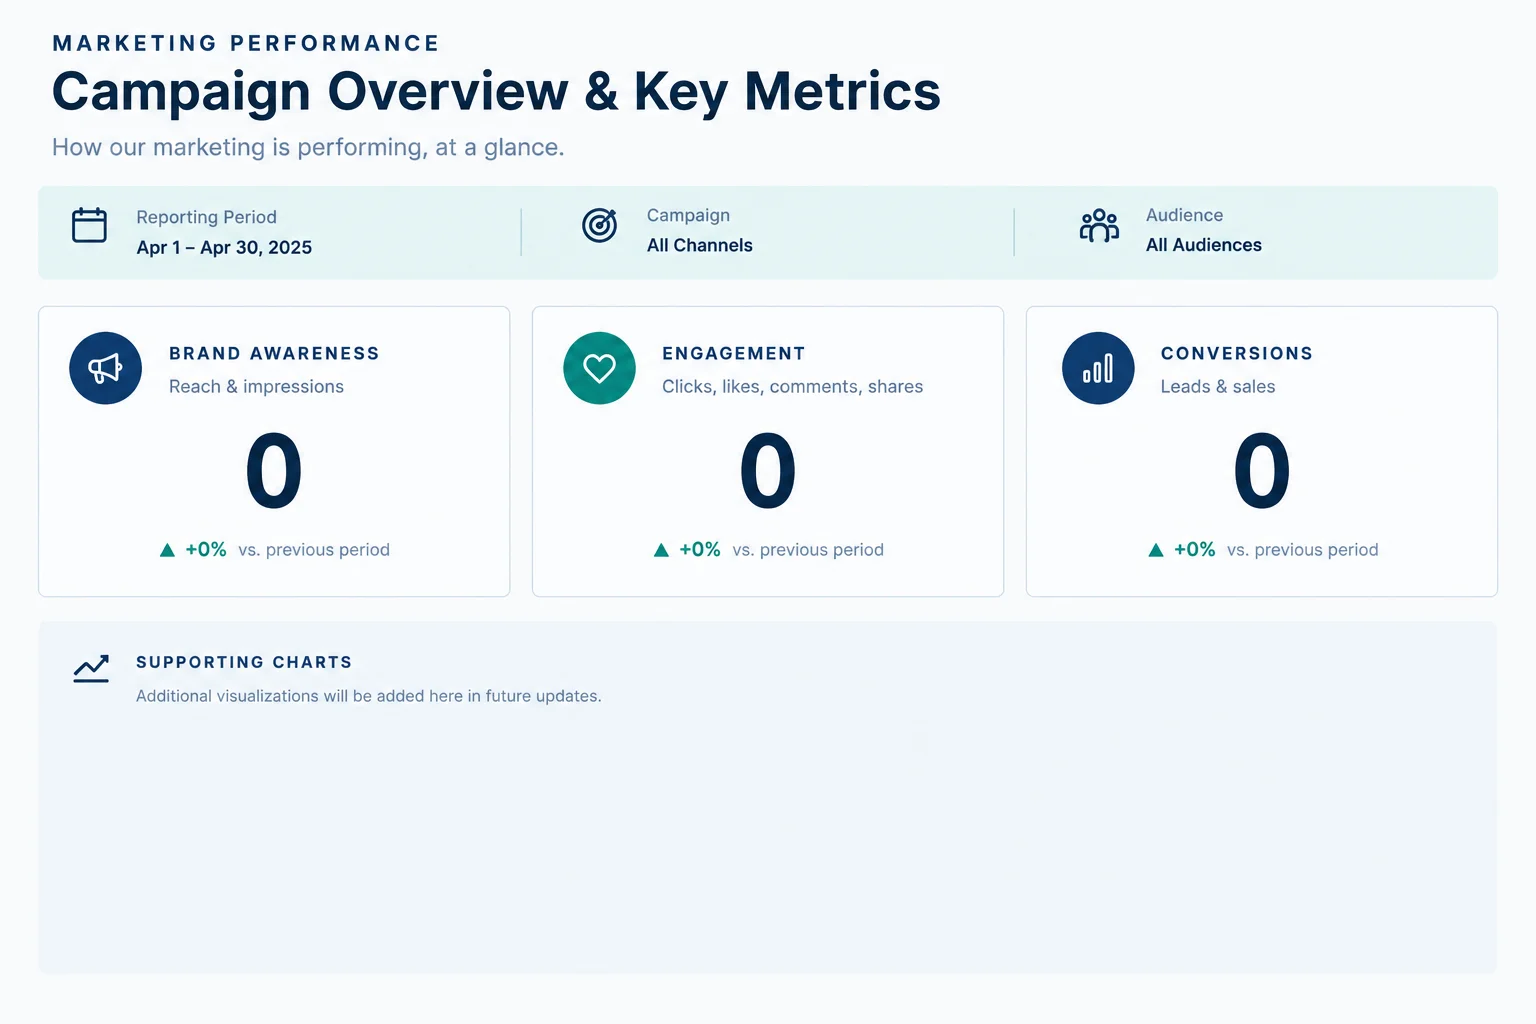
The scorecards should be the first numerical information a marketing lead can scan.
Add three scorecards in one aligned row. Configure them with these exact metric labels:
Builder route: Configure the cards in your report to show the complete four-day practice coverage for this initial build. If an automatic recent-date setting excludes the practice rows, set the cards’ current range to include 2025-06-01 through 2025-06-04 for this initial check. A later step will add the interactive control and replace any conflicting fixed chart range.
Observation-only route: Record these three scorecards and the full four-day coverage as the required initial configuration. You are specifying expected behavior, not testing a live report.
Do not add a prior-period comparison, change arrow, or “up/down” color indicator. The practice source has no comparison period that supports one.
Tip
Format Sessions and Sessions with key event as whole numbers with English thousands separators. Format Session key-event rate as a percentage with one decimal place. Keep the calculated metric’s normal aggregate behavior.
Avoid compact displays such as “1K.” They save little space here and make source validation less transparent. Use adequate contrast between labels, values, and the page background; do not rely on color alone to distinguish cards.
Use a strong title, readable metric labels, and restrained color. Color can organize the page, but it should not imply that a value is good or bad without a defined benchmark. Keep the cards equal in size and aligned so the marketing lead can scan the three related measures before looking at supporting charts.
Select the schematic overview that follows the build guidance.
Example
For the complete four-day practice coverage, the expected initial scorecards are:
Builder route: Inspect your three scorecards and compare their labels, units, and values with these benchmarks. A mismatch is a prompt to check the card metric, number format, or underlying source and calculation before treating the dashboard as decision-ready.
Observation-only route: Use these as expected benchmarks for your dashboard specification. Mark live display behavior as not tested; do not claim that scorecards displayed these values.
Compare your overview with the full-period benchmark from the previous screen.
Builder route: Record whether your live scorecards match, including each metric label and displayed value.
Observation-only route: Record the required scorecard configuration and state that live display behavior is not tested. Do not claim that you viewed live scorecards.
Write at least 20 characters (0/20).
Step 6 of 9
Build complementary trend and channel-comparison views that keep inquiry-session rates connected to their supporting counts.
A trend chart and a channel table answer different questions.
Use a trend to ask: When did recorded inquiry-session volume change? It shows Sessions with key event across dates.
Use a channel table to ask: How do channels compare in volume and rate? It keeps Sessions, Sessions with key event, and Session key-event rate together so that a high percentage is not viewed without its supporting counts.
The four synthetic dates demonstrate chart behavior. They do not establish a durable trend, explain why channels differ, or justify a spending change.
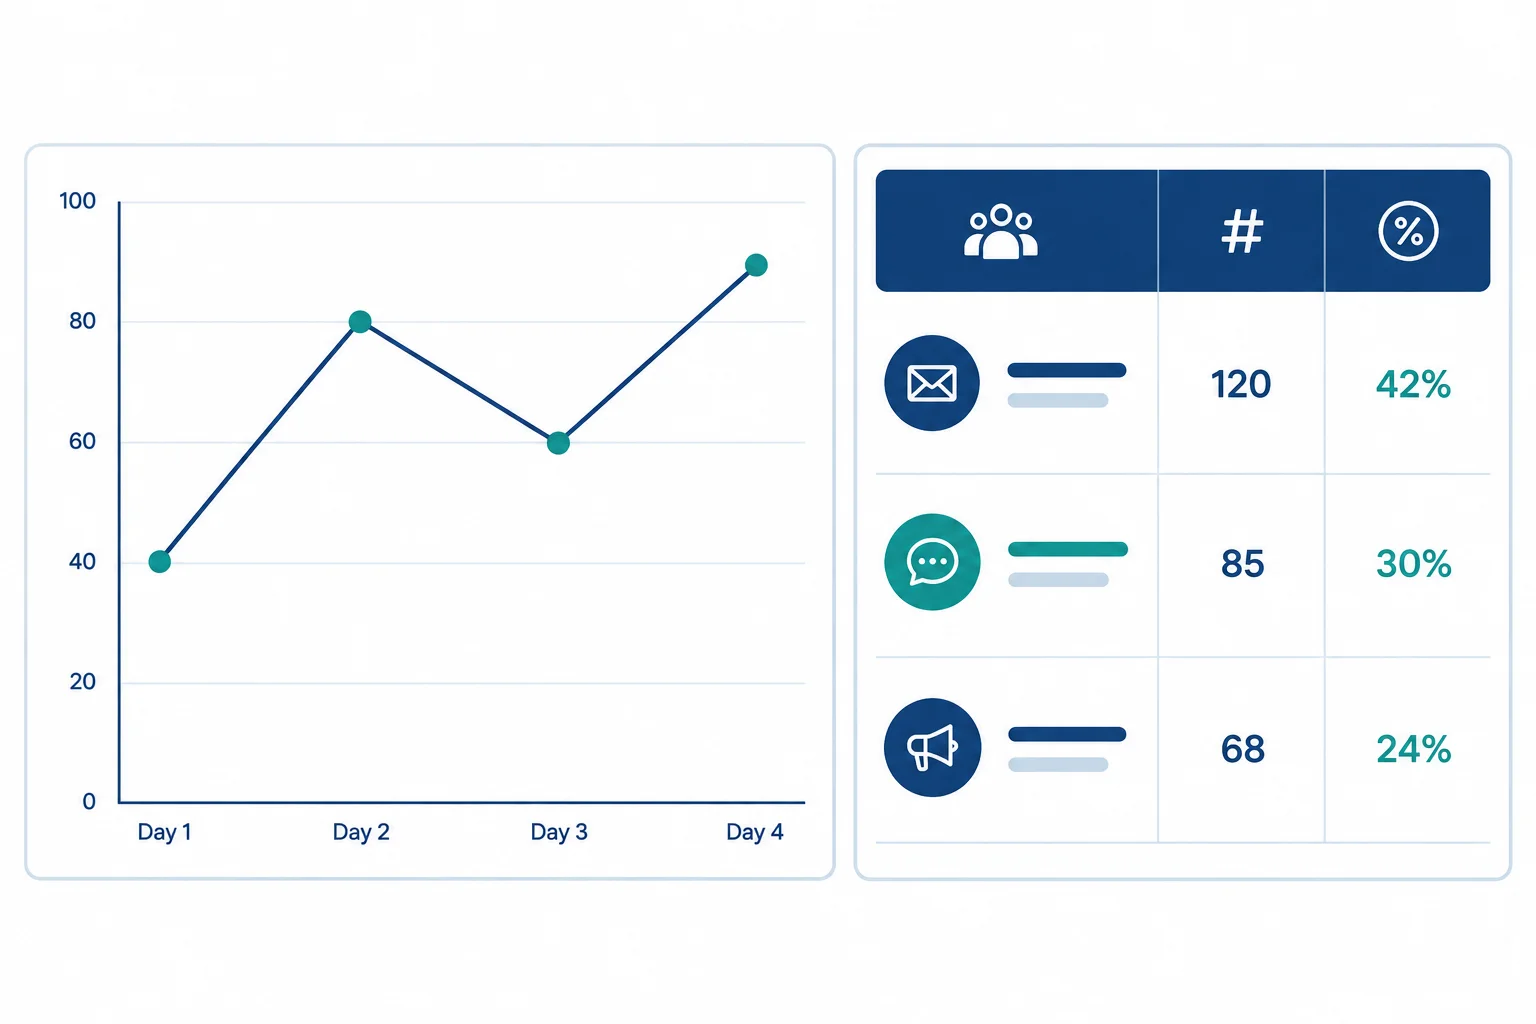
The line chart organizes inquiry-session volume by date; the table places each channel's volume and rate side by side.
Builder route: Add a Time series chart to your report. In Setup, choose Date as the dimension and Sessions with key event as the metric. Sort by Date in ascending chronological order. Set the chart title exactly to Sessions with key event by date.
Observation-only route: Record that same configuration in your dashboard specification. Use the preview on this screen to interpret the expected chart; do not claim that you created or tested a live chart.
A line can help the marketing lead locate a change in recorded inquiry-session volume. It does not identify the cause of that change.
Builder route: Add a Table chart. Choose Channel as its dimension and add all three metrics: Sessions, Sessions with key event, and Session key-event rate. Initially sort by Sessions in descending order. Set the chart title exactly to Channel comparison.
Observation-only route: Record this table configuration and title in your dashboard specification. The figures below are an expected full-period preview, not evidence from a live report.
Keep the supporting counts beside the rate. Do not rank channels by percentage alone.
Use these configurations for the initial full practice-data view. Date-control configuration and full dashboard validation come next.
| View | Dimension | Metrics | Initial sort |
|---|---|---|---|
| Time series | Date | Sessions with key event | Date ascending |
| Channel comparison | Channel | Sessions; Sessions with key event; Session key-event rate | Sessions descending |
These values summarize all four synthetic dates. Builders can compare them with their charts as an informal setup check. Observation-only learners should treat them as the expected textual preview and mark live behavior as not tested.
| View | Date or channel | Sessions with key event | Other displayed measures |
|---|---|---|---|
| Time series | 2025-06-01 | 18 | — |
| Time series | 2025-06-02 | 23 | — |
| Time series | 2025-06-03 | 22 | — |
| Time series | 2025-06-04 | 17 | — |
| Channel comparison | Organic Search | 40 | 500 Sessions; 8.0% |
| Channel comparison | Organic Social | 20 | 400 Sessions; 5.0% |
| Channel comparison | 20 | 100 Sessions; 20.0% |
Match each chart statement to its correct question or configuration.
Tap an item and then its matching pair.
Write three short lines using your completed report or the expected preview from the previous screen.
Builder route: Describe what your report displays.
Observation-only route: Describe the expected preview and state that live chart behavior was not tested. Do not claim why the difference exists.
Write at least 180 characters (0/180).

Step 7 of 9
Add a date-range control to the dashboard and set its initial selection to 2025-06-01 through 2025-06-04. This is the selected reporting period: it determines which source rows are currently included.
For each intended scorecard, the time series, and the channel table, use Date as the date-range dimension and let the chart inherit the control. Do not leave a chart on a conflicting custom or fixed range. The channel table should still use Channel as its displayed dimension; Date governs its filtering.
Builder route: configure and inspect these settings in your report. Observation-only route: record this as the required configuration; do not claim that a live chart was tested.
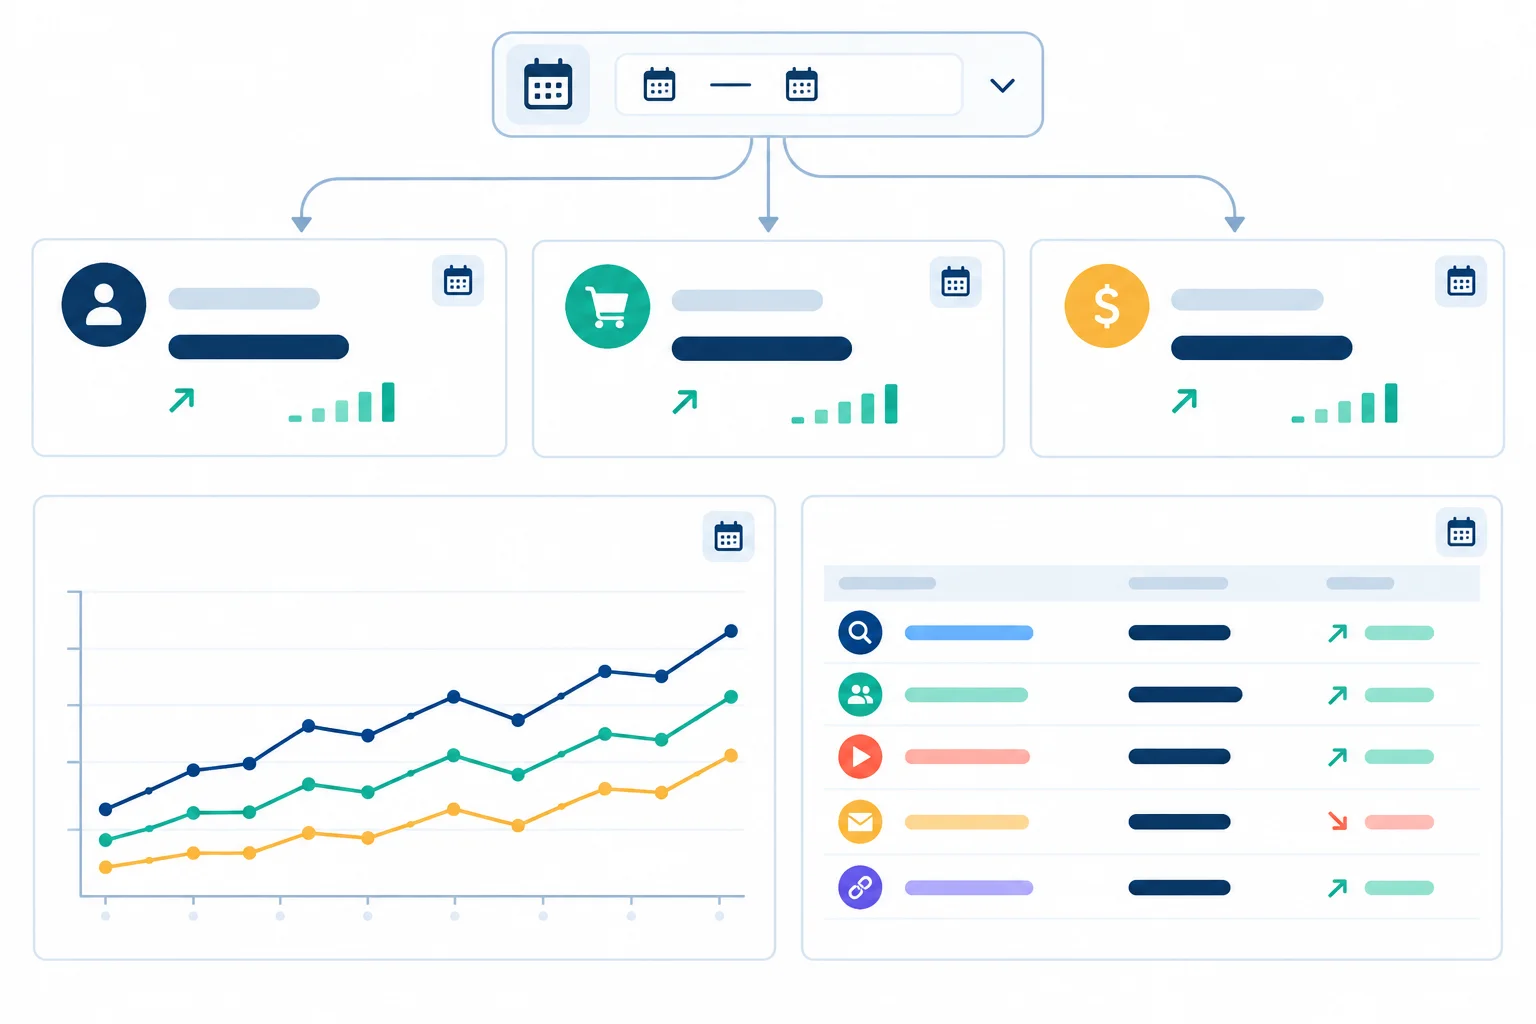
The date control filters every intended chart through the Date field.
Tip
Keep stable source context separate from the control. Display these labels exactly:
Replace the final placeholder with the date you actually checked the source rows. Coverage describes the dates available in the Sheet. The visible date control describes the period currently selected in the report; it may be narrower than the four-day coverage.
With the full four-day range selected, validate the scorecards and channel table against these benchmarks. Counts should display as whole numbers with English thousands separators, and the rate should display to one decimal place. The rate remains the ratio of summed counts, not an average of row or channel percentages.
Builder route: compare the displayed values with the benchmarks. Observation-only route: record these as the expected values for a correctly configured report and mark live display behavior as not tested.
Expected scorecard values for the complete practice-data coverage.
| Metric | Expected value | Check |
|---|---|---|
| Sessions | 1,000 | Sum of all session rows |
| Sessions with key event | 80 | Sum of all key-event session rows |
| Session key-event rate | 8.0% | 80 / 1,000 |
Expected totals by channel for the same full reporting period.
| Channel | Sessions | Sessions with key event | Session key-event rate |
|---|---|---|---|
| Organic Search | 500 | 40 | 8.0% |
| 100 | 20 | 20.0% | |
| Organic Social | 400 | 20 | 5.0% |
Now change the control to 2025-06-03 through 2025-06-04. The scorecards, time series, and channel table should all respond. The expected overall values are 550 Sessions, 39 Sessions with key event, and a 7.1% Session key-event rate.
Builder route: test the range in your report, then restore 2025-06-01 through 2025-06-04. Observation-only route: record the filtered values and the expected behavior that all intended charts respond; mark live behavior as not tested. Record the full four-day range as the intended restored selection.
Start with the symptom you observe rather than changing several settings at once.
| Observed issue | First check |
|---|---|
| Totals are too high | Look for duplicate Date + Channel rows in the Sheet. |
| A count does not sum | Check source entry and that the count field uses Sum. |
| A chart ignores the control | Check its Date range dimension and remove a conflicting fixed range. |
| Dates appear as categories or text | Check that Date is stored and detected as a date field. |
| No rows for a selection | Confirm whether rows exist in that range; do not treat an empty result as 0% performance. |
Tip
The source covers only 2025-06-01 through 2025-06-04 because those are the dates entered in the Sheet. A manual Sheet update can add or change rows. A connector refresh can retrieve changes already present in that connected Sheet, but it cannot create dates that are absent from it.
Record the actual date you last checked the source. That freshness note is different from both source coverage and a viewer's selected reporting period.
Use the 2025-06-03 through 2025-06-04 test period. Write three short lines:
Write at least 80 characters (0/80).

Step 8 of 9
Choose a restricted sharing setup and understand how report permission differs from access to the underlying source.
Sharing has two separate layers.
Report permission determines who can open or edit Northstar Studio - Acquisition Review.
Source permission determines who can directly open the Google Sheet Northstar Studio - Dashboard Practice and its Daily channels worksheet.
Giving someone report viewer access does not automatically give them access to the Sheet. Likewise, someone with Sheet access does not automatically get access to the report.
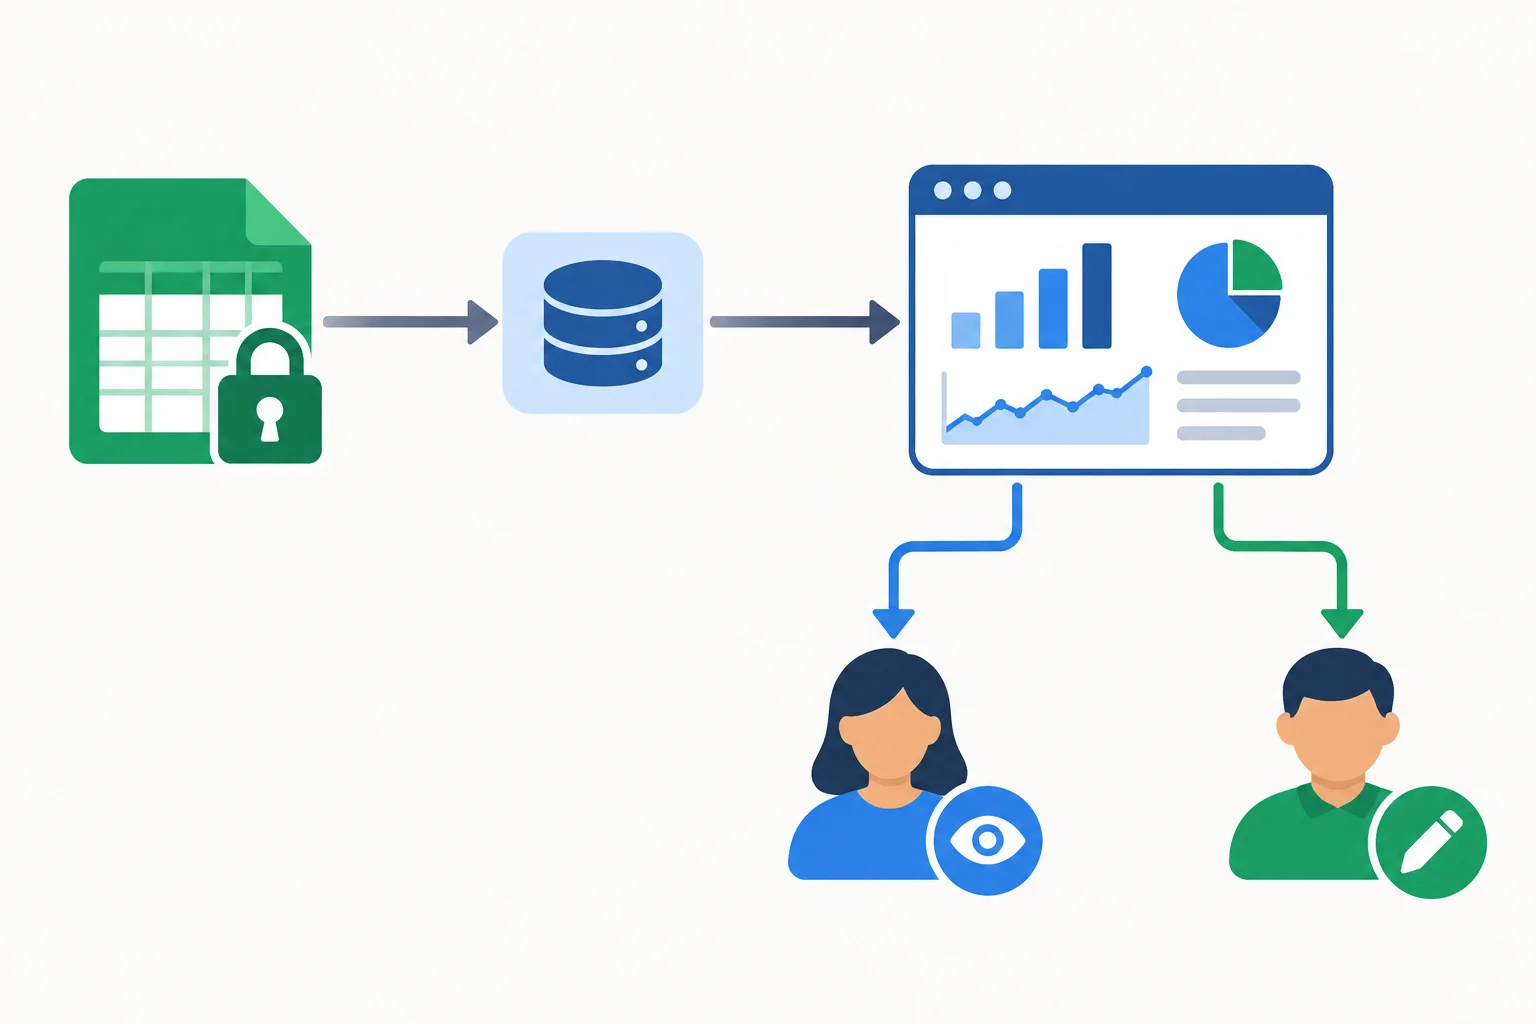
Treat access to the report and direct access to the Sheet as two settings to review separately.
A data source can use different credential behavior, depending on the options available in your account or organization.
With owner's credentials, authorized report viewers can see source-backed report results without needing direct access to the Google Sheet. They still need permission to open the report.
With viewer's credentials, each viewer must have their own permission to access the underlying Sheet. A viewer who lacks that source permission may not see the report data.
Check the data source settings rather than assuming a mode is available: organization policy can limit credential and sharing choices.
Choose a setting based on what the reviewer needs to do, not only on whether the Sheet is private.
| Need | Report permission | Credential behavior | Direct Sheet access |
|---|---|---|---|
| Review dashboard only | Named viewer | Owner's credentials, if available | Not required for report results |
| Review dashboard and inspect rows | Named viewer | Either available mode | Required |
| Change charts or layout | Named editor | Depends on source setup | Only if needed for the task |
For a focused review, share the report only with named recipients and assign Viewer access when they do not need to change charts, controls, or layout. Avoid broad link sharing merely because the practice Sheet is private.
Before sharing, inspect the report as well as the source: confirm that the data is synthetic, that no personal or confidential information appears in chart labels or notes, and that the intended credential behavior is understood.
Warning
A private Sheet does not by itself make a broadly shared report safe. Under owner's credentials, authorized report viewers may be able to see results derived from that Sheet even when they cannot open it directly. Review both sharing settings before inviting anyone.
A marketing lead is a named reviewer of Northstar Studio - Acquisition Review. They need to inspect the dashboard but must not edit it and do not need to open the underlying Google Sheet. Which setup is most appropriate, assuming the option is available?

Step 9 of 9
Present a validated dashboard finding carefully, with an appropriate next check, limitations, and sharing boundary.
Before presenting a result, make one final readiness pass. Your dashboard should answer the marketing lead’s question: “Which acquisition channel deserves the next inquiry-performance check?”
Confirm that the one-page view includes Sessions, Sessions with key event, and Session key-event rate; a date trend; and a channel comparison. Check that the date control changes every intended chart, the visible period is clear, and the displayed values agree with the source rows.
Keep context visible: “Synthetic practice data,” “Data covers: 2025-06-01 to 2025-06-04,” and “Source last checked: [your actual checking date].” Coverage describes what exists in the source; it is not necessarily the selected reporting period.
Summary
Write a short decision note in four parts:
A chart can show a recorded difference. It cannot, by itself, explain why the difference occurred or prove that a channel is superior. With this four-day synthetic dataset, use the result to prioritize an inquiry-performance check—not to declare a cause, change spending, or predict durable performance.
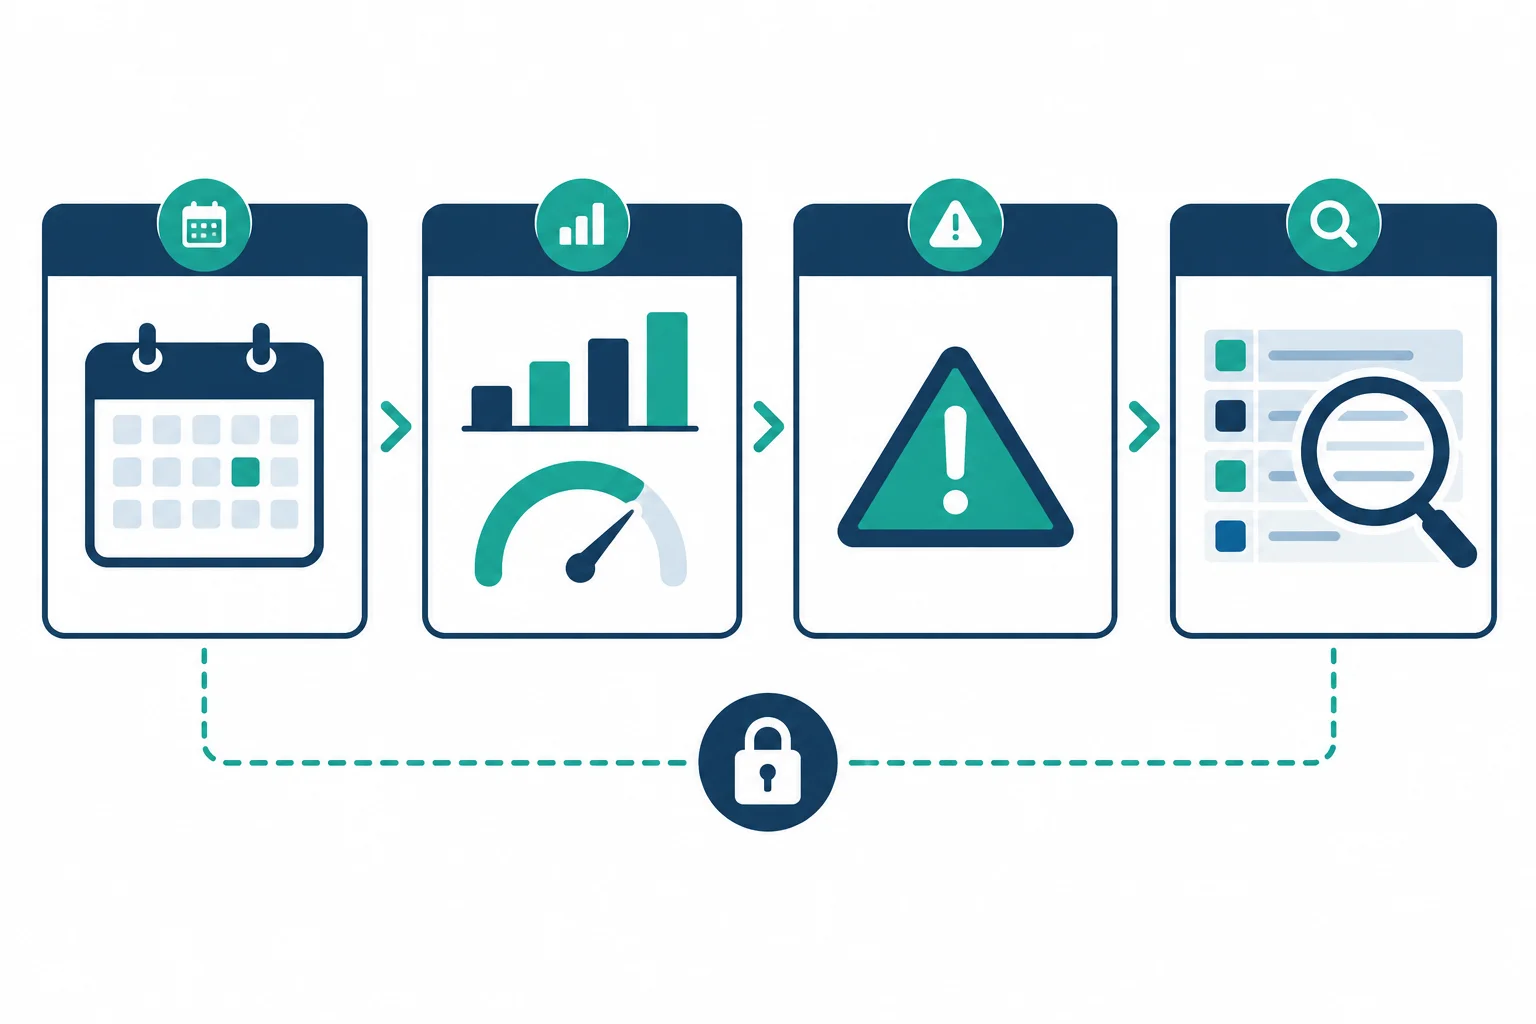
Use evidence and caution together: period → validated observation → limitation → next check → sharing boundary.
Example
Example using the full practice period:
“During 2025-06-01 to 2025-06-04, Email recorded 20 sessions with key event from 100 sessions, a 20.0% Session key-event rate. This is the highest recorded rate in this synthetic four-day dataset, so Email is a sensible channel for the next inquiry-performance check. The data do not establish a cause, real channel superiority, or the effect of a change. Next, check the Email source rows and available channel detail for measurement quality and context. Keep the report private or share it only with named viewers; review source access separately.”
The claim stays within the evidence: it identifies where to look next, rather than claiming why the result happened.
Write your own short decision note for Northstar Studio. Include: the selected reporting period; one validated finding with counts and a rate; one limitation; one next inquiry-performance check; and the intended restriction for sharing the report.
Use only what your dashboard and source support. Do not claim a cause or recommend a spending change.
Write at least 250 characters (0/250).
Congratulations! You completed: Build a Decision-Focused Looker Studio Dashboard
You completed this level!
Up next: Conversion and E-commerce
 Draft a Landing Page That Matches Visitor IntentDraft an annotated landing-page outline that fulfills an incoming message's promise, presents a clear offer, and guides visitors toward one accessible, well-supported action. Practice uses text rather than a live website.
Thousands of online courses in video, ebooks and audiobooks.
To test your knowledge during online courses
Generated directly from your cell phone's photo gallery and sent to your email
Download our app via QR Code or the links below:.



Carry knowledge in your pocket.
Download the Cursa app.
There are hundreds of free courses available, with a free certificate of completion that is saved in your mobile image gallery.
Download the app to access the Course Completion Certificate for Free.

+ 10 million
students

Free and Valid
Certificate

60 thousand free
exercises

4.8/5 rating in
app stores

Free courses in
video and ebooks