
Step 1 of 9
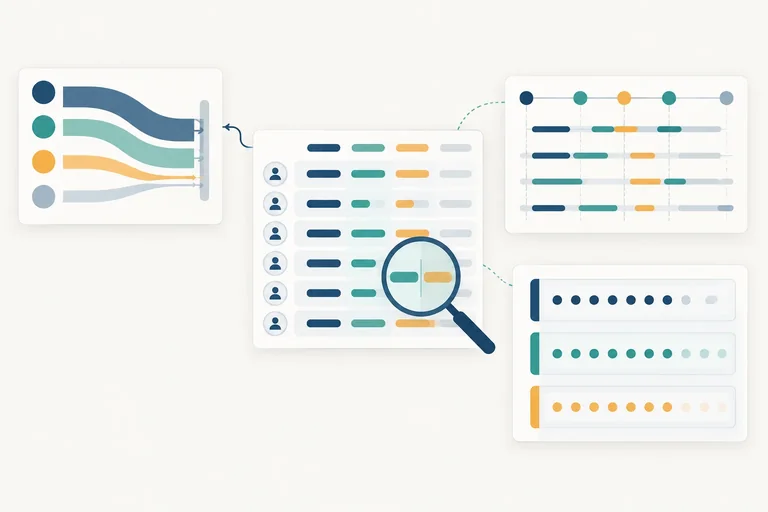
Establish the Report Context
Identify the context, dimensions, and metrics needed to interpret a GA4 report extract.

Learning path · Level 5 · Tutorial 3
Interpret text-based GA4 acquisition, engagement, and key-event reports to explain observed performance. Separate defensible findings from attribution uncertainty and possible tracking problems.
 Establish the Report Context
Identify the context, dimensions, and metrics needed to interpret a GA4 report extract. 2 min
 Choose User or Traffic Acquisition
Select User acquisition or Traffic acquisition by matching first-user and session-scoped questions to the correct report and dimension. 3 min
 Read Channels, Sources, and Campaigns
2 min
 Interpret Engagement Without Mixing Units
Compare user and session units, calculate engagement rates, and interpret engagement time without treating it as proof of business success. 3 min
 Separate Key-Event Counts from Session Rates
Separate recorded `generate_lead` occurrences from the proportion of sessions that contain the selected key event. 3 min
 Make Like-for-Like Comparisons
Compare matched GA4 periods without confusing higher activity volume with a higher session outcome rate. 2 min
 State What Attribution Cannot Prove
3 min
 Triage Report-Quality Warning Signs
Identify report-quality warning signs, frame them as hypotheses, and select evidence that can verify or reject them. 3 min
 Write an Evidence-Based Performance Note
Produce a short, defensible interpretation of supplied acquisition, engagement, and key-event results. 3 min
Step 1 of 9
Identify the context, dimensions, and metrics needed to interpret a GA4 report extract.
A dimension names what each report row describes. A metric is the quantity reported for that row.
For example, a row dimension might group activity by a channel label. Columns such as Sessions or Key events are metrics: they quantify activity associated with each row.
Read the dimension first, then read the exact metric labels. Numbers without those two pieces can be misleading.
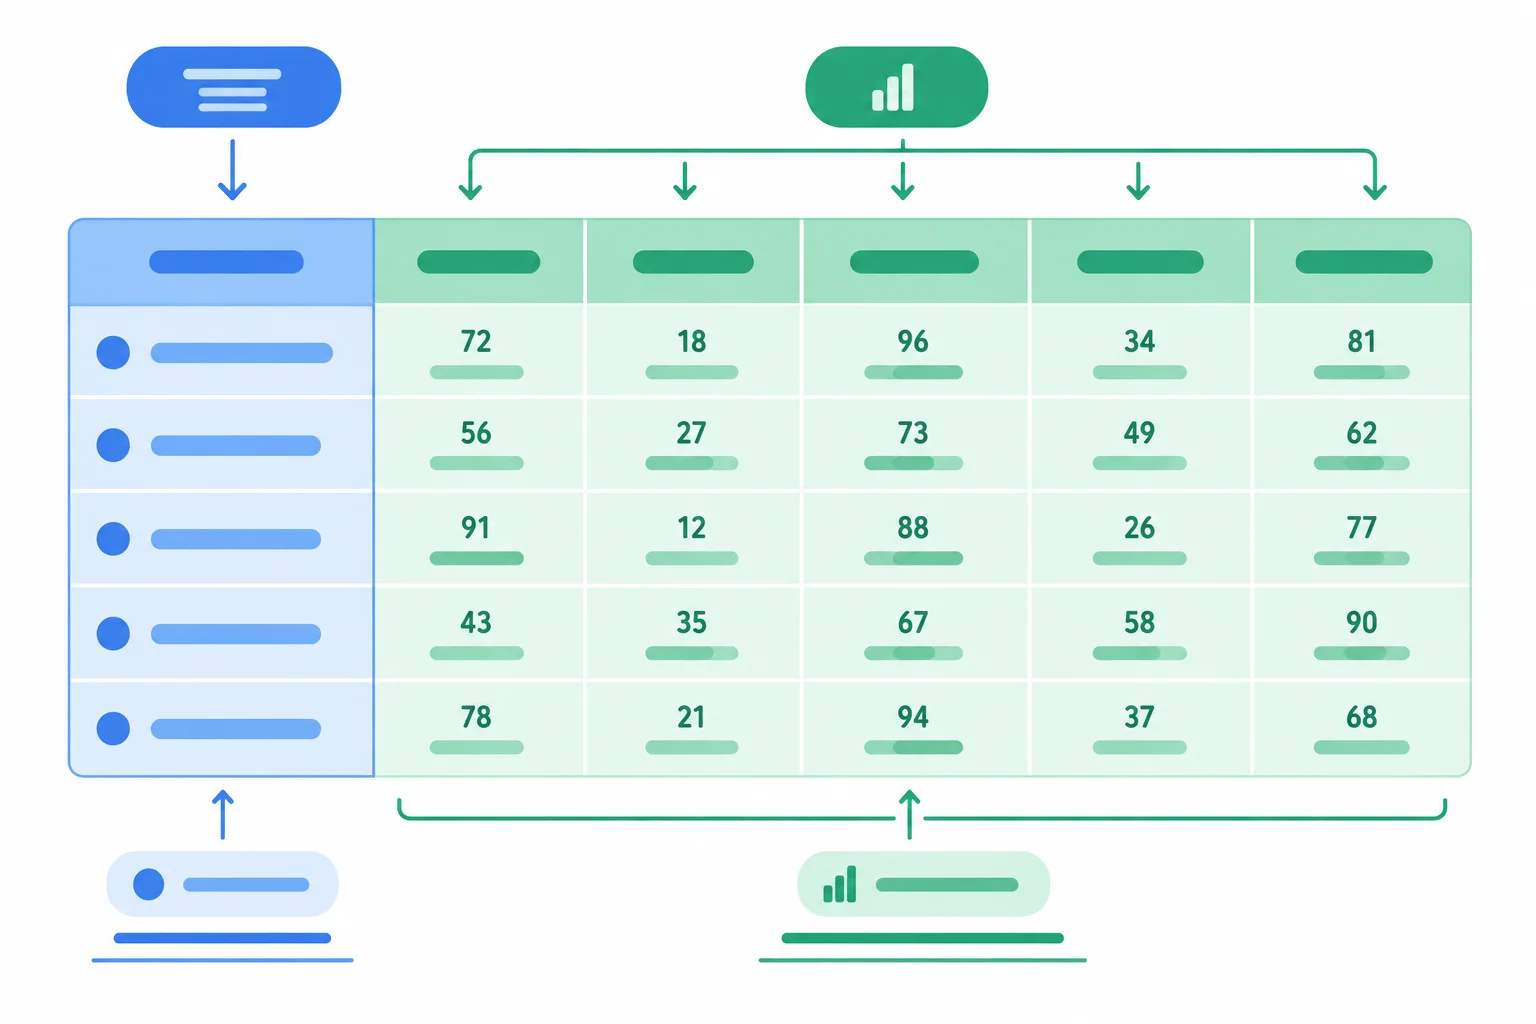
The left-side dimension tells you what a row is about; the metric columns tell you how much activity is associated with it.
Before interpreting a GA4 extract, record its reporting context:
For Harbor Workshops, use complete 14-day periods in UTC: 01–14 Apr 2026 and 18–31 Mar 2026. The case uses the same web-stream scope and no additional filters.
Tip
A comparison selects subsets of observed data, such as one date range versus another. It does not create experimental control groups. A difference in report values can be observed; its cause still needs evidence.
Tip
You can complete every activity in this tutorial from the supplied text extracts. If you choose to inspect a learner-owned GA4 property, standard reports normally require authorized access such as Viewer access or higher. Report collections and navigation can vary by property.
This practice extract deliberately omits its context note. It shows a row dimension and measured quantities, but not the property, dates, time zone, filters, or comparison setup.
Sessions with generate_lead is a supplied practice annotation. Do not assume it is a native column in every GA4 report.
Selected channel rows from a report extract
| Default channel group | Sessions | Engaged sessions | Key events | Sessions with generate_lead | Average engagement time per session |
|---|---|---|---|---|---|
| Organic Search | 1,000 | 600 | 40 | 30 | 45 s |
| 200 | 140 | 30 | 20 | 60 s |
Review the incomplete extract on the prior screen. Which response correctly identifies its structure and the context needed before making a reliable interpretation?

Step 2 of 9
Select User acquisition or Traffic acquisition by matching first-user and session-scoped questions to the correct report and dimension.
Acquisition reports can answer two different origin questions. Choose the report by the unit in the question:
The source label may look the same in both reports, but its scope is different. Read the report name and the dimension before interpreting a row.
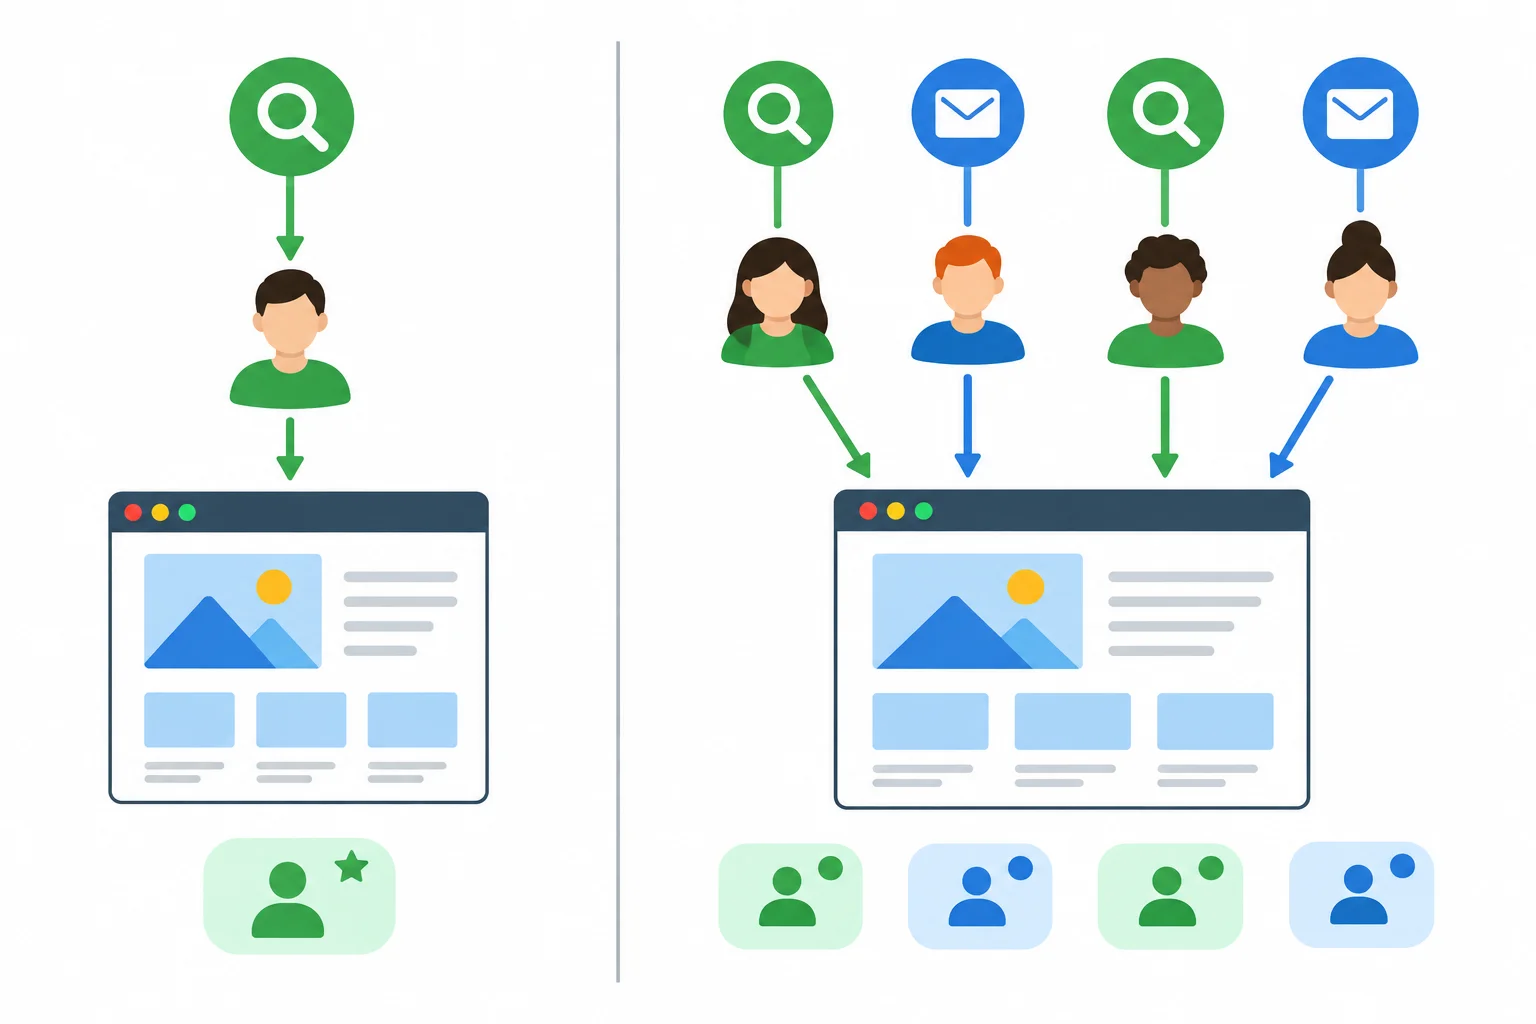
Left: first-user scope. Right: session scope.
Use the report and dimension that match the wording of the question.
| Question asks about… | Use this report | Scoped dimension |
|---|---|---|
| Where users were first acquired | User acquisition | First user source / medium |
| Where a session originated | Traffic acquisition | Session source / medium |
Follow one recognized Harbor Workshops visitor:
In User acquisition, this person remains associated with their first acquisition source: google / organic.
In Traffic acquisition, the first session can be associated with google / organic, while the later return session is associated with newsletter / email. The Email channel describes that later session’s origin, not a replacement for the user's first acquisition source.
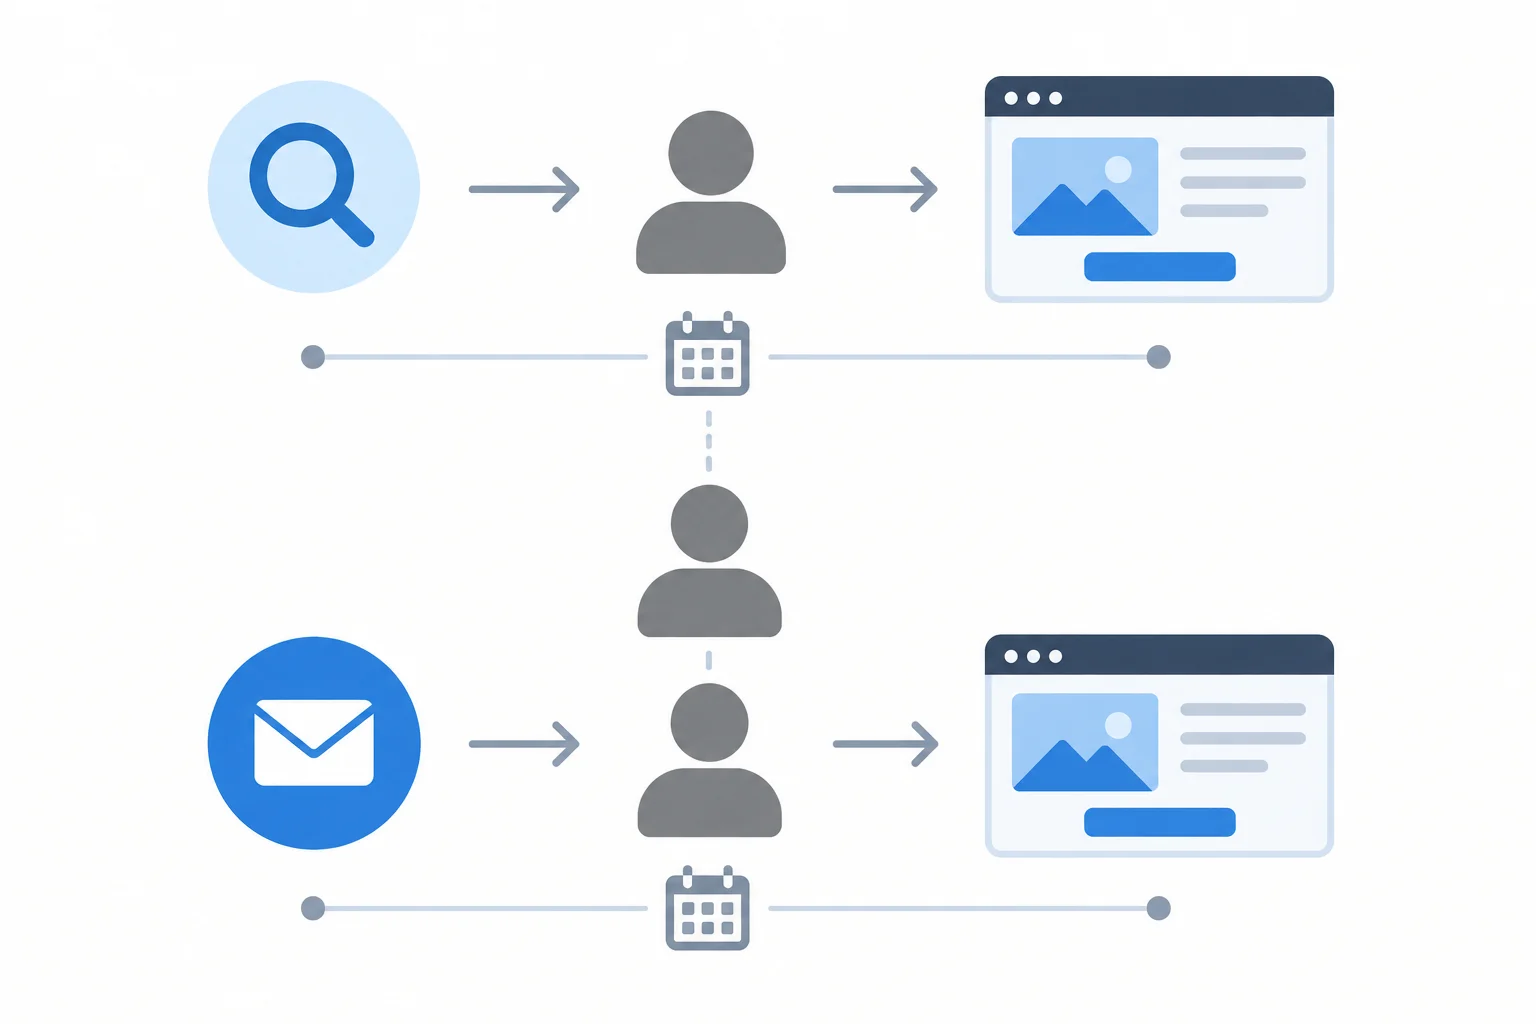
A first-user view retains the original acquisition; a session view can show each arrival route.
Tip
Do not swap these rows as if they answer the same question. A google / organic row under First user source / medium means “users first acquired from Google organic.” The same label under Session source / medium means “sessions that arrived from Google organic.”
Before comparing or describing an acquisition result, state whether it is first-user scope or session scope.
Match each Harbor Workshops question to the report or dimension that answers it.
Tap an item and then its matching pair.
Step 3 of 9
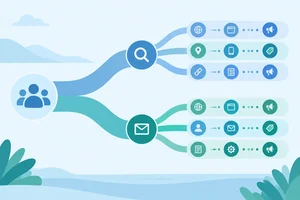
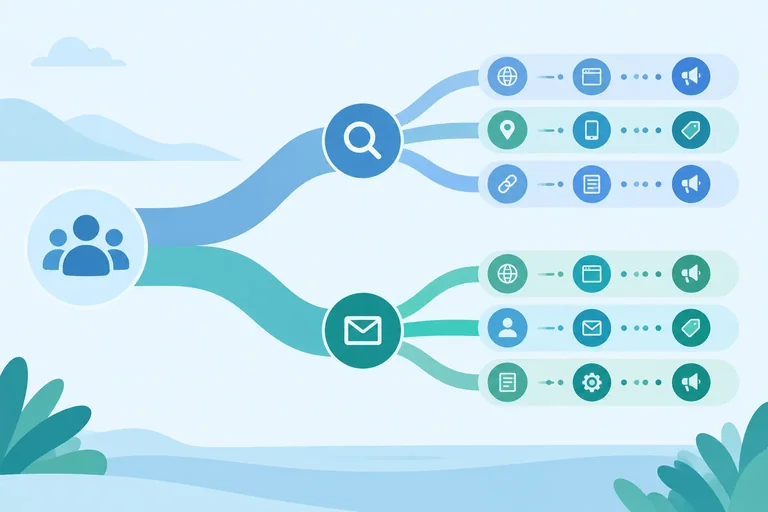
A source identifies the referring origin. A medium describes the traffic mechanism. A campaign identifies a marketing initiative when campaign information is available.
A default channel group is broader: GA4 applies rules to classify traffic into categories such as Organic Search and Email. It is not a campaign label that someone freely assigns.
Use the broad channel view to summarize traffic, then investigate with a compatible source / medium or campaign dimension when the question needs more detail.
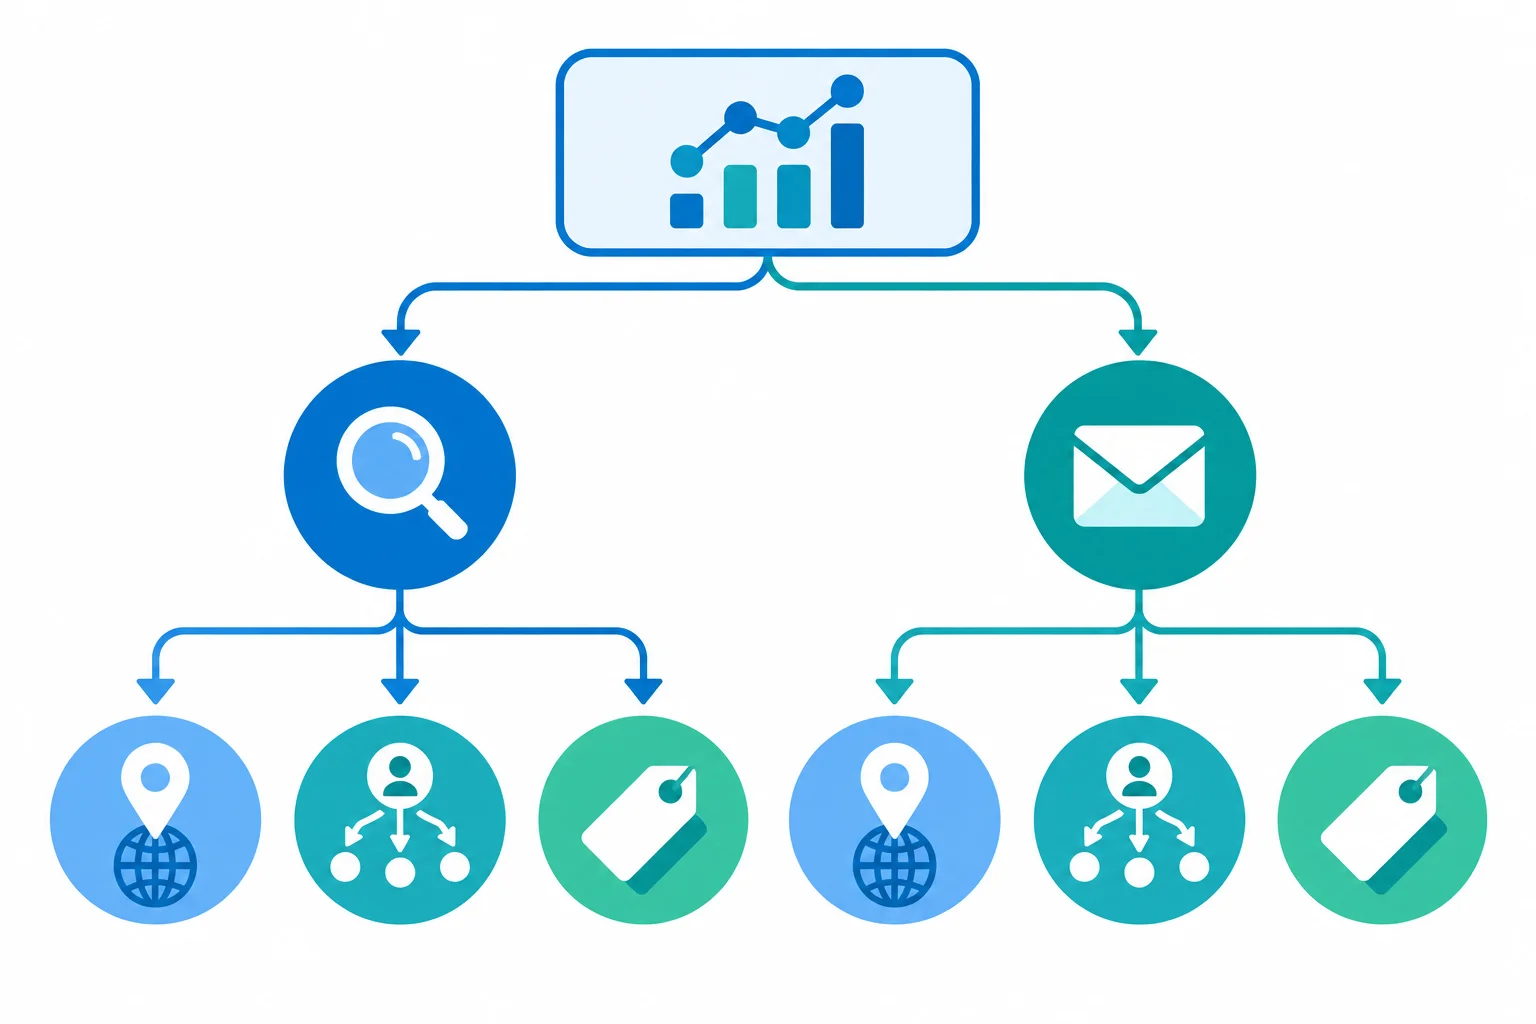
A channel group summarizes rule-based categories; source / medium and campaign views provide more specific acquisition detail.
Keep the scope from the report you selected visible while changing detail. For a session-origin question, use the Session family of dimensions. For an original-acquisition question, use the corresponding First user family.
For the recognized Harbor Workshops visitor, google / organic can remain the first-user origin while a later session is newsletter / email. That later session can also carry the campaign spring_workshops. These labels describe different aspects of acquisition; they are not synonyms.
Read the labels as separate pieces of information:
google / organic, google is the source and organic is the medium.newsletter / email, newsletter is the source and email is the medium.spring_workshops is the campaign name.Organic Search and Email are default channel-group labels: broad, rule-based classifications.A source / medium value combines origin and mechanism in one row label. A campaign dimension answers a different question: which named initiative was recorded.
Choose dimensions from one scope family. The prefixes tell you whether the row concerns an original user acquisition or a particular session.
| Question scope | Broad classification | Origin and mechanism | Initiative |
|---|---|---|---|
| First user | First user default channel group | First user source / medium | First user campaign |
| Session | Session default channel group | Session source / medium | Session campaign |
Match each session-level question to the acquisition dimension that answers it.
Tap an item and then its matching pair.

Step 4 of 9
Compare user and session units, calculate engagement rates, and interpret engagement time without treating it as proof of business success.
Before comparing engagement, identify the unit in each metric. A session is a visit context; one recognized person can start more than one session. An Active user is a distinct user who meets GA4 activity criteria, not a count of visits.
Read the exact user label in a report—such as Active users or Total users—before interpreting it. Do not automatically add user counts across channel rows: the same person may be represented in more than one row.
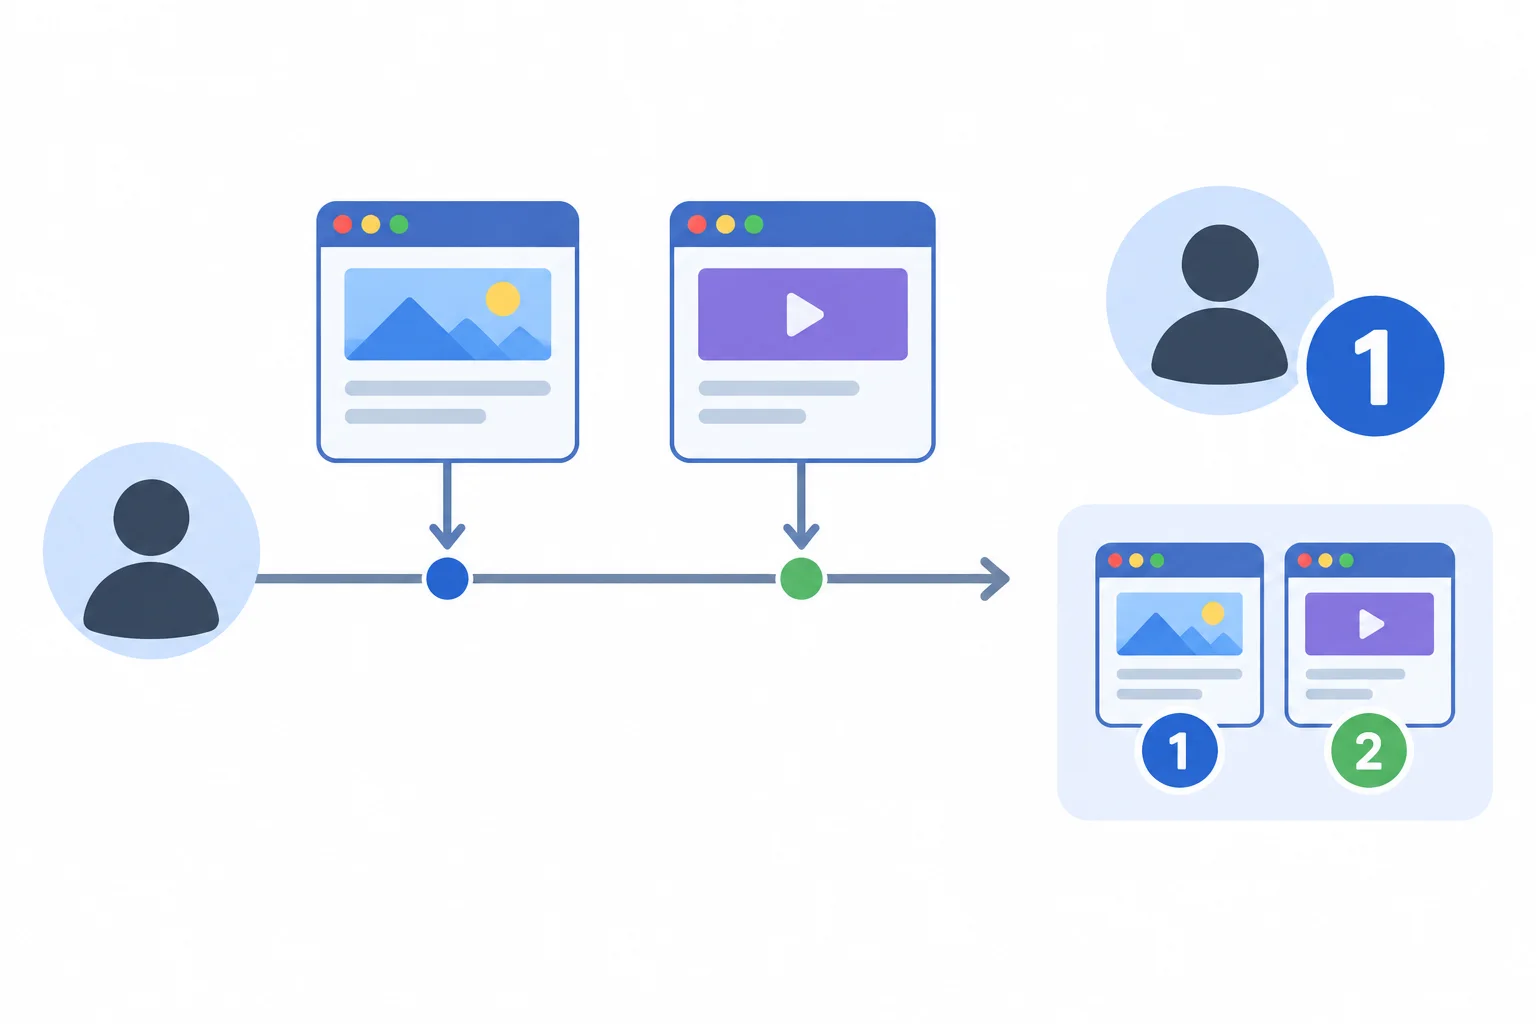
A recognized user may have multiple sessions; user totals are not visit totals.
For Harbor Workshops, a session is engaged when it lasts longer than 10 seconds, contains a key event, or includes at least two page or screen views.
Engagement rate = Engaged sessions ÷ Sessions. It is a proportion of sessions, so compare it with other rates only when the scope and period match.
Average engagement time per session measures focused or foreground activity, not simply elapsed visit duration. Its denominator is sessions. A per-active-user average would use a different denominator, so the two averages are not interchangeable.
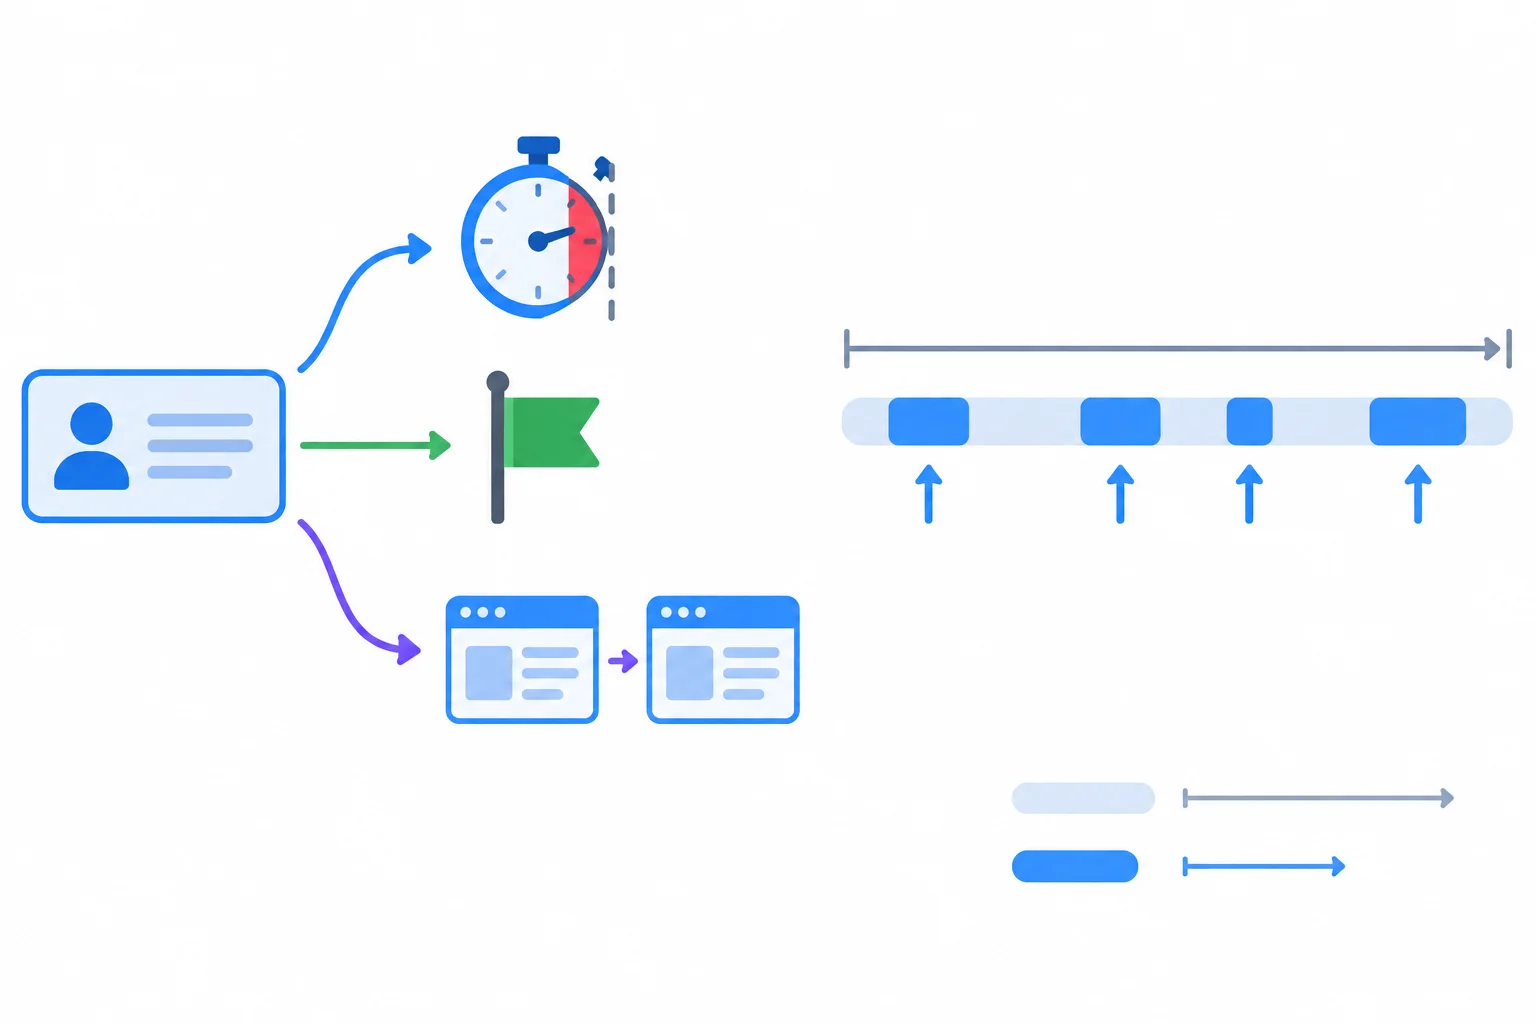
Any one qualifying condition can make a session engaged. Average engagement time counts focused or foreground activity, not all elapsed time.
Current period: 01–14 Apr 2026 in UTC. These are selected channel rows, not property totals.
| Channel | Sessions | Engaged sessions | Key events | Sessions with generate_lead | Average engagement time per session |
|---|---|---|---|---|---|
| Organic Search | 1,000 | 600 | 40 | 30 | 45 s |
| 200 | 140 | 30 | 20 | 60 s |
Tip
Higher engagement can be useful evidence of audience activity, but it does not independently prove lead quality, revenue, or business success.
A recognized visitor first arrives through Organic Search and later returns through the spring_workshops email campaign. How should this short timeline be counted?
Organic Search recorded 600 Engaged sessions from 1,000 Sessions. Its engagement rate is ___.
Email recorded 140 Engaged sessions from 200 Sessions. Its engagement rate is ___.
True or false: A channel with longer Average engagement time per session automatically produces better business outcomes.

Step 5 of 9
Separate recorded generate_lead occurrences from the proportion of sessions that contain the selected key event.
Key events is an occurrence count for designated actions. In this case, it means recorded generate_lead occurrences, using the established Once per event counting method.
A session can contain more than one recorded occurrence. If one visitor submits two successful workshop inquiries during one session, that contributes 2 key events but only 1 session containing generate_lead.
Do not substitute an all-events count for a business-outcome count. All events can include routine interactions that are not workshop inquiries.
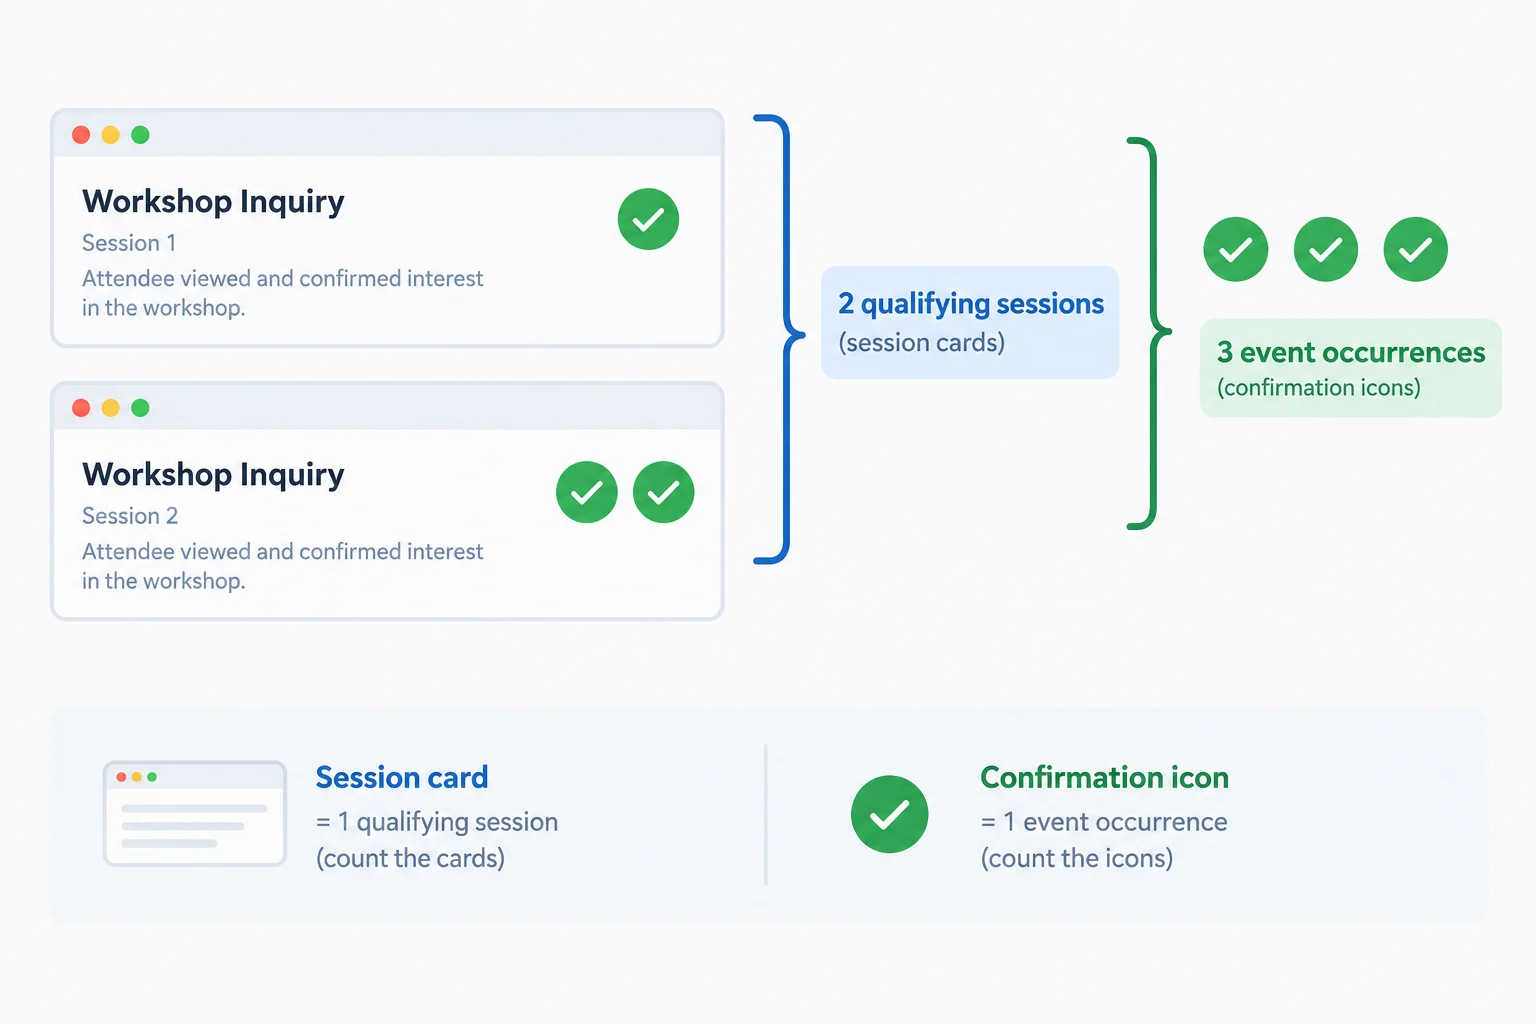
Repeated occurrences raise the key-event count without necessarily raising the number of qualifying sessions.
To compare an outcome across acquisition rows, use the same session scope for both parts of the rate:
Session key event rate = Sessions containing at least one generate_lead / Sessions
The numerator counts each qualifying session once, even if it contains repeated generate_lead occurrences. The denominator is all sessions in the same row and period.
Use an event-level extract when the question is about recorded occurrences. Use a compatible acquisition extract when the question is about session outcomes by channel. A property does not need to expose a standalone report named Key events for either question to be answerable.
Selected channel rows for 01–14 Apr 2026 in UTC. Sessions with generate_lead is a supplied practice annotation, not a promised native GA4 report column.
| Channel | Sessions | Engaged sessions | Key events | Sessions with generate_lead | Average engagement time per session |
|---|---|---|---|---|---|
| Organic Search | 1,000 | 600 | 40 | 30 | 45 s |
| 200 | 140 | 30 | 20 | 60 s |
Which extract is most appropriate for checking how many generate_lead occurrences were recorded during the current period?
For Email, the extract records 30 generate_lead key-event occurrences, 20 sessions containing generate_lead, and 200 total sessions.
Calculate the session key event rate. Then explain in one sentence why 15.0% is not the session key event rate.
Write at least 60 characters (0/60).
Step 6 of 9
Compare matched GA4 periods without confusing higher activity volume with a higher session outcome rate.
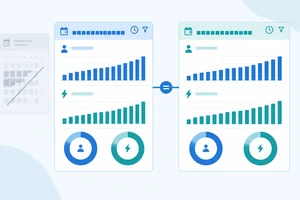
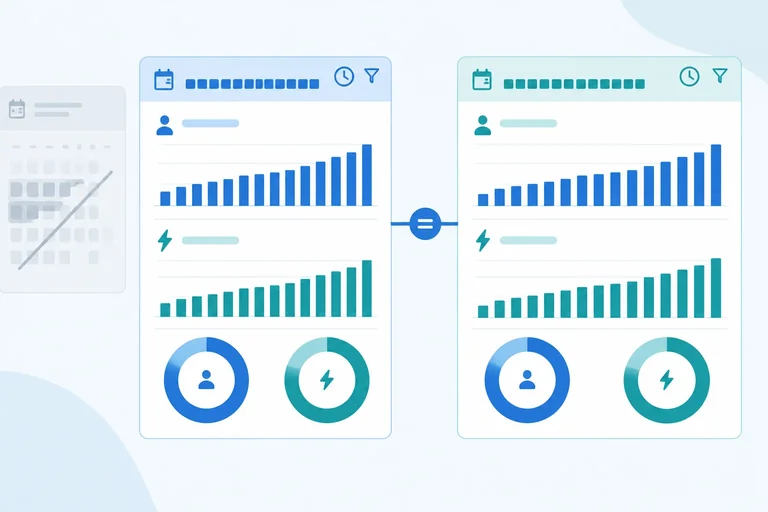
A period comparison is defensible only when it describes like with like. Before interpreting a change, align:
For a recent period, also check that reporting is fresh enough to use. Do not compare a partial day or an incomplete period with a completed period.
A matched comparison can show what changed in recorded data. It does not, by itself, explain why it changed.
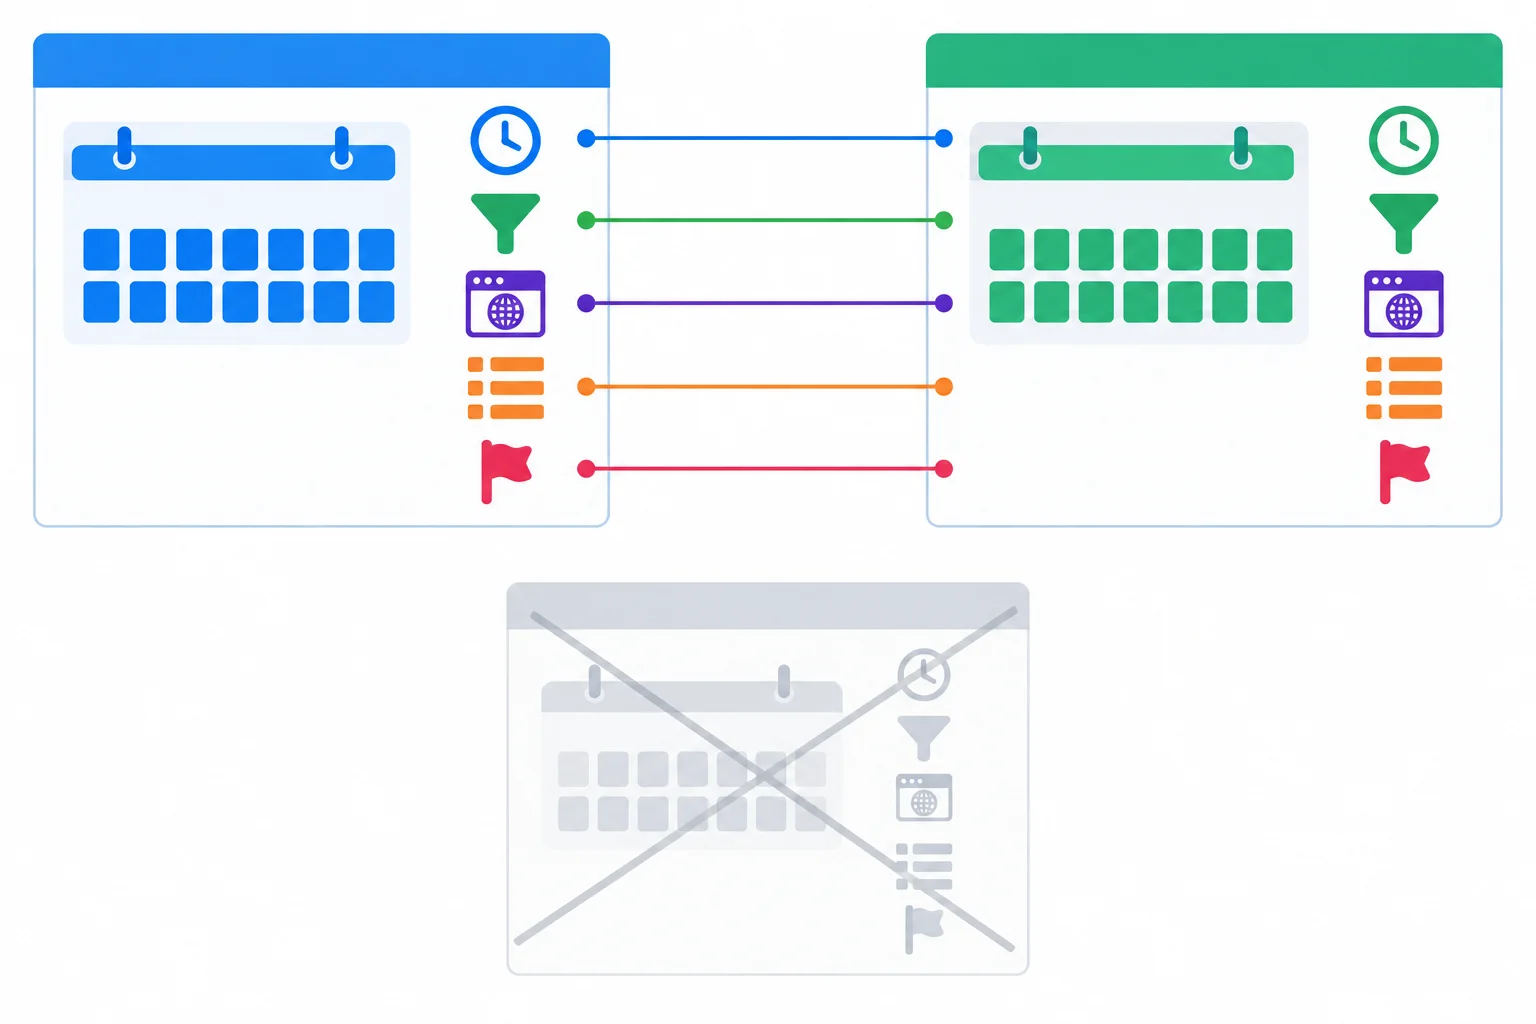
Match the reporting context before comparing results. Two dates alone do not make a comparison controlled.
Harbor Workshops provides two complete 14-day Traffic acquisition extracts. Both use the same web stream, UTC property time zone, no additional filters, the same session-scoped default channel-group dimension, and the selected key event generate_lead.
These are selected channel rows, not property totals. Sessions with generate_lead is a supplied practice annotation used to calculate the session key event rate; it is not assumed to be a native report column.
Current period: 01–14 Apr 2026 in UTC.
| Channel | Sessions | Engaged sessions | Key events | Sessions with generate_lead | Average engagement time per session |
|---|---|---|---|---|---|
| Organic Search | 1,000 | 600 | 40 | 30 | 45 s |
| 200 | 140 | 30 | 20 | 60 s |
Previous period: 18–31 Mar 2026 in UTC.
| Channel | Sessions | Engaged sessions | Key events | Sessions with generate_lead | Average engagement time per session |
|---|---|---|---|---|---|
| Organic Search | 800 | 480 | 32 | 24 | 45 s |
| 160 | 112 | 20 | 16 | 60 s |
Now separate a change in volume from a change in rate.
For Email, Key events rose from 20 to 30. The relative count change is:
(30 − 20) ÷ 20 = 50.0%
But the session key event rate uses sessions containing at least one generate_lead, not the Key events count:
16 ÷ 160 = 10.0%20 ÷ 200 = 10.0%Email recorded more key-event occurrences while its session key event rate did not change. State a difference between rates in percentage points: 10.0% − 10.0% = 0.0 pp.
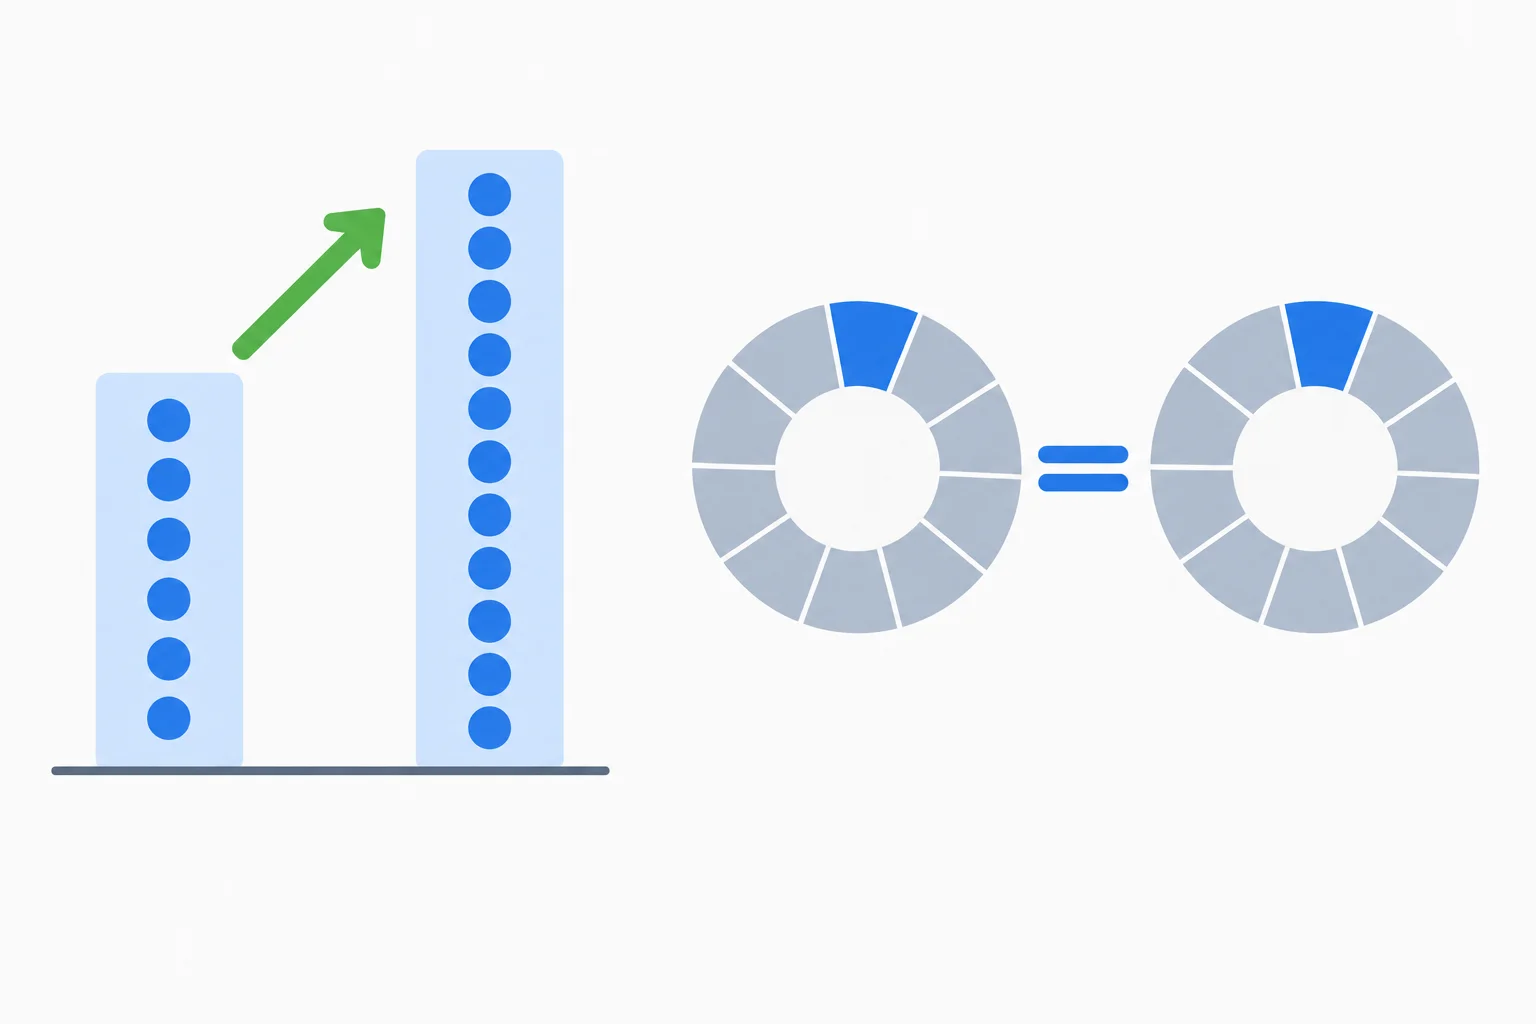
The Email count rises by 50.0%, while the share of sessions containing generate_lead remains 10.0% in both periods: a 0.0 pp rate change.
Tip
The Email row has more Sessions as well as more Key events. More traffic can raise a count even when the share of sessions producing generate_lead is unchanged.
A careful finding is: “Email Key events increased 50.0%, while the Session key event rate remained 10.0%.” Do not turn that observation into an explanation of why the increase occurred.
Which comparison note is defensible for Email?
Step 7 of 9
Attribution assigns reporting credit to touchpoints that GA4 recorded. It can show that a channel is associated with a recorded key event, but it does not prove that the channel caused the outcome.
For example, a report cannot reveal whether a workshop inquiry would have happened without an email. Therefore, “Email caused additional inquiries” is stronger than the report evidence supports.
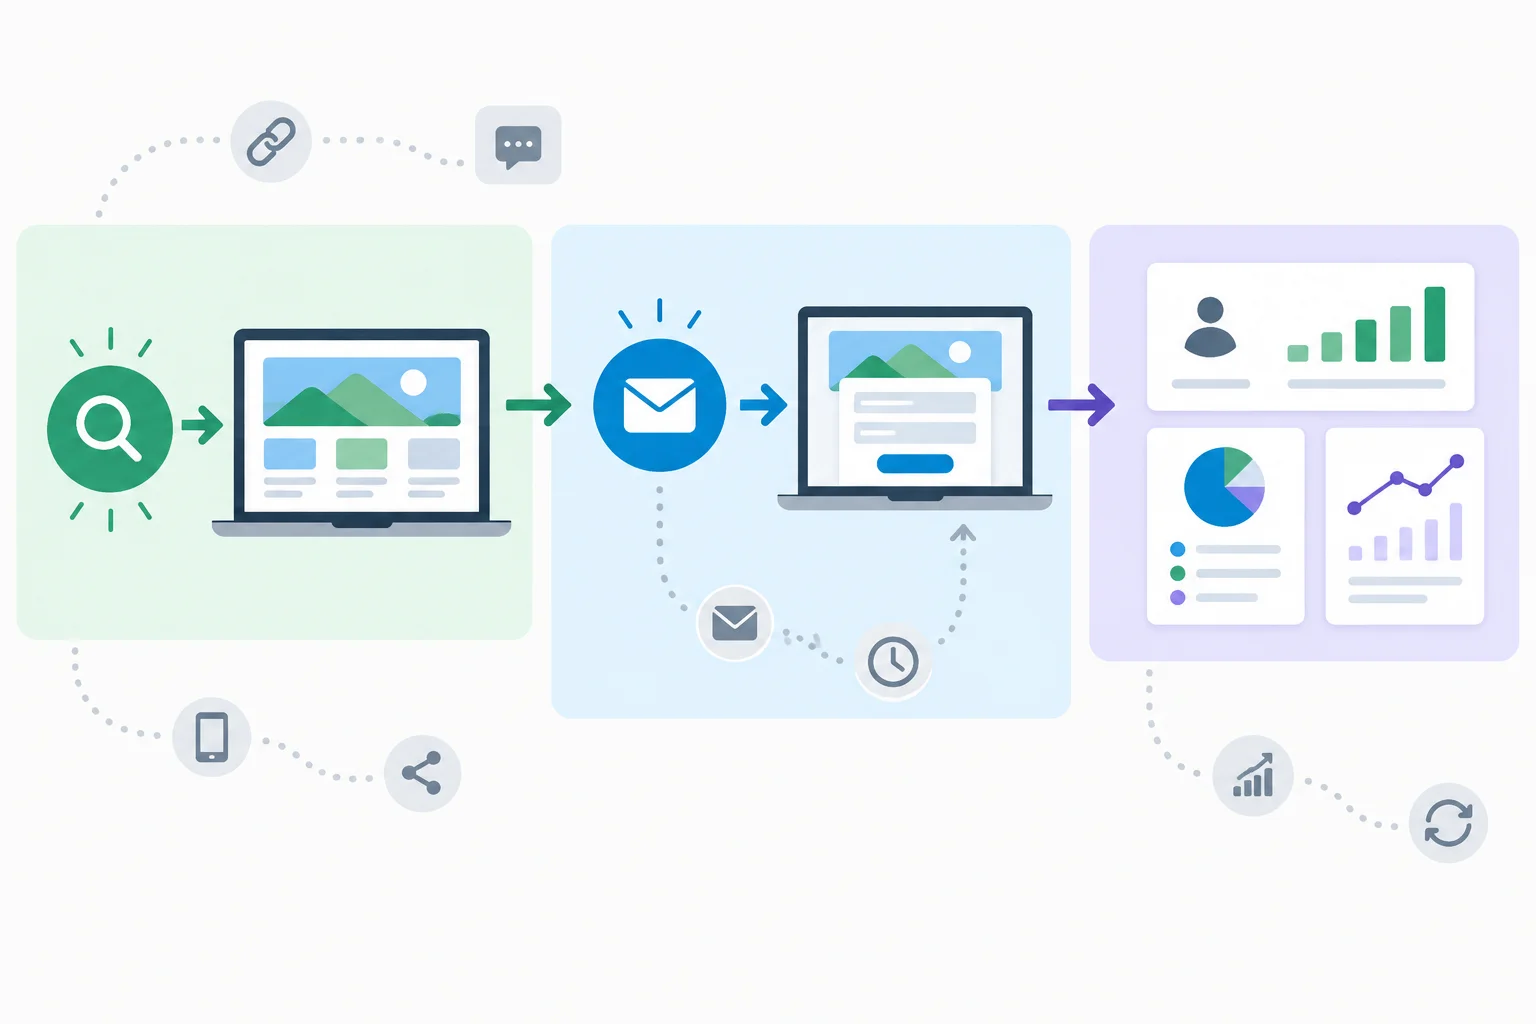
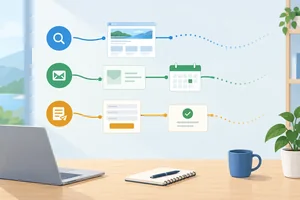
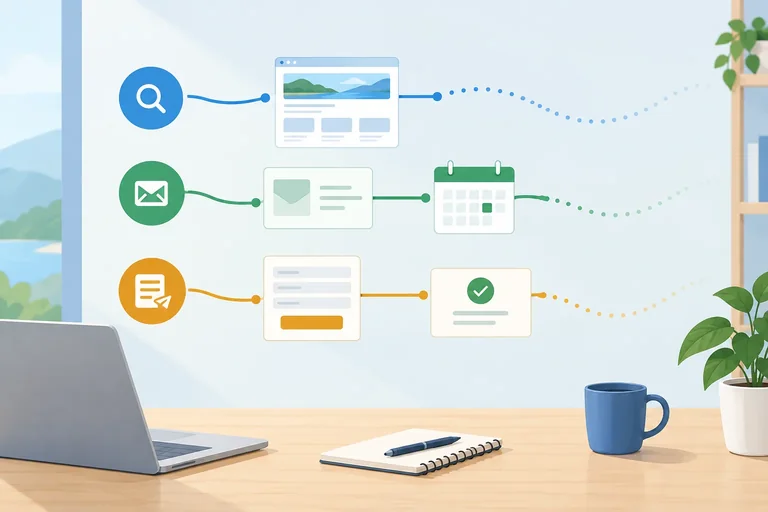
For one recognized user, Google organic can describe the first arrival while newsletter / email describes a later session. Each report view summarizes a different recorded aspect of the journey.
For Harbor Workshops, one recognized user first arrives through google / organic and later returns through the spring_workshops email campaign, shown as newsletter / email.
A first-user view can retain Google organic as the acquisition origin. A session-origin view can show Email for the later return session. An event-attribution view can describe reporting credit for touchpoints connected with generate_lead. These descriptions answer different questions; none alone proves which channel caused the inquiry.
Recorded journeys may be incomplete. A person might use another device, interact with an unrecorded channel, browse with restrictions, or decline analytics consent. These are visibility limits, not automatic proof of faulty tracking.
Because some touchpoints can be absent, do not give one channel all the credit or claim that it created incremental inquiries from a report alone.
Use the view that matches the question, then keep its limit visible.
| Question | Compatible view | What it cannot establish |
|---|---|---|
| Where was this user first acquired? | First user source / medium | Which later session caused an inquiry |
| Where did this session originate? | Session source / medium | Which channel deserves all inquiry credit |
| Which recorded touchpoints received report credit? | Event-attribution view | Whether an inquiry would occur without a channel |
True or false: If a session acquisition result shows newsletter / email for a session with generate_lead, it proves that Email caused that inquiry.
A stakeholder writes: “Email caused 30 additional workshop inquiries in 01–14 Apr 2026.”
Rewrite this as a two-sentence evidence-based statement. First, state the recorded Email results using the supplied figures. Then name one visibility limitation relevant to the illustrated journey and explain what it prevents you from claiming.
Write at least 180 characters (0/180).

Step 8 of 9
Identify report-quality warning signs, frame them as hypotheses, and select evidence that can verify or reject them.
An unusual report pattern is a signal to investigate—not proof that tracking failed or that audience behavior changed. For example, fewer recorded generate_lead key events could reflect fewer submitted inquiries, an interruption in collection, or a reporting-context difference.
Use a proportionate sequence:
Do not inspect personal data or attempt technical changes yourself. Use available aggregate records, existing validation evidence, campaign documentation, and confirmation from an authorized property owner.
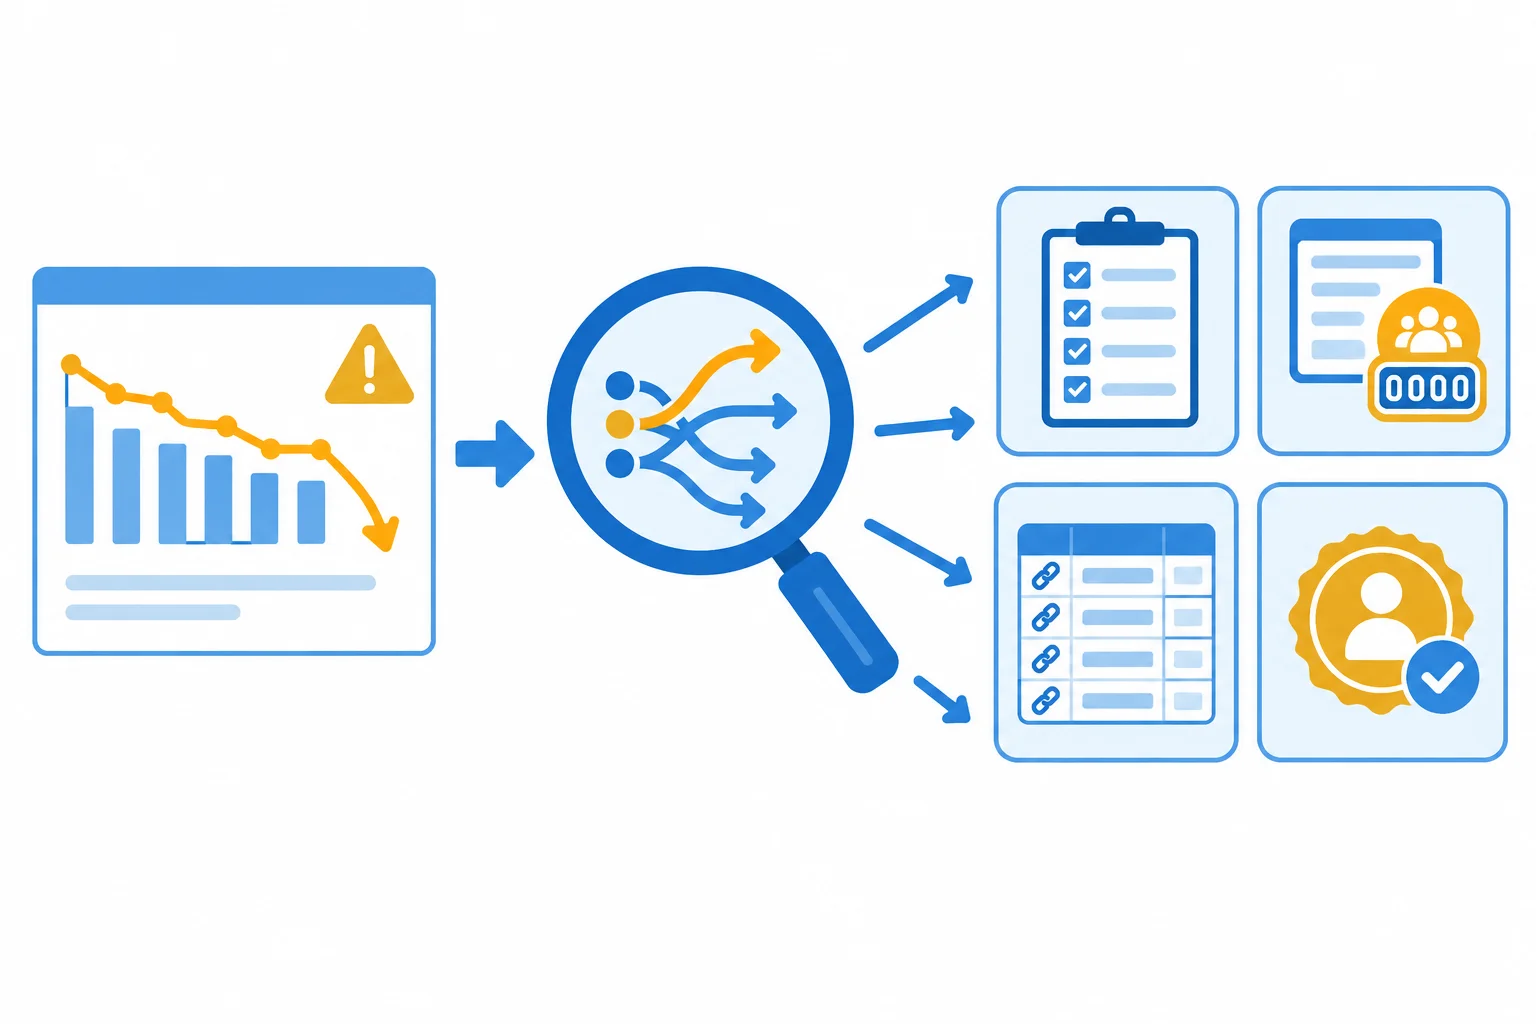
Treat the report as the starting point for a check, rather than as proof of one cause.
Tip
A check can reject a hypothesis as well as support it. If aggregate successful-inquiry records are stable while recorded generate_lead key events suddenly fall, that mismatch is worth investigating—but it still does not identify the cause by itself.
Some labels and reporting treatments need careful reading. Their meaning depends on the report dimension and property context. Inspect any available data-quality indicator or notice before drawing a conclusion.
Possible signals and proportionate evidence checks
| Report pattern | Plausible reading | Useful next evidence |
|---|---|---|
| Direct traffic | No referrer or campaign was recognized; not proof someone typed the address. | Campaign-link register and referral context |
| Unassigned | Traffic did not fit the applicable channel-group rules. | Tagging records and property context |
| (not set) | A value was unavailable for the selected dimension. | Dimension scope and collection context |
| Unexpectedly low key events | Behavior changed or collection may be incomplete. | Aggregate inquiry record and existing validation log |
| Unexpectedly high key events | More actions occurred or occurrences may be duplicated. | Existing validation log and owner confirmation |
| Very small denominator | A rate can be unstable. | A larger compatible period or denominator |
Warning
Thresholding can withhold data to protect privacy. Modeling can estimate otherwise unobserved activity where eligible. A withheld result is not automatically zero, and a modeled result is not proof of complete measurement.
For either case, inspect the available notice or indicator and relevant property context. Limit the strength of any performance conclusion until you know what the report is showing.
Match each report signal to the most proportionate next check. Treat every signal as a hypothesis, not a confirmed tracking fault.
Tap an item and then its matching pair.

Step 9 of 9
Produce a short, defensible interpretation of supplied acquisition, engagement, and key-event results.
A defensible performance note makes four different jobs visible:
Keep facts separate from explanations. A channel row can show an association with sessions or key events; it does not prove that the channel caused the outcome. Do not turn one report comparison into a spending or optimization recommendation.
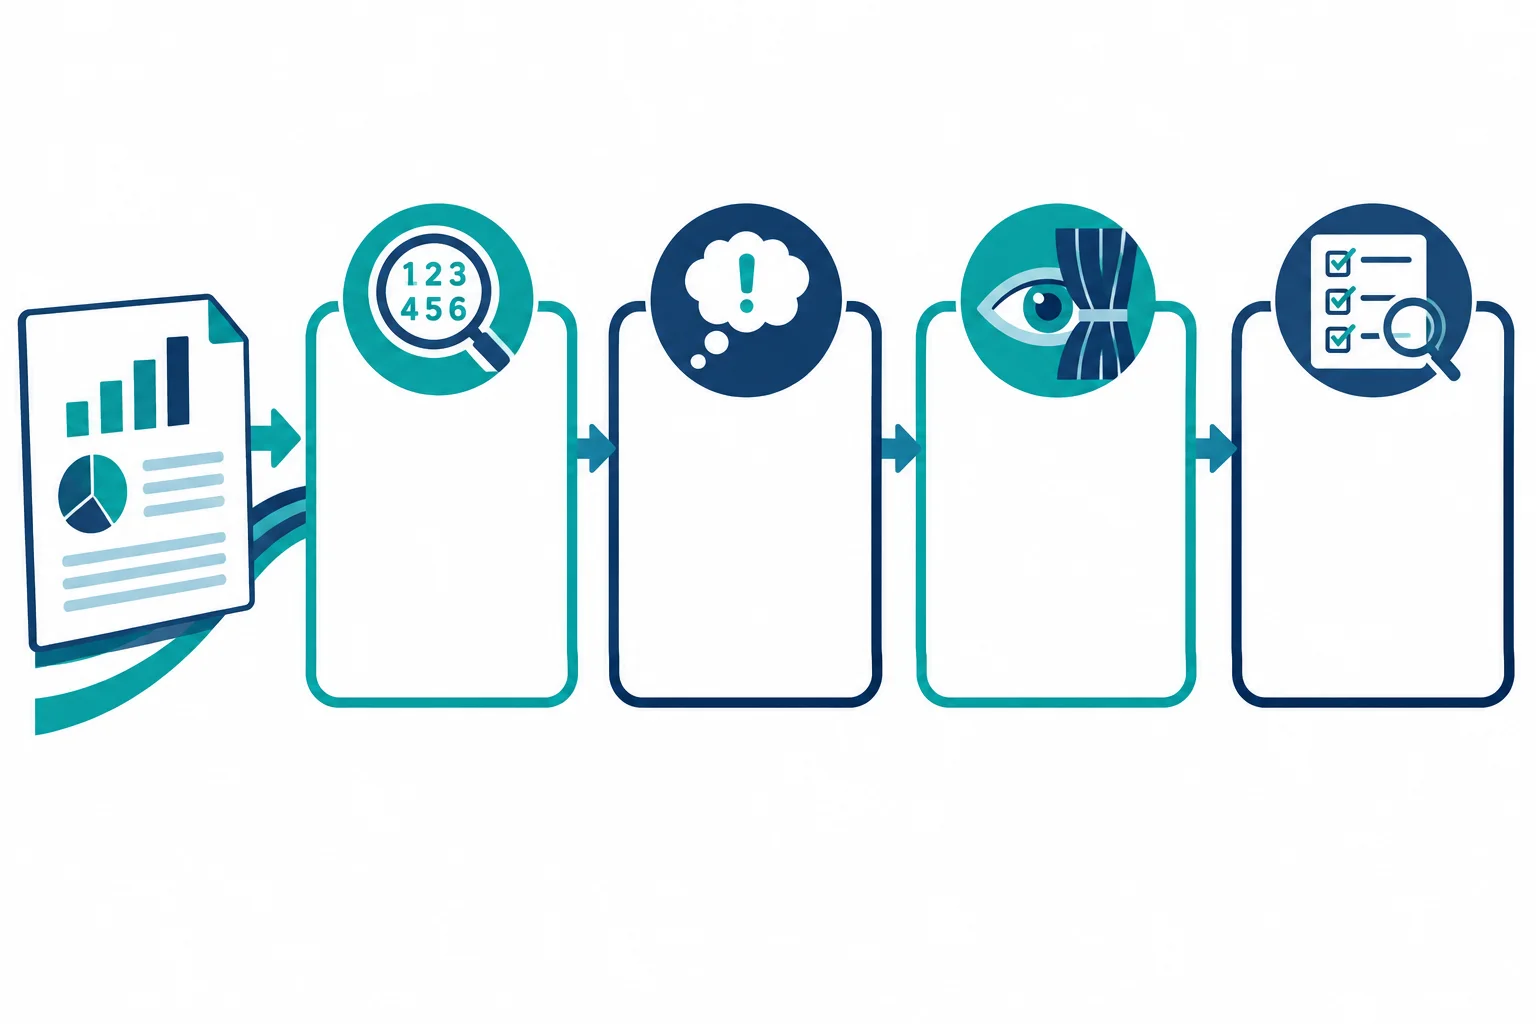
Use this sequence to separate what the report records from what still needs verification.
Tip
For Harbor Workshops, an appropriate limitation is that recorded attribution does not prove incremental impact. One recognized user may first arrive through Google organic search and later return through an email campaign. A useful next check can inspect an existing aggregate inquiry record or an existing validation log; it must not claim that tracking is broken before evidence supports that conclusion.
The question for the final note is about where sessions originated. Use Traffic acquisition with the session-scoped dimension Session source / medium.
The tables below compare complete, compatible 14-day periods in UTC, with the same web-stream scope and no additional filters. They are selected channel rows, not property totals.
From these rows, Organic Search has a 60.0% engagement rate and 45 s Average engagement time per session in both periods. Email has a 70.0% engagement rate and 60 s in both periods. Email Key events rise from 20 to 30, but its sessions also rise from 160 to 200. Its session key-event rate is unchanged: 16 / 160 = 10.0% and 20 / 200 = 10.0%.
Current period: 01–14 Apr 2026. Selected channel rows only.
| Channel — source / medium | Sessions | Engaged sessions | Key events | Sessions with generate_lead | Average engagement time per session |
|---|---|---|---|---|---|
| Organic Search — google / organic | 1,000 | 600 | 40 | 30 | 45 s |
| Email — newsletter / email | 200 | 140 | 30 | 20 | 60 s |
Previous period: 18–31 Mar 2026. Selected channel rows only.
| Channel — source / medium | Sessions | Engaged sessions | Key events | Sessions with generate_lead | Average engagement time per session |
|---|---|---|---|---|---|
| Organic Search — google / organic | 800 | 480 | 32 | 24 | 45 s |
| Email — newsletter / email | 160 | 112 | 20 | 16 | 60 s |
Harbor Workshops asks: “Which origins brought sessions, and what can we responsibly say about Email performance?”
Write a short note comparing 01–14 Apr 2026 with 18–31 Mar 2026. Begin with the report and scoped dimension you selected. Then use exactly these headings:
Observed
Interpretation
Limits
Next check
Your note must cite an accurate engagement comparison and accurate Email key-event and session-rate figures. Distinguish the higher Email key-event count from its unchanged session key-event rate. State one attribution or measurement limit, then propose one justified verification check. Do not claim that a tracking problem is proven.
Write at least 350 characters (0/350).
Summary
A short note is stronger when another person can trace each statement back to a compatible report row or to a clearly named uncertainty.
Congratulations! You completed: Read GA4 Acquisition, Engagement, and Key-Event Reports
Thousands of online courses in video, ebooks and audiobooks.
To test your knowledge during online courses
Generated directly from your cell phone's photo gallery and sent to your email

Download our app via QR Code or the links below:.


Carry knowledge in your pocket.
Download the Cursa app.
There are hundreds of free courses available, with a free certificate of completion that is saved in your mobile image gallery.
Download the app to access the Course Completion Certificate for Free.

+ 10 million
students

Free and Valid
Certificate

60 thousand free
exercises

4.8/5 rating in
app stores

Free courses in
video and ebooks