
Step 1 of 8
Check Whether the Reports Are Comparable
Learn to validate reporting periods, attribution, timing, and measurement before making a paid-campaign decision.

Learning path · Level 7 · Tutorial 5
Analyze simulated campaign reports presented in the tutorial and recommend a justified next action. Produce a controlled optimization note covering search terms, audiences, placements, creative, or budget without accessing a live advertising account.

 Check Whether the Reports Are Comparable
Learn to validate reporting periods, attribution, timing, and measurement before making a paid-campaign decision. 3 min
 Locate the Most Likely Bottleneck
Use delivery, response, conversion, and cost evidence to identify the first performance stage worth investigating. 3 min
 Turn Search-Term Evidence into a Focused Change
Use a partial, simulated Google Ads search-term report to distinguish irrelevant traffic from relevant queries that need more evidence, then propose one narrowly scoped change. 3 min
 Interpret Meta Breakdowns Without Overreacting
Interpret simulated Meta audience and placement breakdowns cautiously, then select a narrow action supported by evidence. 3 min
 Separate Fatigue from Destination and Tracking Problems
Use frequency, response, and downstream evidence to distinguish a plausible creative issue from destination friction or a measurement problem. 3 min
 Justify a Limited Budget Decision
Use credible purchase economics, attribution limitations, and fulfillment capacity to choose a bounded budget transfer or a justified hold. 4 min
 Specify the Change and Its Review Rules
Create a focused, reversible campaign change record with safeguards and lag-aware review conditions. 3 min
 Write and Defend Your Optimization Note
Synthesize simulated Northstar Bags reporting into a concise, controlled optimization note with one focused route, an explicit budget decision, and lag-aware review rules. 4 min
Step 1 of 8
Learn to validate reporting periods, attribution, timing, and measurement before making a paid-campaign decision.
Before comparing performance, make the reports describe the same thing. For Northstar Bags, use the complete seven-day baseline period, Aug 3–9, 2026, against the complete seven-day comparison period, Jul 27–Aug 2, 2026. All case reporting uses UTC.
Check these conditions before interpreting a rise or fall:
The baseline snapshot is dated Aug 18, 2026. A newer incomplete range must be labeled Provisional, not compared as if it were mature evidence.
Use this comparison pattern: align time, range, snapshot, unit, and conversion rule before judging a performance difference.

A valid comparison begins by aligning the reports, not by reacting to the largest number.
An attributed purchase is credit assigned by a reporting rule; it is not proof that advertising created an incremental sale, and it does not establish a new customer.
For this case, Google Ads reports a 7-day click window. Meta reports 7-day click / 1-day view. Baseline comparison tables isolate click-attributed results using interaction-date reporting. Keep Meta view-attributed results separate.
GA4 or store evidence can legitimately differ from platform totals. Their counting and date basis may differ; GA4 may use purchase-event dates, and consent-related collection gaps can reduce observed events. Different attribution methods can also assign credit differently. Check the labels before treating a difference as an error.
Read each result with its credit and date basis. Do not add platform purchase totals across campaigns and call the result unique orders: one order can be credited by more than one platform.
| Source | Purchase credit shown | Window | Date basis for baseline comparison |
|---|---|---|---|
| Google Ads | Click-attributed purchase | 7-day click | Interaction date |
| Meta click report | Click-attributed purchase | 7-day click | Interaction date |
| Meta view report | View-attributed purchase | 1-day view | Show separately |
| GA4 or store record | Own counting rule | Own rule | State event or order date |
Tip
A recent report can change as delayed conversions arrive or platform processing finishes. When a reporting range is still incomplete or its attribution window has not had time to mature, label it Provisional. Do not use an immature CPA difference as the reason for a campaign change.
Some discrepancies need investigation before optimization. Warning signs include duplicate purchase events, a sudden unexplained disappearance of purchases while paid orders continue, or campaign tags that stop appearing in traffic records.
Use order and event evidence to decide what to check first. A platform-versus-GA4 difference can be legitimate when rules differ. Repeated events for the same completed order, however, are evidence of a possible measurement fault—not a signal to change targeting or spend.
This small audit is not a campaign performance report. It tests whether the purchase count can be trusted.
| Record | Observed count | Order-ID evidence |
|---|---|---|
| Paid-order ledger | 10 | 10 distinct paid order IDs |
| GA4 purchase-event export | 20 | Each of the 10 IDs appears twice |
| Campaign-tagged sessions | Present | Tagging is still observed |
Warning
Do not interpret the 20 events as 20 purchases. First investigate why a purchase event appears twice per paid order, then use corrected measurement before evaluating campaign outcomes.
Match each evidence pattern to the first check that should happen before changing a campaign.
Tap an item and then its matching pair.

Step 2 of 8
Use delivery, response, conversion, and cost evidence to identify the first performance stage worth investigating.
Start at the earliest stage supported by evidence. A report pattern tells you where to investigate first; it does not prove why the problem exists.
Move left to right. A downstream result can be weak even when an earlier stage looks healthy. Conversely, low impressions alone do not prove that more budget is the answer.
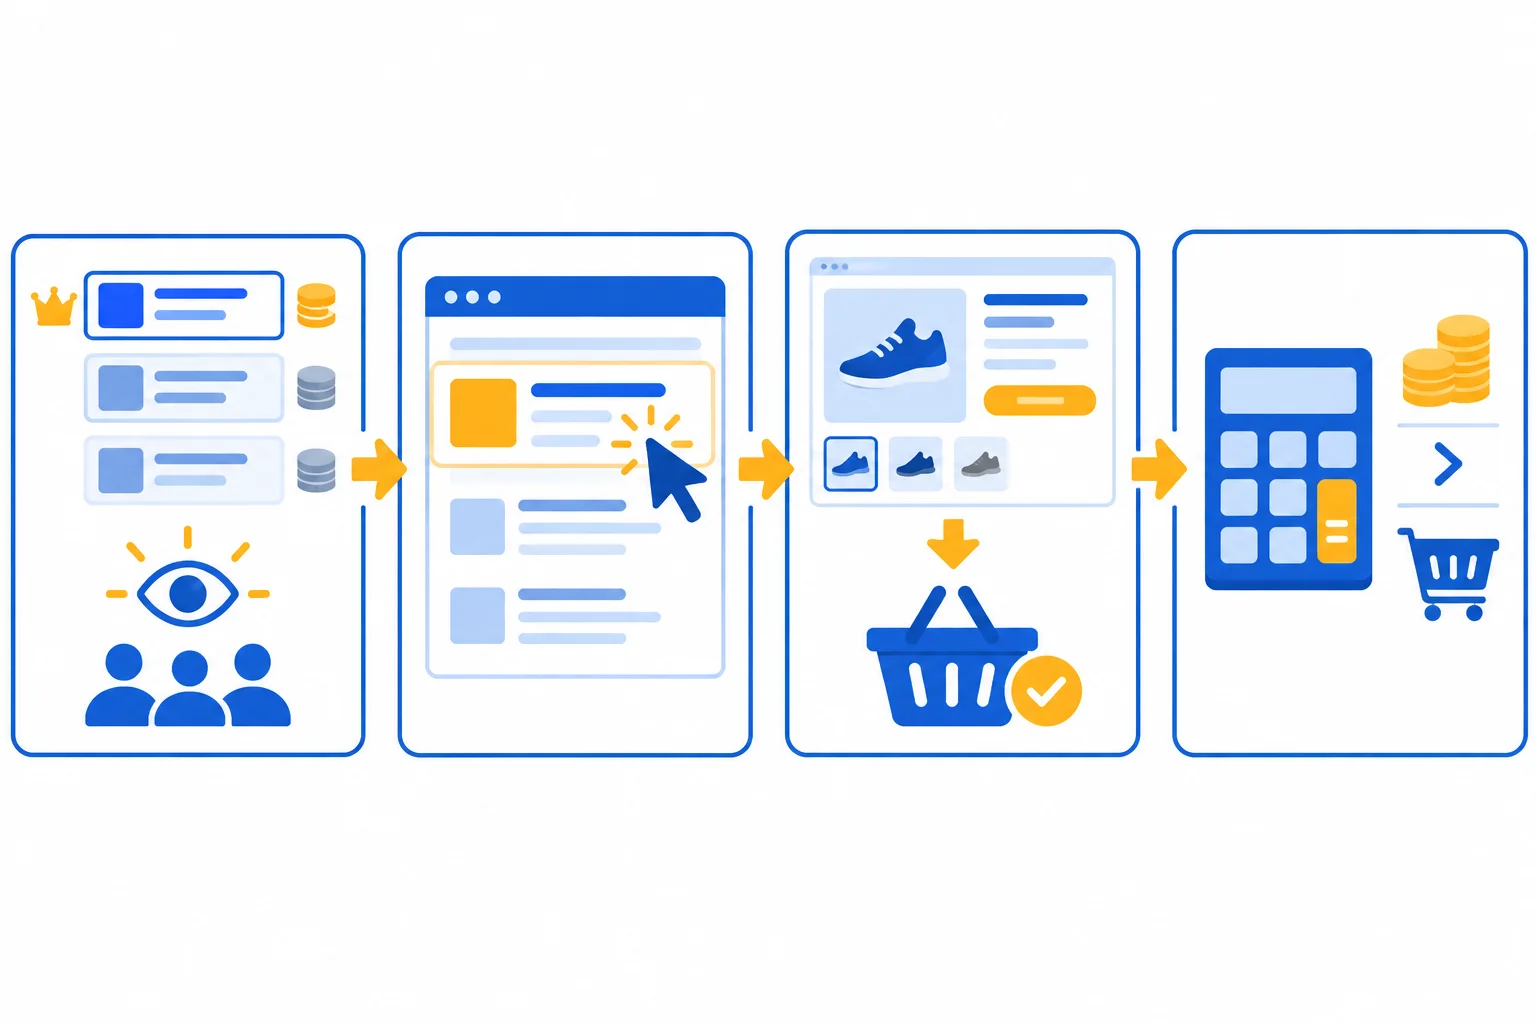
Use the sequence to locate the first stage that needs investigation; do not assume a later metric identifies the cause.
Tip
Treat low delivery as a question, not a budget instruction. Check eligibility, settings, audience size, auction conditions, and the reporting period before proposing more spend. Budget can only help if there is credible additional opportunity to buy.
The comparison checks from the prior step have been completed for this exercise. Read each platform's results on its own terms, then use the case guardrail to locate the first actionable concern. Do not add platform purchase rows and call them unique orders; neither count establishes a new customer.
Simulated data — platform campaign reports, Aug 3–9, 2026, UTC interaction-date reporting, campaign level. Google Ads uses 7-day click attribution. Meta uses 7-day click / 1-day view attribution; this table isolates click-attributed results only. Baseline snapshot dated Aug 18, 2026.
| Campaign | Impressions | Platform click denominator | Spend | Click-attributed purchases | Click-attributed purchase CPA |
|---|---|---|---|---|---|
| Search | Daypack | 20,000 | 800 clicks | $400.00 USD | 25 | $16.00 |
| Meta | Prospecting | 40,000 | 600 outbound clicks | $300.00 USD | 10 | $30.00 |
Example
For Search | Daypack, CTR is 4.0%, CPC is $0.50, and click-attributed purchase CPA is $16.00—below the $24.00 guardrail.
For Meta | Prospecting, Outbound CTR is 1.5%, outbound CPC is $0.50, but click-attributed purchase CPA is $30.00—above the guardrail. Ten purchases also represent $320.00 of contribution before advertising and fixed costs, using the $32.00 case assumption.
The first investigation is therefore acquisition economics for Meta, not an automatic budget increase. A working hypothesis is that the acquired traffic is less likely to become a viable purchase. An alternative is a destination, order-record, or attribution-counting issue. Corroborate before changing: compare purchase and checkout evidence with appropriately dated store-order records.
Match each short report pattern to the most likely first diagnostic stage and one corroborating evidence check.
Tap an item and then its matching pair.

Step 3 of 8
Use a partial, simulated Google Ads search-term report to distinguish irrelevant traffic from relevant queries that need more evidence, then propose one narrowly scoped change.
A search-term row is evidence, not an automatic verdict. Read five things together: the searcher’s intent, fit with the $80.00 daypack offer, clicks, spend, and whether click-attributed purchase outcomes have had time to mature.
Use the evidence to separate three situations:
A visible search-term report is only a partial view. It can support a targeted action on a shown query, but it cannot describe every search that triggered the campaign.
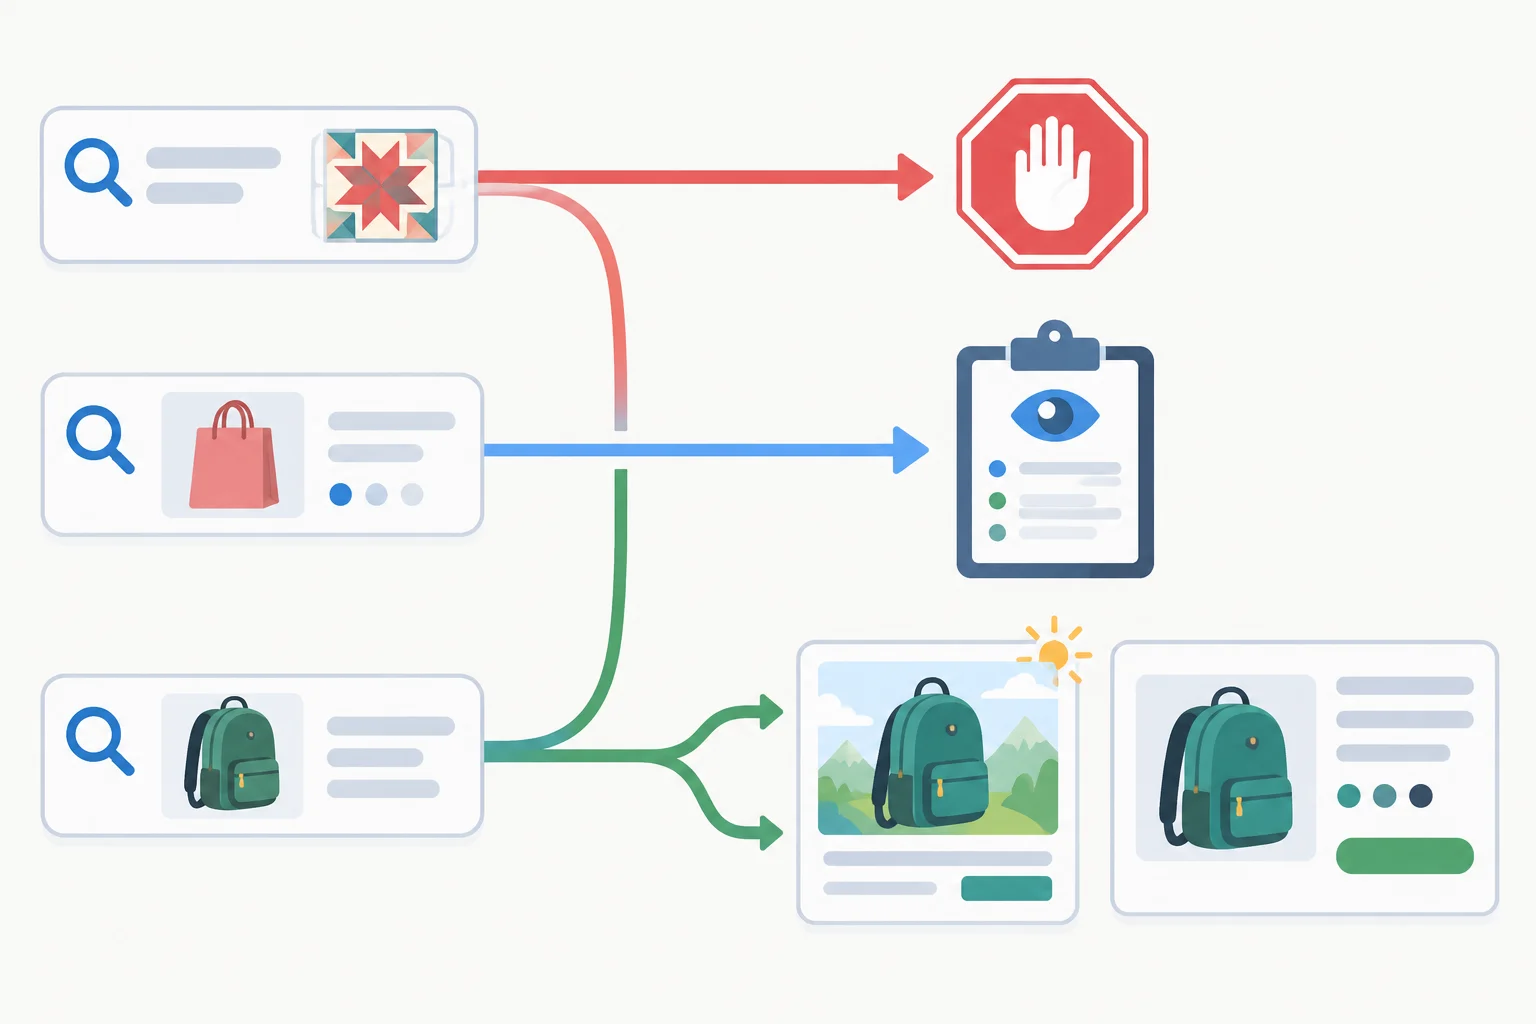
Intent and evidence strength determine whether to exclude, observe, or refine alignment.
Tip
Protect relevant traffic. A negative keyword should be as narrow in match type and scope as the evidence allows. Do not use one weak-looking row to block a broader family of daypack searches.
The full Search | Daypack campaign spent $400.00 USD during Aug 3–9, 2026. The rows below are not campaign totals: they show only terms visible in one ad group.
The baseline snapshot is dated Aug 18, 2026 and uses UTC. Google Ads is using the case setting of 7-day click attribution with interaction-date reporting. Because the latest interaction was Aug 9, its 7-day click window ended by Aug 16; these displayed click-attributed outcomes have had time to mature for this comparison.
Zero purchases still means different things for different queries. A sewing-pattern search has an obvious offer mismatch. A work-use daypack search may be relevant, but 18 clicks are limited evidence; first verify that the product page can honestly support the implied use.
Simulated data — Source: Google Ads search terms report; period: Aug 3–9, 2026; level: Search | Daypack campaign > Daypack Core ad group; interaction-date reporting in UTC; baseline snapshot: Aug 18, 2026.
| Search term | Clicks | Spend | Click-attributed purchases | Initial reading |
|---|---|---|---|---|
| Search term: backpack sewing pattern | 60 | $36.00 | 0 | Clearly mismatched intent |
| Search term: daypack for work | 18 | $10.80 | 0 | Potentially relevant; limited evidence |
| Search term: lightweight daypack | 150 | $75.00 | 6 | Useful wording; check claim fit |
| Search term: college daypack | 40 | $24.00 | 1 | Relevant category; limited evidence |
Tip
A row missing from this report is not necessarily absent from delivery. Keep the decision limited to the visible evidence, then review additional terms before drawing a campaign-wide conclusion.
Based on the visible report, which first change best protects relevant traffic while reducing clearly irrelevant traffic?
Write a 2–4 sentence recommendation from the visible search-term report. Select one exclusion or ad-group refinement, state its scope, and explain the evidence for it. If you choose a negative keyword, include its match type. Then name one other apparently weak query that should remain eligible for now and explain why it should not yet be excluded. Keep this to one primary change.
Write at least 180 characters (0/180).

Step 4 of 8
Interpret simulated Meta audience and placement breakdowns cautiously, then select a narrow action supported by evidence.
Read a breakdown row across its full path: impressions, outbound clicks, spend, and click-attributed purchases. A lower CPC or higher Outbound CTR is only an early signal. Click-attributed purchases and click-attributed purchase CPA indicate whether the traffic appears commercially useful.
For Meta | Prospecting, the baseline campaign report for Aug 3–9, 2026 shows 40,000 impressions, 16,000 reach, 600 outbound clicks, $300.00 USD spend, and 10 click-attributed purchases. This comparison uses UTC, interaction-date reporting, and Meta’s 7-day click attribution. View-attributed results are not included.
A click-attributed purchase is not proof of a unique new customer or an incremental sale.
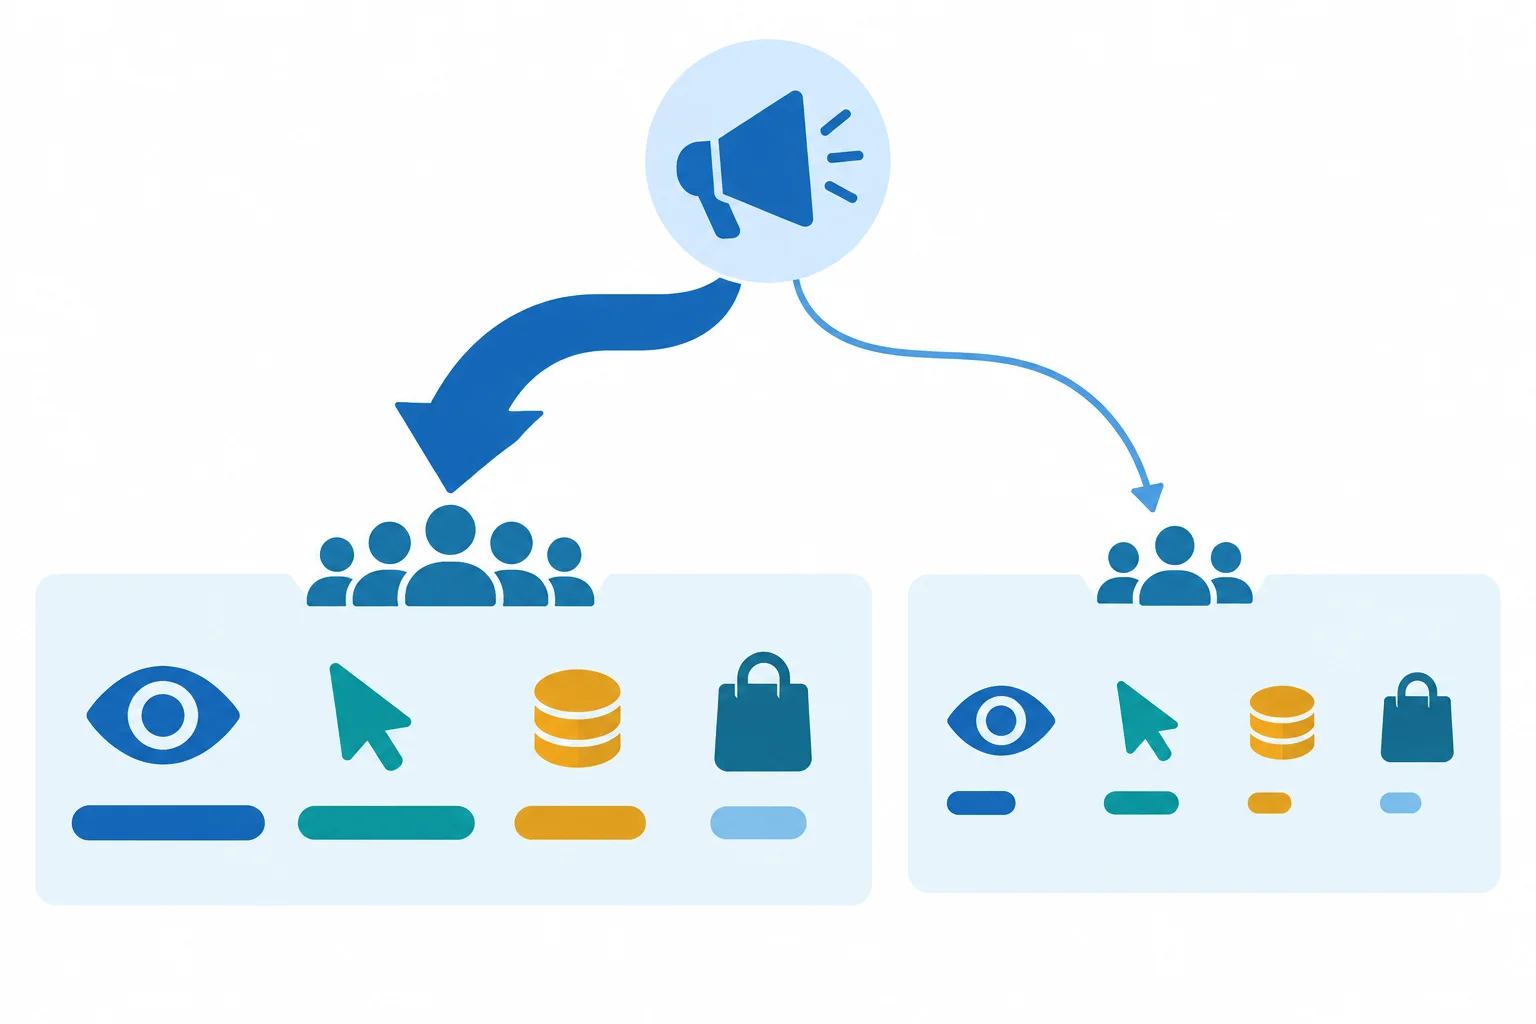
Audience-row impressions can be added when the report supports it. Campaign reach is a separate, potentially overlapping measure and should not be summed across audience rows.
Only the additive fields in these rows reconcile to the campaign totals: 40,000 impressions, $300.00 spend, 600 outbound clicks, and 10 click-attributed purchases. Campaign reach is 16,000, but it is intentionally not divided into audience rows because people can qualify for or overlap across multiple audience definitions.
Automated delivery is not a randomized comparison. It may favor one row because of auction conditions, predicted response, available inventory, or other delivery signals not visible here.
| Audience row | Impressions | Spend | Outbound clicks | Click-attributed purchases | Click-attributed purchase CPA |
|---|---|---|---|---|---|
| Broad prospecting | 30,000 | $220.00 | 480 | 8 | $27.50 |
| Interest suggestion | 10,000 | $80.00 | 120 | 2 | $40.00 |
An apparent winner or loser may reflect uneven opportunity rather than a stable audience or placement effect. Eight versus two click-attributed purchases is limited evidence, especially when delivery differs greatly.
Use the same discipline for placements. Feed and Reels can differ in creative crop, device use, viewing context, and destination behavior. A weak placement row is a diagnostic question, not an automatic exclusion. Cheap clicks or low CPM do not establish valuable traffic; low delivery alone does not establish poor traffic.
Feed received more than twice the impressions and four times the click-attributed purchases. This does not prove Feed is superior or that Reels should be removed. The report does not establish whether audience composition, creative rendering, device experience, conversion timing, or auction opportunities were comparable.
| Placement | Impressions | Spend | Outbound clicks / Outbound CTR | Click-attributed purchases | Click-attributed purchase CPA |
|---|---|---|---|---|---|
| Feed | 28,000 | $220.00 | 460 / 1.6% | 8 | $27.50 |
| Reels | 12,000 | $80.00 | 140 / 1.2% | 2 | $40.00 |
Warning
Do not exclude a placement solely because its click-attributed purchase CPA is higher in a small, uneven breakdown. First check whether the creative fits that placement’s format, whether the mobile destination experience is usable, and whether purchase outcomes have matured. Also inspect audience overlap and delivery context before interpreting an audience row as a causal result.
Choose the narrowest action supported by verified evidence. A confirmed control mismatch can justify a focused correction even when the performance comparison remains uncertain. In contrast, an unsupported audience restriction or placement exclusion can discard useful demand and make the next report harder to interpret.
Keep recommendations within controls actually available in the account, applicable consent conditions, and advertising policies. Do not infer sensitive traits or invent targeting segments from a weak breakdown.
Example
A campaign brief states that Northstar Bags should reach people located in Harbor County. An account check finds that the current geographic setting includes people who merely show interest in Harbor County. That is a verified mismatch with the brief—not a conclusion drawn from click-attributed purchase CPA—and supports correcting the available location control to match the approved requirement.
Use this guide before editing. Preserve uncertain audience and placement settings while checking their missing context.
| What the report or audit shows | Defensible next action | Do not conclude |
|---|---|---|
| Verified geographic control differs from the approved brief | Correct the available location control; keep other major settings unchanged | That a placement caused the CPA gap |
| Few purchases and uneven audience delivery | Gather more comparable evidence; inspect overlap and delivery context | That the cheaper-click row is more valuable |
| Weak placement row | Check creative fit and mobile destination experience before an exclusion | That the placement is inherently poor |
For Meta | Prospecting in Aug 3–9, 2026, Feed recorded 8 click-attributed purchases and Reels recorded 2. Delivery was uneven. The report does not show whether Reels creative rendering, mobile destination experience, audience overlap, or auction context were comparable.
Separately, an account audit confirms that the campaign includes people who only show interest in Harbor County, although the approved brief requires people located there.
Which next action is most defensible?

Step 5 of 8
Use frequency, response, and downstream evidence to distinguish a plausible creative issue from destination friction or a measurement problem.
Frequency describes average repetition within one defined scope and period.
Frequency = impressions ÷ reach
For example, 18,000 impressions delivered to 6,000 reached people produces a frequency of 3.0. It does not mean every person saw the ad exactly three times: some may have seen it fewer times and some more.
Always name the campaign, audience scope, and reporting period before interpreting frequency. A change in frequency can reflect delivery changes as well as a changing audience.
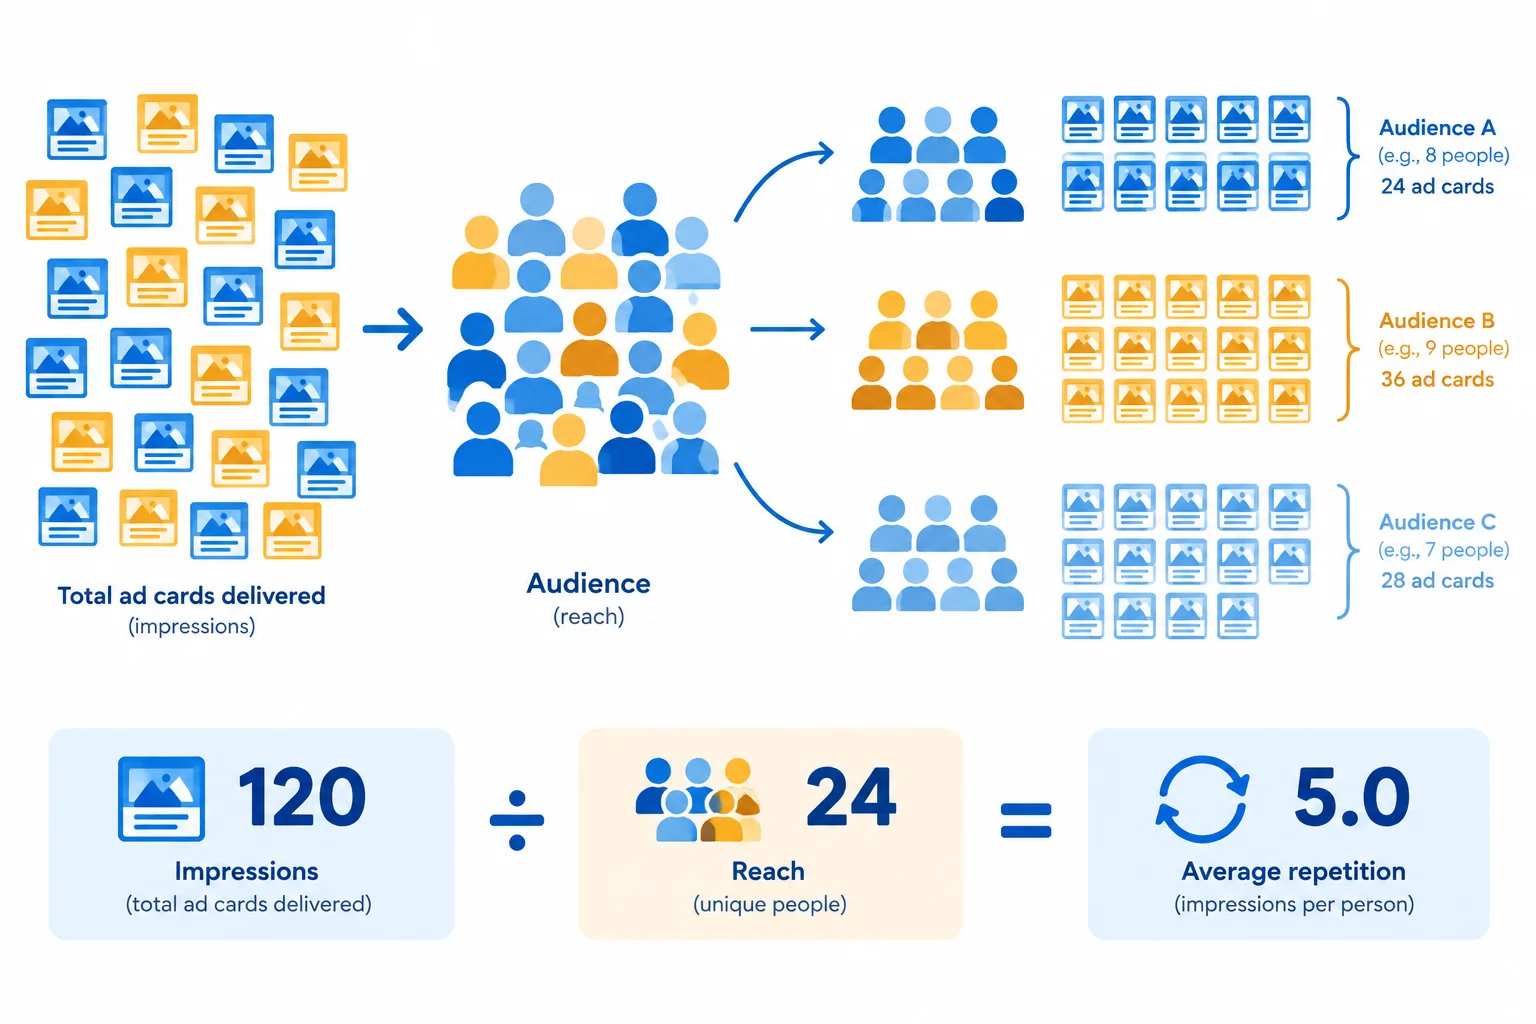
Frequency is a campaign-level average for a specified period; it is not an identical exposure count for every person.
Tip
There is no universal frequency value at which an ad has “failed.” Higher repetition becomes useful evidence only when it is read alongside response, delivery conditions, and downstream outcomes.
The two complete seven-day periods below use the same campaign level and UTC. Reach did not grow, while impressions rose and outbound response declined. That pattern can support a fatigue hypothesis, but it does not establish one: audience composition, placements, promotions, and delivery conditions may also have changed.
Simulated data — Source: Meta Ads delivery report; level: Campaign, Meta | Prospecting; periods: Jul 27–Aug 2, 2026 and Aug 3–9, 2026; UTC; baseline snapshot dated Aug 18, 2026.
| Period | Impressions | Reach | Outbound clicks | Outbound CTR |
|---|---|---|---|---|
| Jul 27–Aug 2, 2026 | 32,000 | 16,000 | 608 | 1.9% |
| Aug 3–9, 2026 | 40,000 | 16,000 | 600 | 1.5% |
For Jul 27–Aug 2, 2026, calculate Meta | Prospecting frequency: 32,000 impressions ÷ 16,000 reach = ____.
Use the point where the path changes to choose the first investigation.
These are working hypotheses, not proof. Check equivalent full periods and corroborate the signal before changing an ad.
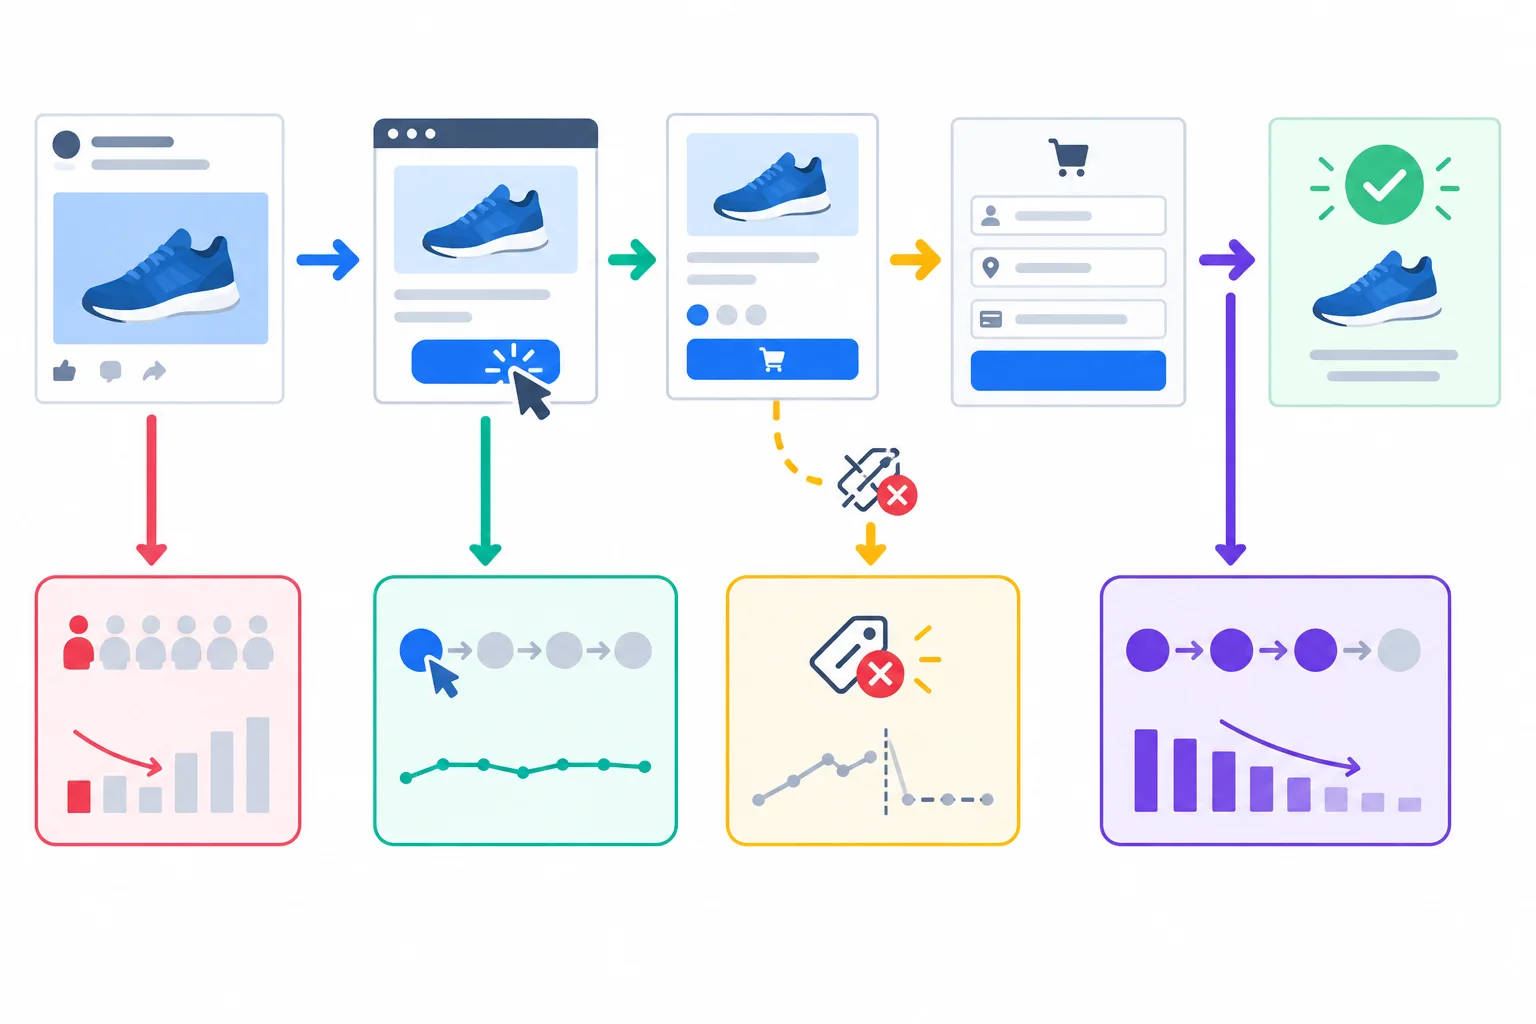
Locate where the evidence first weakens before selecting a creative, destination, or measurement action.
This guide describes useful first investigations, not causal conclusions.
| Observed combination | Most useful first investigation | Do not conclude |
|---|---|---|
| Frequency rises; outbound CTR falls; conditions are comparable | Creative wear or placement-format fit | Fatigue is proven |
| Outbound CTR is steady; post-click progression falls; events remain present | Destination experience | The ad caused the decline |
| Clicks continue; tagged page views or purchase events abruptly disappear | Measurement implementation | Demand disappeared |
Simulated data — Sources: Meta Ads campaign delivery and click-attributed purchases, interaction date; GA4 tagged landing_page_view, event date; level: Meta | Prospecting; UTC. Meta purchase results use the case setting of 7-day click attribution. GA4 page views use their own event counting and date basis.
| Period | Impressions | Reach | Outbound clicks | Outbound CTR | Meta click-attributed purchases (7-day click) |
|---|---|---|---|---|---|
| Jul 27–Aug 2, 2026 | 32,000 | 16,000 | 608 | 1.9% | 11 |
| Aug 3–9, 2026 | 40,000 | 16,000 | 600 | 1.5% | 10 |
Additional corroboration: GA4 recorded 578 tagged landing-page views in the comparison period and 570 in the baseline period. Audience geography, placement mix, promotion, and the ad itself were unchanged. Delivery was complete. No duplicate purchase-event warning, broken campaign tag, or abrupt loss of landing-page views was found.
Write a short diagnostic note with four parts:
Write at least 220 characters (0/220).

Step 6 of 8
Use credible purchase economics, attribution limitations, and fulfillment capacity to choose a bounded budget transfer or a justified hold.
A budget decision needs two separate evidence layers. First, compare platform outcomes on the same basis: Aug 3–9, 2026, UTC, interaction-date reporting, and click-attributed purchases. Google Ads uses a 7-day click window; the comparison portion of Meta also uses 7-day click attribution. Meta view-attributed purchases stay separate.
Second, use a deduplicated business record and fulfillment capacity to constrain the decision. Northstar Bags has a $700.00 USD seven-day planning budget, a $24.00 USD click-attributed purchase-CPA guardrail, and a $32.00 USD contribution-per-order case assumption before advertising and fixed costs.
Matching click-attribution windows makes the displayed CPA comparison more useful. It does not prove the campaigns are causal alternatives, that attributed purchases are unique orders, or that either campaign created a new customer.
Compare reported platform acquisition economics without treating either platform row as a count of deduplicated business orders.
| Campaign | Spend | Platform click denominator | Click-attributed purchases | Click-attributed purchase CPA | Click-attributed revenue / ROAS |
|---|---|---|---|---|---|
| Search | Daypack | $400.00 | 800 clicks | 25 | $16.00 | $2,000.00 / 5.00x |
| Meta | Prospecting | $300.00 | 600 outbound clicks | 10 | $30.00 | $800.00 / 2.67x |
The store ledger is a capacity check, not a way to assign campaign credit. It records 32 distinct paid order IDs across all channels for Aug 3–9, 2026, by order-created date in UTC. Against capacity for 40 orders per week, that leaves numerical room for only eight more orders at this snapshot.
Do not add 25 and 10 platform-attributed purchases and call the result unique orders, new customers, or store orders. Platform credit can overlap. Likewise, do not call the $32.00 contribution assumption multiplied by platform purchases actual business contribution: it is a planning lens applied to attributed outcomes, not a deduplicated profit record.
Use platform outcomes for directional comparison, and use deduplicated all-channel orders plus capacity to limit the risk of scaling.
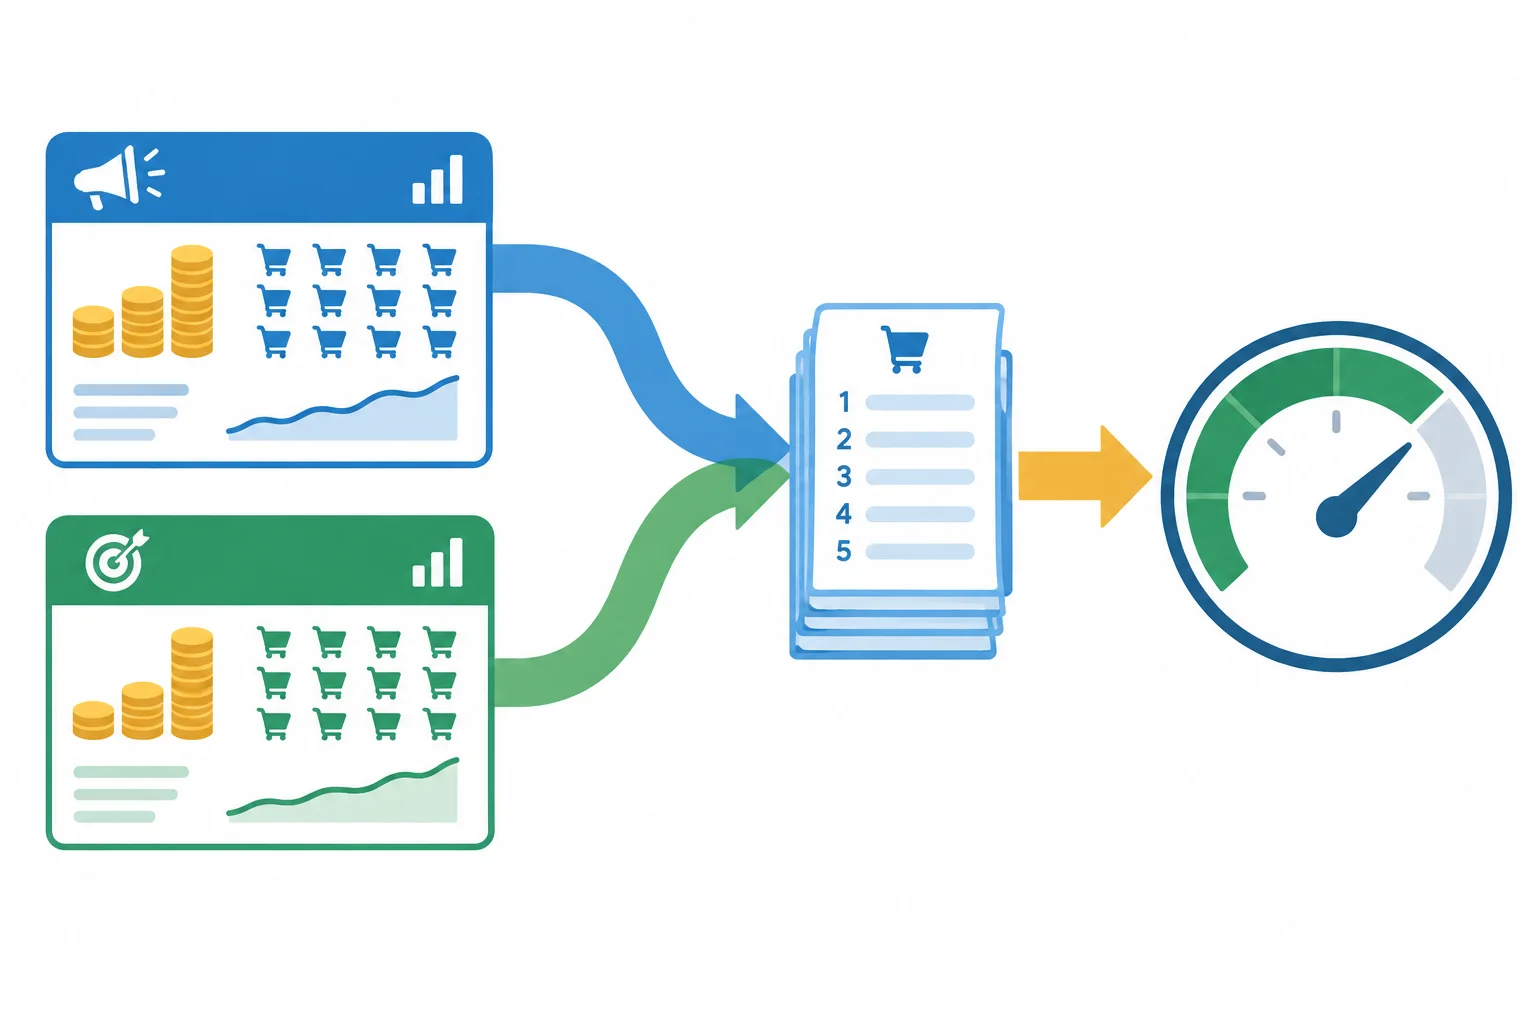
Overlapping platform attribution is not a deduplicated order total; the order ledger and capacity measure a different business constraint.
Search | Daypack has an observed $16.00 click-attributed purchase CPA, below the $24.00 guardrail. Meta | Prospecting has an observed $30.00 click-attributed purchase CPA, above it. This supports reducing exposure to the weaker observed acquisition outcome and cautiously testing whether additional qualified Search demand exists.
It does not mean the next Search dollars will repeat the recent average. Available demand, auction conditions, audience saturation, and delivery can change as allocation changes. The 32 paid all-channel orders also mean capacity can tighten through any channel, not only paid media.
Example
A bounded option transfers $70.00 from Meta | Prospecting to Search | Daypack. Search changes from $400.00 to $470.00; Meta changes from $300.00 to $230.00. The total remains within the $700.00 planning budget.
The expected direction is less spending in the campaign currently above the CPA guardrail while testing additional Search opportunity. It is not a promise of a particular CPA, purchase count, ROAS, or number of incremental orders. A downside condition is that the transfer should not be extended if mature, appropriately reconciled Search outcomes move above the guardrail or if confirmed all-channel paid orders approach the 40-order weekly capacity.
Warning
Holding the existing $400.00 / $300.00 allocation can be the stronger decision when purchase tracking is suspect, results are still provisional, the store record cannot be reconciled for the intended use, or fulfillment capacity is uncertain. A hold preserves the fixed planning budget while the uncertainty is checked; it is not an instruction to ignore the reports.
Northstar Bags has a fixed $700.00 seven-day planning budget. Search | Daypack reported a $16.00 click-attributed purchase CPA; Meta | Prospecting reported $30.00. The guardrail is $24.00, and the store recorded 32 distinct paid all-channel orders against capacity for 40. Which action is most defensible?
Write a 3–5 sentence recommendation for Northstar Bags. Choose either a bounded reallocation or a hold. State the resulting allocation within the $700.00 planning budget; use the two click-attributed purchase CPA values and the $24.00 guardrail; acknowledge that platform purchases can overlap; and account for 32 distinct paid all-channel orders against 40-order weekly capacity. State an expected direction and one condition that would prevent extending, or would reverse, the decision.
Do not project unchanged returns at higher spend.
Write at least 280 characters (0/280).

Step 7 of 8
Create a focused, reversible campaign change record with safeguards and lag-aware review conditions.
A controlled change log is not a claim that an edit caused a result. It records a cautious decision so another person can see what was observed, what remains uncertain, and how the decision will be checked.
Use these headings in this order:
Operational before-and-after monitoring can support a careful next decision. It cannot provide the causal certainty of a randomized A/B test.

Each part has a separate job: observation is not proof, and an expected effect is not a guaranteed result.
Keep the intervention interpretable. A budget transfer is one allocation intervention only when the audience, placements, creative, optimization event, and destination remain unchanged during the review period.
Changing a budget, audience, and creative at once may be operationally tempting, but it creates several explanations for any later movement. Material edits can also disturb delivery or begin a new adjustment period, depending on the platform and setting. Repeated edits make the record harder to interpret.
Use every heading to make the decision testable.
| Entry | What it should contain |
|---|---|
| Evidence | Dated observations, source, period, and counting basis. |
| Hypothesis | A plausible explanation that remains unproven. |
| Change | One bounded action and what stays unchanged. |
| Expected effect | A directional, measurable prediction; never a promise. |
| Guardrails | A spending limit, capacity check, or pause condition. |
| Review | A date plus mature-data and evidence requirements. |
| Wait or reverse | A reason to hold, stop, or undo the action. |
Example
Weak review rule: “Check results next week.”
Usable review rule: “Use a mid-period checkpoint for spend pacing only. Make an outcome decision after a complete business cycle, the stated attribution window, expected reporting latency, and the required purchase evidence are complete.”
A routine checkpoint is not an early declaration of success or failure.
When outcome reporting is not yet mature, the appropriate action may be to __ rather than call a winner or make another edit.
Repair the incomplete record below. Do not rewrite the existing Evidence or Hypothesis. Write five concise lines using exactly these headings: Change, Expected effect, Guardrails, Review, and Wait or reverse.
Evidence: Baseline snapshot dated Aug 18, 2026. For Aug 3–9, 2026 (UTC; campaign level; interaction-date; click-attributed platform results), Search | Daypack spent $400.00 USD for 25 click-attributed purchases, a $16.00 click-attributed purchase CPA. Meta | Prospecting spent $300.00 USD for 10 click-attributed purchases, a $30.00 click-attributed purchase CPA.
Hypothesis: A limited transfer toward Search | Daypack may be more efficient, but additional purchase cost is uncertain.
Decision packet: For Aug 19–25, transfer $70.00 from Meta | Prospecting to Search | Daypack while keeping the $700.00 USD seven-day planning budget fixed. The purchase-CPA guardrail is $24.00. Fulfillment capacity is 40 orders per week across all channels. Use a pacing-only checkpoint during the period; purchase outcomes need the 7-day click window and reporting latency to mature. Platform purchases must not be summed as unique orders; check store orders separately on their own counting and date basis.
Write at least 450 characters (0/450).

Step 8 of 8
Synthesize simulated Northstar Bags reporting into a concise, controlled optimization note with one focused route, an explicit budget decision, and lag-aware review rules.
Use this self-contained decision packet for Northstar Bags’ $80.00 daypack. The baseline period is Aug 3–9, 2026, UTC; the comparison period is Jul 27–Aug 2, 2026, UTC. The baseline snapshot is dated Aug 18, 2026, so the baseline 7-day click windows have had time to mature.
Google Ads uses 7-day click attribution. Meta uses 7-day click / 1-day view attribution; the campaign comparison below isolates click-attributed purchases using interaction-date reporting. Keep Meta view-attributed results separate.
The store ledger records 32 distinct paid all-channel order IDs for Aug 3–9, 2026, by order-created date in UTC. GA4 records 64 purchase events by event date. Investigate whether duplicate events or different counting definitions explain that difference before using GA4 to evaluate a change. Platform purchase totals can overlap, so they are not unique orders or new customers.
Case assumptions: $32.00 USD contribution per order before advertising and fixed costs; a $24.00 USD click-attributed purchase-CPA guardrail; a $700.00 USD seven-day planning budget; and capacity for 40 orders per week across all channels. The ledger leaves numerical room for eight more orders at this snapshot.
Simulated data — Sources: Google Ads and Meta Ads campaign reports; period: Aug 3–9, 2026; UTC interaction-date reporting; level: campaign; baseline snapshot dated Aug 18, 2026.
| Campaign | Delivery | Response | Click-attributed outcome | Spend | Cost outcome |
|---|---|---|---|---|---|
| Search | Daypack | 20,000 impressions | 800 clicks; CTR 4.0% | 25 click-attributed purchases; $2,000.00 click-attributed revenue | $400.00 USD | $16.00 click-attributed purchase CPA; 5.00x ROAS |
| Meta | Prospecting | 40,000 impressions; 16,000 reach; frequency 2.5 | 600 outbound clicks; Outbound CTR 1.5% | 10 click-attributed purchases; $800.00 click-attributed revenue | $300.00 USD | $30.00 click-attributed purchase CPA; 2.67x ROAS |
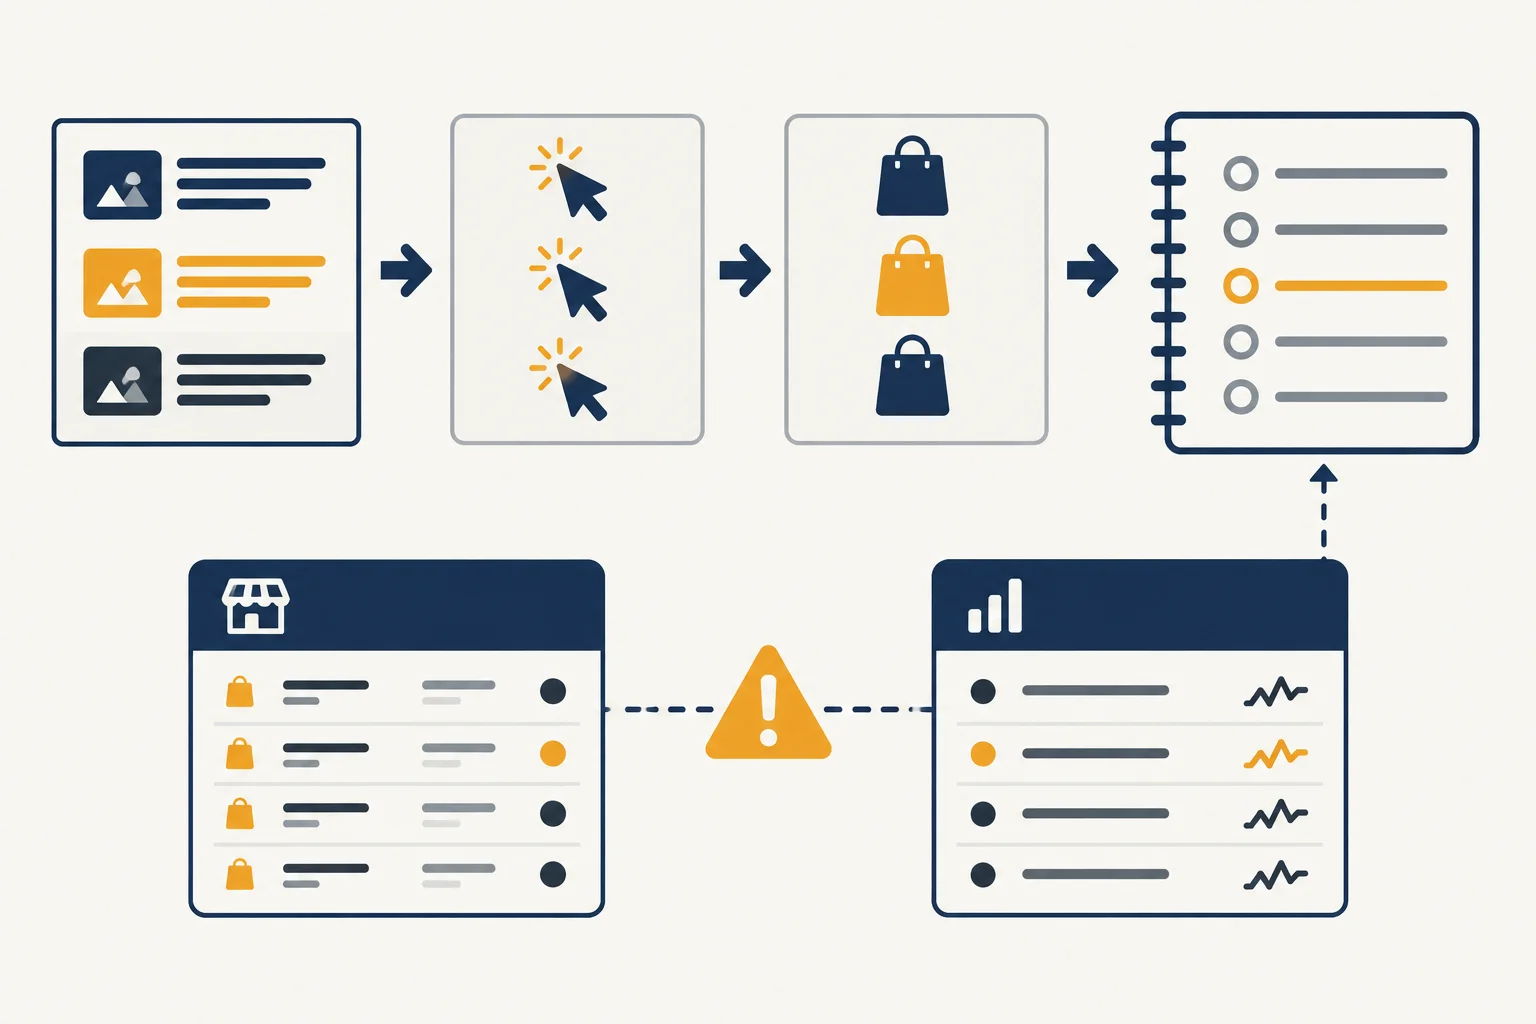
Use the evidence chain to locate an investigation. It does not prove a cause by itself.
A concise note separates what was observed from what is inferred and predicted.
Prioritize one primary campaign intervention. A reporting audit can occur alongside the decision, but do not combine a search-term, audience, placement, or creative edit with a budget-transfer test in the same review cycle.
Simulated data — Source: Google Ads search terms report; period: Aug 3–9, 2026; UTC interaction-date reporting; level: Search | Daypack campaign > Daypack Core ad group; baseline snapshot dated Aug 18, 2026.
| Search term | Clicks | Spend | Click-attributed purchases | Initial reading |
|---|---|---|---|---|
| Search term: backpack sewing pattern | 60 | $36.00 | 0 | Clearly mismatched intent |
| Search term: daypack for work | 18 | $10.80 | 0 | Potentially relevant; limited evidence |
| Search term: lightweight daypack | 150 | $75.00 | 6 | Useful wording; check claim fit |
| Search term: college daypack | 40 | $24.00 | 1 | Relevant category; limited evidence |
Select one route for the full note.
Route A — focused search action with a budget hold: Add Negative keyword: backpack sewing pattern (exact) at Daypack Core ad group scope. Keep Search | Daypack at $400.00 and Meta | Prospecting at $300.00. Make no other campaign edit during review. Audit the GA4-to-store discrepancy separately before relying on GA4 to evaluate results.
Route B — focused budget test: Transfer $70.00 from Meta | Prospecting to Search | Daypack, resulting in $230.00 and $470.00 respectively while keeping the $700.00 planning budget fixed. This is the sole campaign change: do not also edit search terms, audiences, placements, creative, optimization settings, or the destination during review. Audit the GA4-to-store discrepancy separately.
The observed Meta click-attributed purchase CPA is above the guardrail, but that pattern does not prove its cause or promise that additional Search spend will repeat its past result.
Summary
Before writing, verify that your note:
A useful note lets a colleague understand both the decision and its uncertainty.
Write the first part of one optimization note in 90–140 words. Use these headings exactly: Evidence, Hypothesis, Change.
Use one route from the prior screen. Explain the reporting check needed before relying on GA4, identify the most likely bottleneck from the decision packet, and name one alternative explanation. In Change, state only the focused action and its explicit budget decision. Keep the action limited to the selected route; do not add a second campaign intervention.
Write at least 420 characters (0/420).
Write the second part of the same note in 80–130 words. Use these headings exactly: Expected effect, Guardrails, Review, Wait or reverse.
Continue the route selected in Response 1; do not introduce another campaign change. Justify the budget decision, set a directional expected effect, and protect the fixed planning budget, the click-attributed purchase-CPA guardrail, and the weekly fulfillment capacity. State what remains unchanged. Require mature reporting and appropriately dated store-order evidence before continuing. Name conditions that would make you wait, stop, or reverse.
Write at least 360 characters (0/360).
Congratulations! You completed: Diagnose Paid Campaign Performance and Plan Changes
You completed this level!
Up next: Email Marketing and Automation
 Design a Permission-Based Email ListDesign a permission-based signup and subscriber-list structure for a hypothetical business. Specify useful segments, preference choices, and unsubscribe handling without collecting real personal data.
Thousands of online courses in video, ebooks and audiobooks.
To test your knowledge during online courses
Generated directly from your cell phone's photo gallery and sent to your email

Download our app via QR Code or the links below:.



Carry knowledge in your pocket.
Download the Cursa app.
There are hundreds of free courses available, with a free certificate of completion that is saved in your mobile image gallery.
Download the app to access the Course Completion Certificate for Free.

+ 10 million
students

Free and Valid
Certificate

60 thousand free
exercises

4.8/5 rating in
app stores

Free courses in
video and ebooks