
Step 1 of 8
Turn a Conversion Barrier into a Testable Hypothesis
Turn simulated usability evidence into a focused A/B test hypothesis without claiming a certain result.

Learning path · Level 6 · Tutorial 4
Write a practical A/B test brief and interpret simulated results without running an experiment or using paid testing software. Distinguish an observed improvement from evidence strong enough to justify a decision.

 Turn a Conversion Barrier into a Testable Hypothesis
Turn simulated usability evidence into a focused A/B test hypothesis without claiming a certain result. 3 min
 Make the Comparison Fair
Define eligibility and stable, concurrent visitor assignment so that Trailside’s control A and variation B can be compared fairly. 3 min
 Choose the Primary Metric and Guardrails
Define Trailside's purchase conversion metric and two guardrails before examining simulated results. 3 min
 Set the Stopping Plan Before Results Arrive
Predefine when Trailside enrolls, observes, analyzes, and pauses so results do not change the rules. 4 min
 Calculate Rates, Differences, and Uplift
Calculate the simulated purchase conversion rates, percentage-point difference, and relative uplift while keeping descriptive arithmetic separate from causal claims. 4 min
 Recognize an Observed Lead Without Declaring a Winner
Interpret simulated A/B test results carefully by comparing sample sizes, sensitivity to individual outcomes, and the limits of descriptive rates. 3 min
 Check Validity and Choose a Cautious Next Action
Diagnose invalid evidence, safety concerns, and valid but inconclusive simulated results before choosing a cautious next action. 3 min
 Complete the Test Brief and Decision Note
Integrate a predeclared A/B test plan with simulated final results, then write a cautious decision note that separates observed improvement from evidence still needed. 3 min
Step 1 of 8
Turn simulated usability evidence into a focused A/B test hypothesis without claiming a certain result.
A/B testing compares two versions at the same time: control A is the current experience, and variation B contains one deliberate change. The purpose is a fair comparison, not a before-and-after story that could be affected by a different day, audience, or traffic mix.
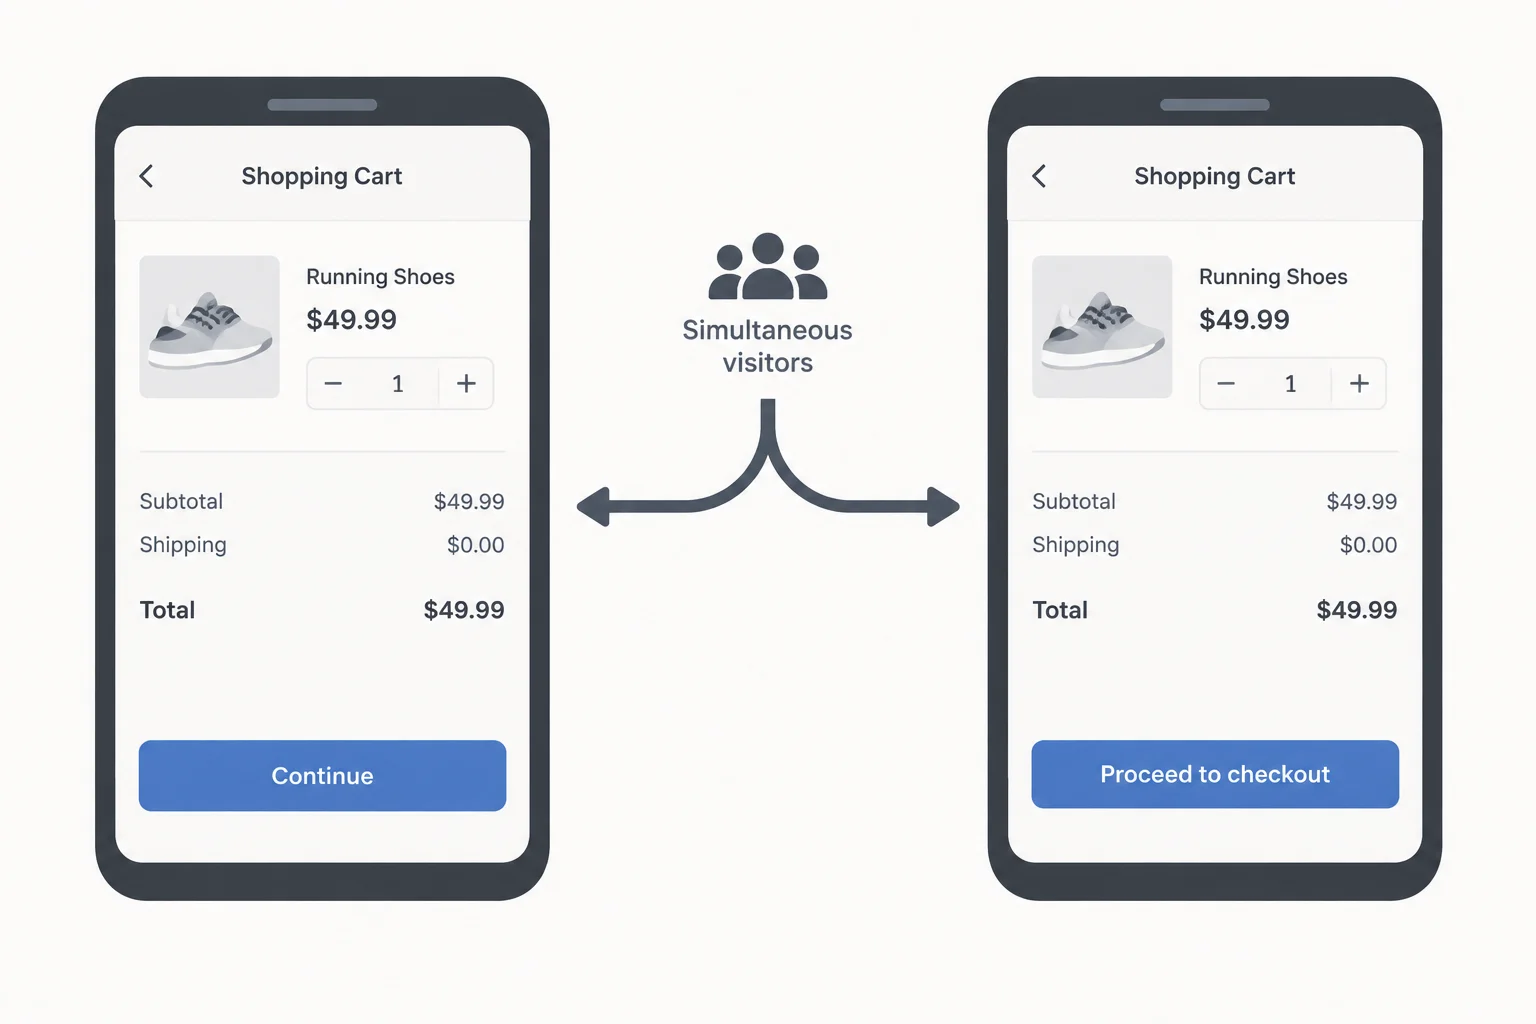
Control A and variation B should differ in one focused element, while they are viewed during the same period.
Trailside has simulated evidence: 3 of 5 observed mobile shoppers hesitated because the cart button's next step was unclear. This observation is a reason to test a clearer label. It is not proof that a new label will increase purchases.
A useful hypothesis has four parts:
Keep the test focused. If button copy, layout, pricing, and checkout behavior all change together, you cannot tell which change may be related to an outcome.
Example
Evidence and hypothesis — simulated case
Observed evidence: 3 of 5 observed mobile shoppers hesitated because the cart button's next step was unclear.
Control A keeps the label Continue. Variation B changes only that label to Proceed to checkout; no other copy, layout, pricing, or checkout behavior changes.
Hypothesis: Because some observed mobile shoppers hesitated at an unclear next step, changing only the cart button label from “Continue” to “Proceed to checkout” may reduce that uncertainty and may increase completed purchases.
Tip
Do not treat the hypothesis as a prediction guaranteed to come true. It states what the change is expected to do and why; later evidence is needed to evaluate the expectation.
Using the simulated Trailside case, identify control A and the single element changed in variation B. Then write one hypothesis that includes: the observed evidence, the proposed change, an expected purchase outcome, and a reason. Phrase the outcome as a possibility, not a certainty.
Write at least 180 characters (0/180).

Step 2 of 8
Define eligibility and stable, concurrent visitor assignment so that Trailside’s control A and variation B can be compared fairly.
Set comparison rules before outcomes appear. For Trailside, eligible visitors are mobile cart visitors. Staff and known bots are excluded using rules fixed before assignment. Apply those same eligibility rules to control A and variation B; do not add or remove visitor groups after seeing outcomes.
Randomly assign each eligible visitor to control A or variation B with a planned 50/50 allocation. This is a target allocation, not a promise that final counts will be exactly equal.
Use one stable, permitted visitor identifier to assign a version consistently. A returning visitor keeps the original version rather than being reassigned on every pageview. The identifier supports consistency, but it does not reliably identify one person across devices.
Run both versions concurrently. Do not deliberately send one version a different traffic source or device population.

Apply the same entry rules first, then assign each eligible visitor once and preserve that assignment on return visits.
Tip
Fair does not mean that the two groups contain identical people or exactly equal final totals. It means both versions use the same predeclared eligibility rules and receive visitors concurrently through random assignment, without deliberately separating traffic sources or device populations.
Match each design choice to its comparison consequence.
Tap an item and then its matching pair.
Trailside is considering four assignment proposals:
In 3–5 sentences, identify which proposal is valid. Explain why the other three do not support a fair comparison, and state exactly how a returning visitor should be handled.
Write at least 180 characters (0/180).
Step 3 of 8
Define Trailside's purchase conversion metric and two guardrails before examining simulated results.
The hypothesis concerns confirmed purchases, so Trailside should predefine one primary metric that represents that outcome—not select whichever number later looks most favorable.
Use this simulated-case definition:
purchase conversion rate = purchasing visitors / eligible assigned visitors × 100
A purchasing visitor is an eligible assigned visitor with at least one confirmed purchase within 7 days of first assignment. Count each visitor once, even if they return or place multiple orders.
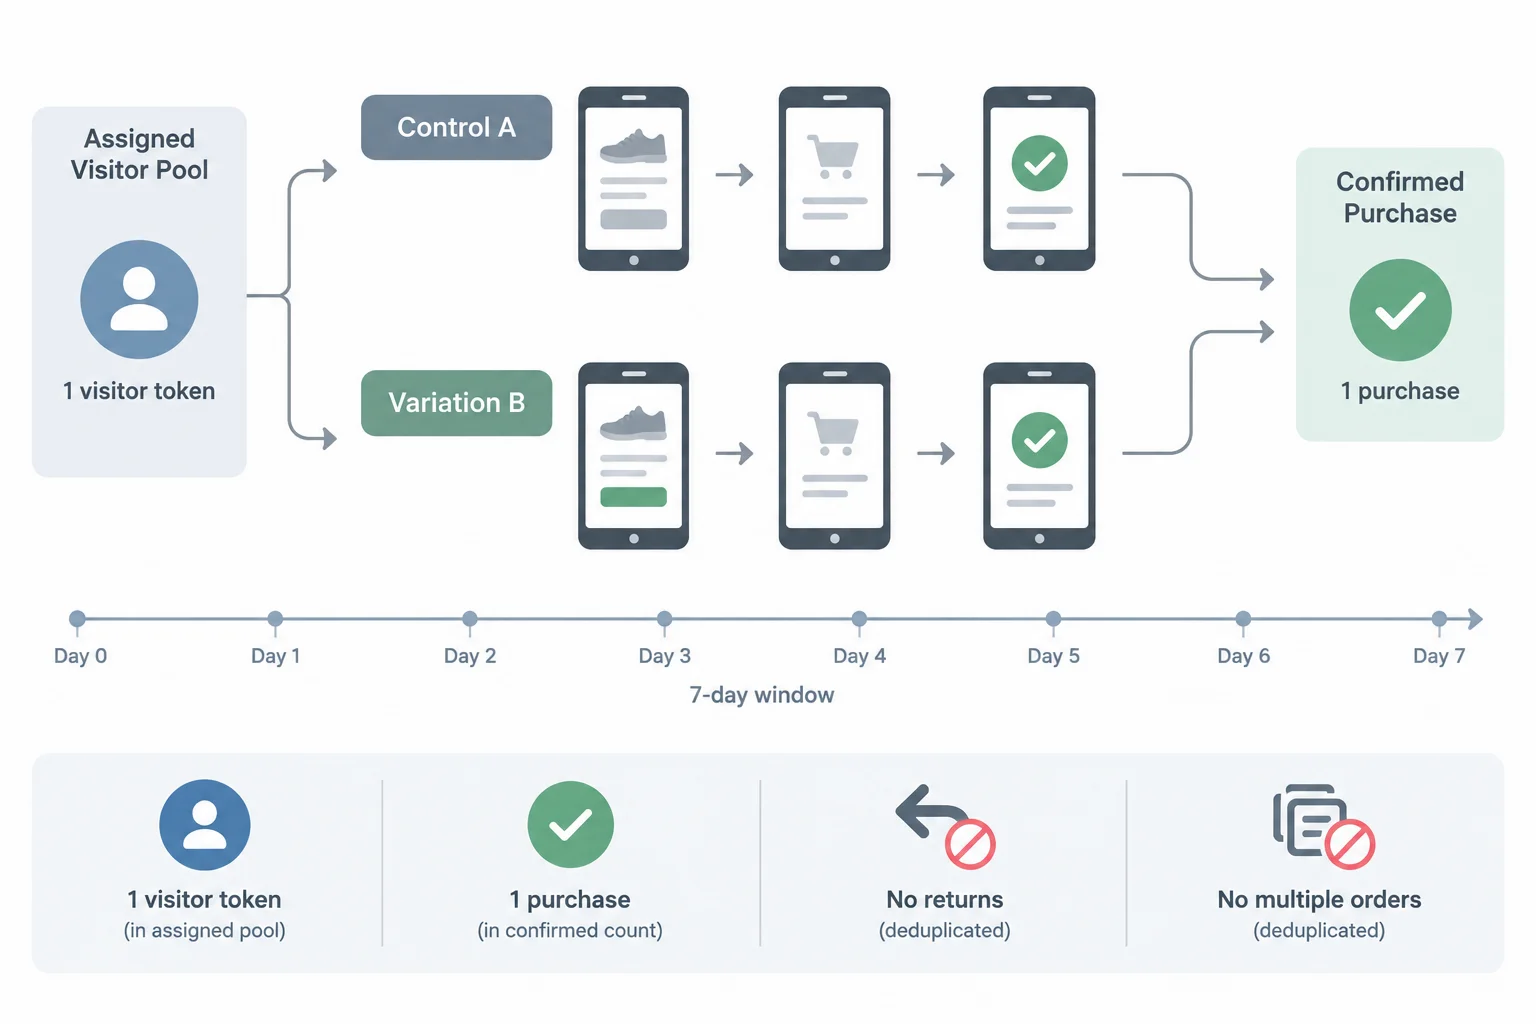
The counting unit is the visitor. A return visit or an additional order does not create another visitor count.
Use the same definition for control A and variation B.
| Part | Include | Do not substitute |
|---|---|---|
| Numerator | Eligible assigned visitors with at least one confirmed purchase within 7 days | Button clicks, sessions, or total orders |
| Denominator | All eligible assigned visitors | Only visitors who clicked or reached checkout |
| Counting rule | Each visitor once | One count per visit or per order |
An observed improvement in the primary metric could conceal a harmful side effect. Guardrails are predefined checks for those effects.
For Trailside, measure both guardrails over the same 7-day window, using affected eligible assigned visitors divided by all eligible assigned visitors. Apply the same event definitions and counting rules to control A and variation B.
These alert thresholds are simulated-case rules. They indicate when to investigate; they do not prove that smaller changes are harmless.
| Guardrail | Affected visitors | Alert threshold versus control A |
|---|---|---|
| checkout error rate | Eligible assigned visitors with a checkout error | Increase of at least +1.0 pp |
| checkout-related support-contact rate | Eligible assigned visitors with a checkout-related support contact | Increase of at least +0.5 pp |
Complete the simulated Trailside metric specification. Use the exact counting roles taught in this step.
purchase_conversion_rate:
  numerator: ""
  denominator: ""
  observation_window: " from first assignment"

cart_button_click: ""
checkout_error: ""
checkout_related_support_contact: ""
Step 4 of 8
Predefine when Trailside enrolls, observes, analyzes, and pauses so results do not change the rules.
A stopping plan is written before results are examined. It states when Trailside stops enrolling visitors, when it can analyze outcomes, and what exceptions justify action during the test.
For this simulated case:
Writing these rules first prevents a temporary result from deciding when the test ends.
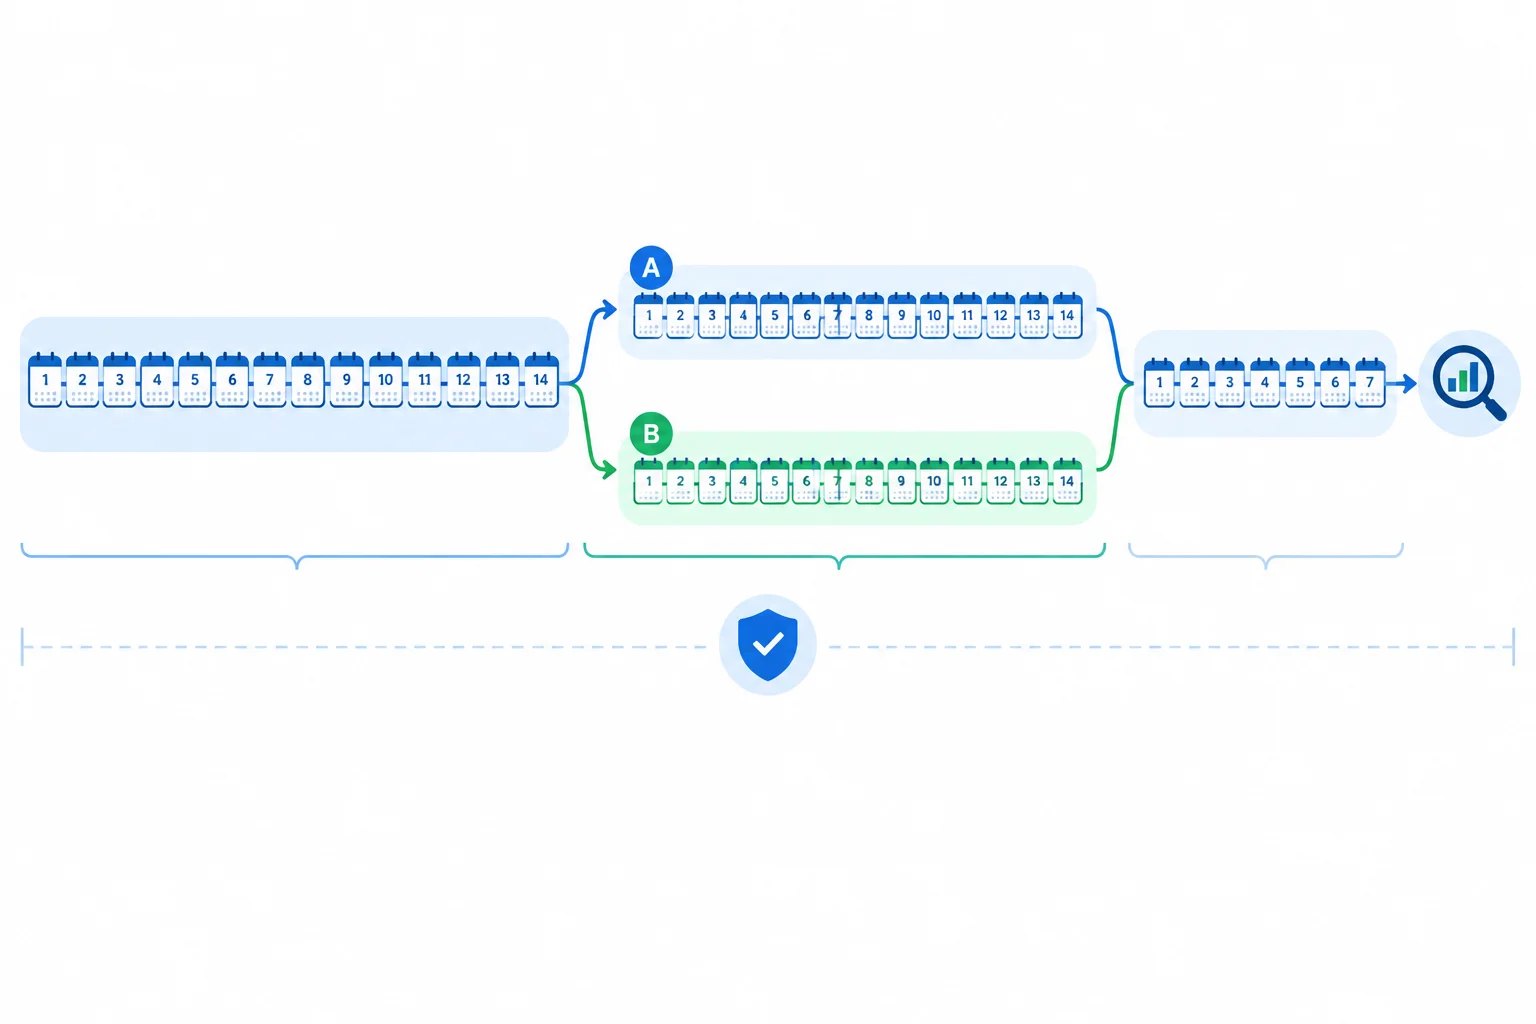
Trailside enrolls for 14 consecutive days. The analysis date comes after the final enrolled visitor has had 7 days of follow-up.
Example
Example stopping-plan wording for the simulated Trailside case:
“Enroll eligible visitors for 14 consecutive days using the planned 50/50 allocation. Require 1,000 eligible visitors per version as an operational exposure requirement. After enrollment ends, wait until every enrolled visitor has had 7 days of follow-up before final analysis. Do not end early for a numerical lead or extend enrollment after the deadline to seek more favorable results.”
The 14-day period covers two weekly cycles in this simulated case. That can reduce the chance that a single weekday pattern dominates the comparison, but business cycles vary. It is a case choice, not a universal duration.
The requirement of 1,000 eligible visitors per version is also an operational case assumption. It does not, by itself, show that the comparison has enough evidence for a reliable decision. Real planning depends on factors such as the baseline rate and the effect worth detecting.
During enrollment and follow-up, Trailside may perform planned measurement and safety checks. A guardrail alert should be investigated using the predefined thresholds:
A confirmed checkout-blocking defect requires an immediate safety pause. This safety action is separate from any primary-metric result.
Warning
Do not declare an observed improvement to be a winner because it appears before the planned end. Likewise, if either version is below 1,000 eligible visitors when day 14 ends, do not extend the test opportunistically.
Finish the planned follow-up, record that exposure was insufficient, and treat the result cautiously. Investigate a guardrail alert; pause immediately only for a confirmed checkout-blocking defect.
Match each simulated Trailside situation to the correct stopping-plan response.
Tap an item and then its matching pair.

Step 5 of 8
Calculate the simulated purchase conversion rates, percentage-point difference, and relative uplift while keeping descriptive arithmetic separate from causal claims.
The Simulated final results below come from Trailside’s completed test. This step uses only the purchase counts to produce three descriptive results: each purchase conversion rate, their percentage-point difference, and relative uplift. Guardrail counts are included for the later interpretation step.
All figures are simulated. Control A appears first, followed by variation B.
| Version | Eligible visitors | Purchasing visitors | Checkout errors | Support contacts |
|---|---|---|---|---|
| control A | 1,000 | 40 | 20 | 10 |
| variation B | 1,000 | 50 | 22 | 11 |
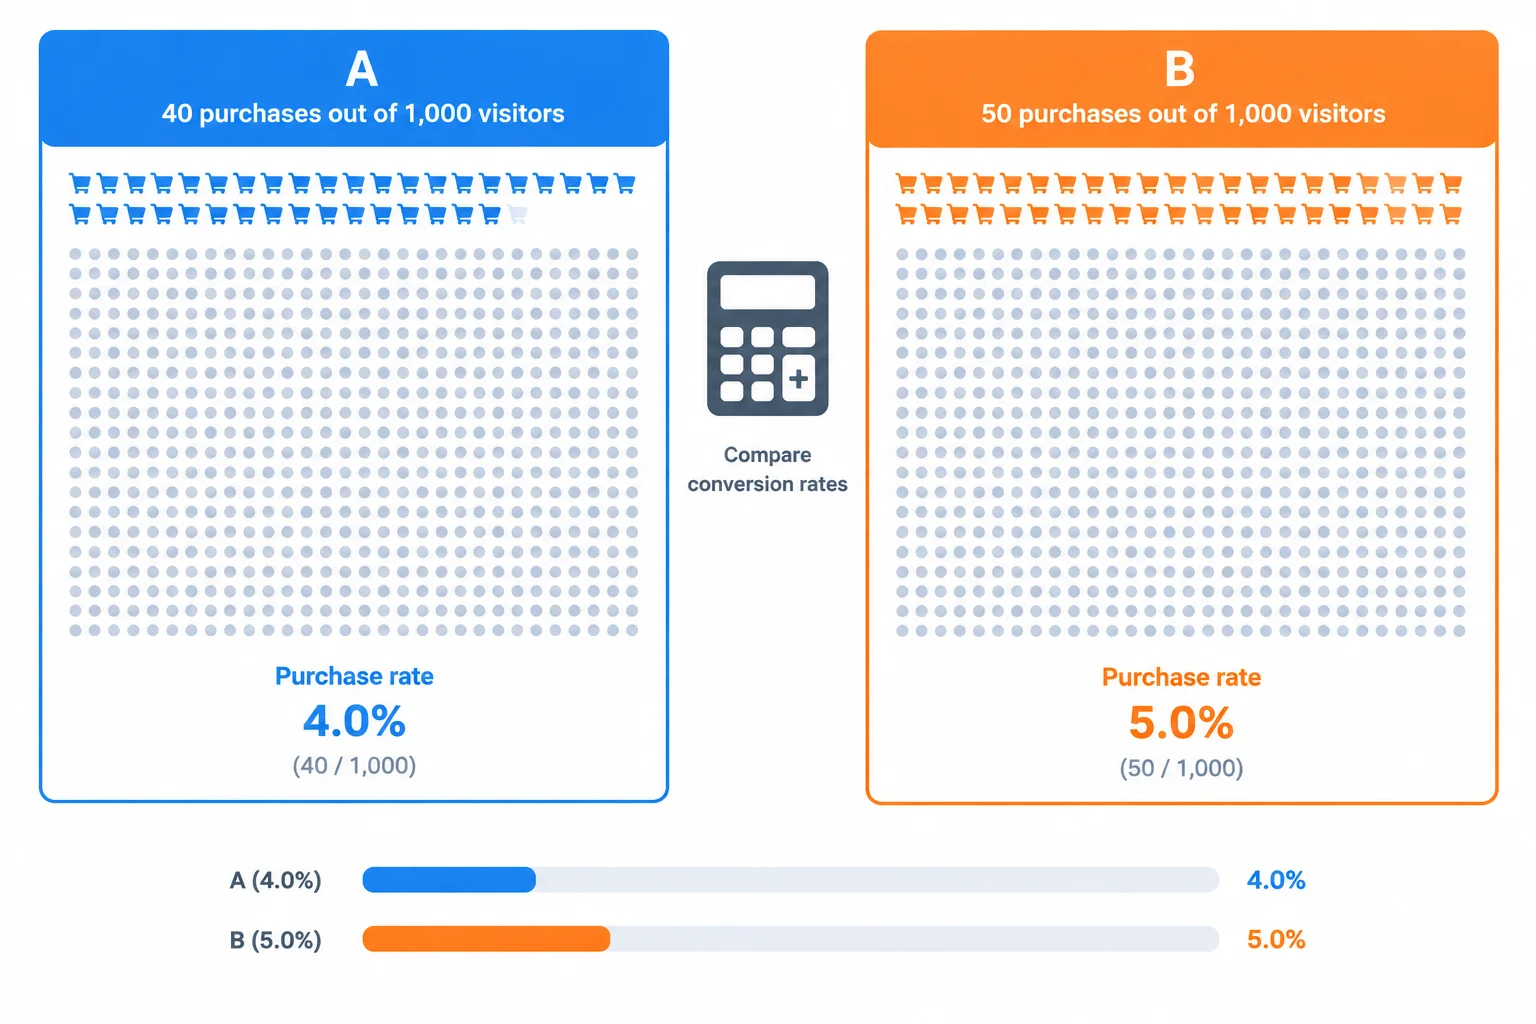
A rate is calculated within each assigned version, not from a combined denominator.
Use the predefined formula:
conversion rate = purchasing visitors / eligible assigned visitors × 100
Count purchasing visitors once, and use the eligible assigned visitors for that same version as the denominator. Do not substitute sessions, button clicks, or total orders.
For control A:
40 / 1,000 × 100 = 4.0%
For variation B:
50 / 1,000 × 100 = 5.0%
Tip
The arithmetic answers a descriptive question: what proportion of each assigned group purchased within the specified window? It does not by itself show that the button label reliably caused the difference.
Example
Report the two rates with their version names: control A is 4.0%; variation B is 5.0%. Naming both the numerator-based rate and its version prevents a comparison from becoming ambiguous.
Subtract percentage-valued rates in percentage points (pp):
5.0% - 4.0% = +1.0 pp
Then calculate the change relative to the control rate:
relative uplift = (rate B - rate A) / rate A × 100
For Trailside:
(5.0% - 4.0%) / 4.0% × 100 = +25%
The same observed change can therefore be described as +1.0 pp or +25% relative uplift. These are different units.
Warning
Do not call a move from 4.0% to 5.0% a “1% relative improvement.” The absolute change is +1.0 percentage point; the relative uplift uses 4.0% as its baseline and is +25%. For now, call this an observed improvement, not proof of a reliable effect.
Which summary correctly describes the simulated purchase result?
Using these simulated purchase counts—control A: 40 purchasing visitors out of 1,000 eligible assigned visitors; variation B: 50 out of 1,000—write one compact result statement. Include both conversion rates, the percentage-point difference, and relative uplift. Use the term “observed improvement”; do not describe the uplift as a 1% relative improvement.
Write at least 55 characters (0/55).
Step 6 of 8
Interpret simulated A/B test results carefully by comparing sample sizes, sensitivity to individual outcomes, and the limits of descriptive rates.
An observed improvement means that variation B’s rate was higher in the visitors observed for this test. It does not, by itself, show that the button label caused a reliable effect.
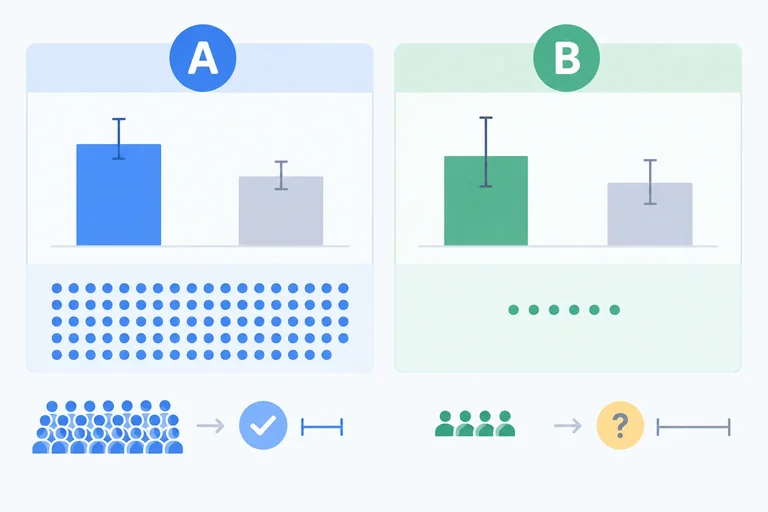
Even with concurrent random assignment, each version receives a different mix of visitor outcomes. Some differences between observed rates can arise from chance variation. The same percentage pattern can therefore be more fragile in a small sample than in a larger one.
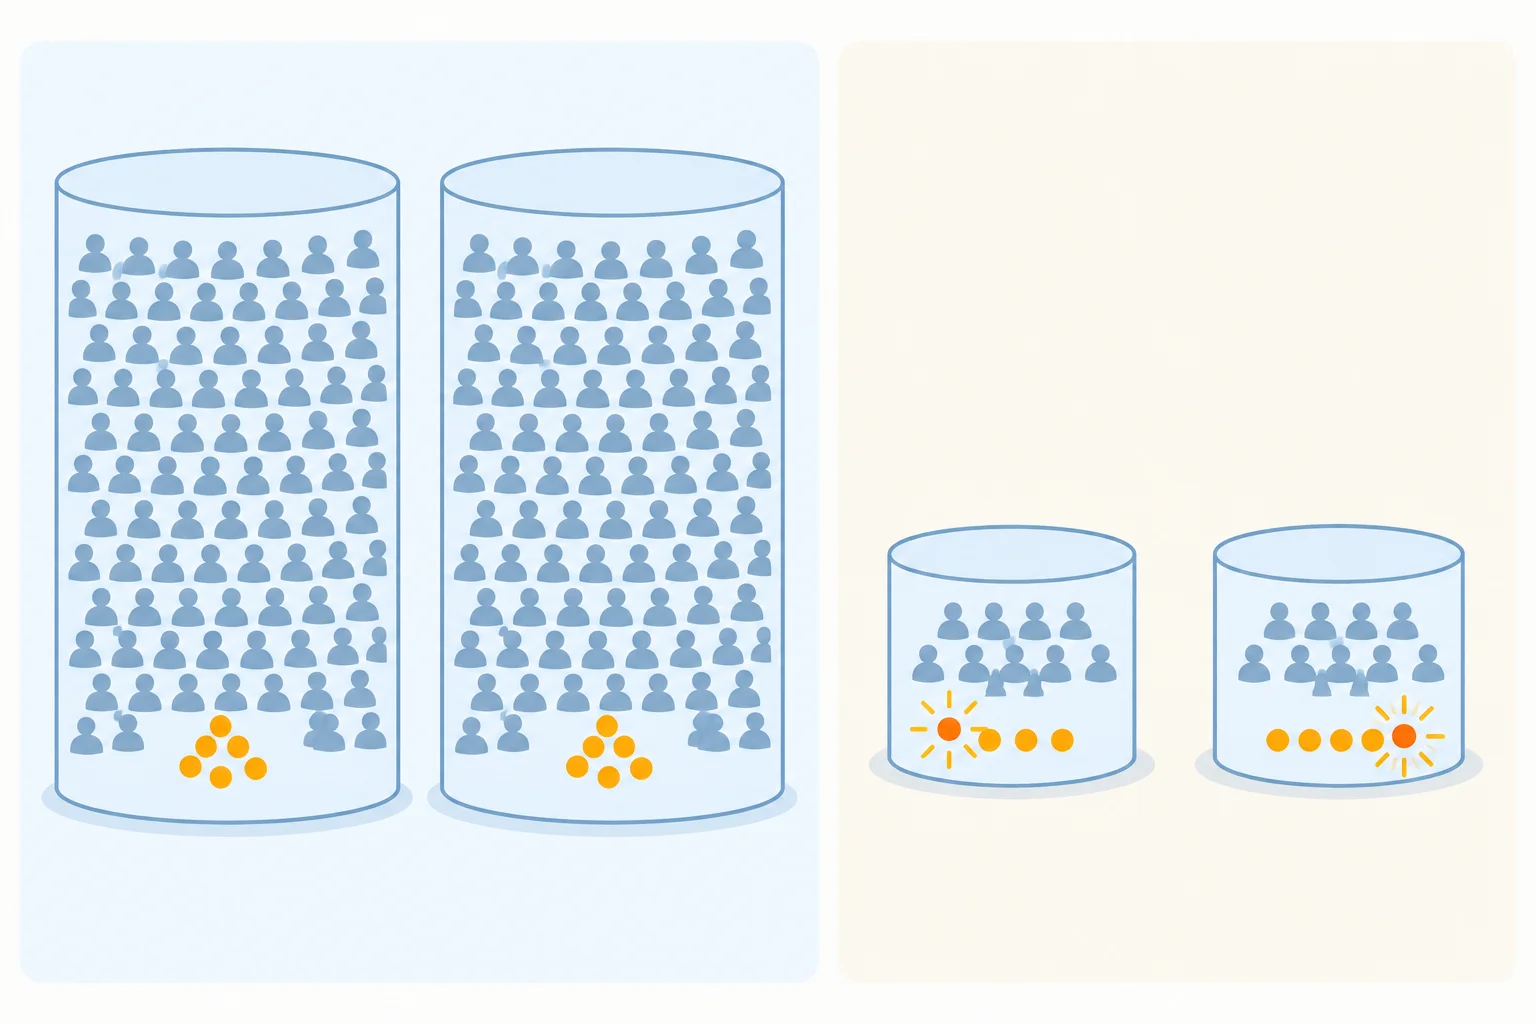
The same rate pattern can be based on very different numbers of visitors and purchases. A single outcome changes a small denominator more sharply.
These are separate simulated datasets. They produce the same descriptive purchase rates, difference, and relative uplift—but not the same amount of information.
The main case dataset. Control A appears before variation B.
| Version | Eligible visitors | Purchasing visitors | Conversion rate |
|---|---|---|---|
| control A | 1,000 | 40 | 4.0% |
| variation B | 1,000 | 50 | 5.0% |
A separate illustration, not an additional segment of the main dataset.
| Version | Eligible visitors | Purchasing visitors | Conversion rate |
|---|---|---|---|
| control A | 100 | 4 | 4.0% |
| variation B | 100 | 5 | 5.0% |
Warning
In both simulated datasets, 5.0% - 4.0% = +1.0 pp and relative uplift = (rate B - rate A) / rate A × 100 = +25%.
But one purchase equals 1.0 percentage point out of 100 visitors and only 0.1 percentage point out of 1,000 visitors. If variation B had one fewer purchase in the small-sample illustration, its rate would fall from 5.0% to 4.0%.
Which statement best interprets the two simulated datasets?
Write three short sentences about the two simulated datasets: compare their per-version sample sizes; explain how one purchase changes the rate in the 100-visitor illustration; and classify whether the displayed rate difference alone justifies a claim of a reliable effect.
Write at least 150 characters (0/150).

Step 7 of 8
Diagnose invalid evidence, safety concerns, and valid but inconclusive simulated results before choosing a cautious next action.
Before interpreting an observed improvement, verify that both versions produced comparable evidence. A comparison can be invalid when one version has duplicate purchase recording, missing purchase events, mixed counting units, or a changed definition.
For Trailside, both versions must count each eligible assigned visitor once under the same confirmed-purchase rule and the same 7-day window. If variation B records a confirmed purchase twice while control A records it once, the reported conversion rates do not describe a fair comparison.
Also investigate incomplete follow-up or an unexpected assignment imbalance that suggests an allocation, traffic, or eligibility problem. Do not automatically explain either issue as an effect of the button label.
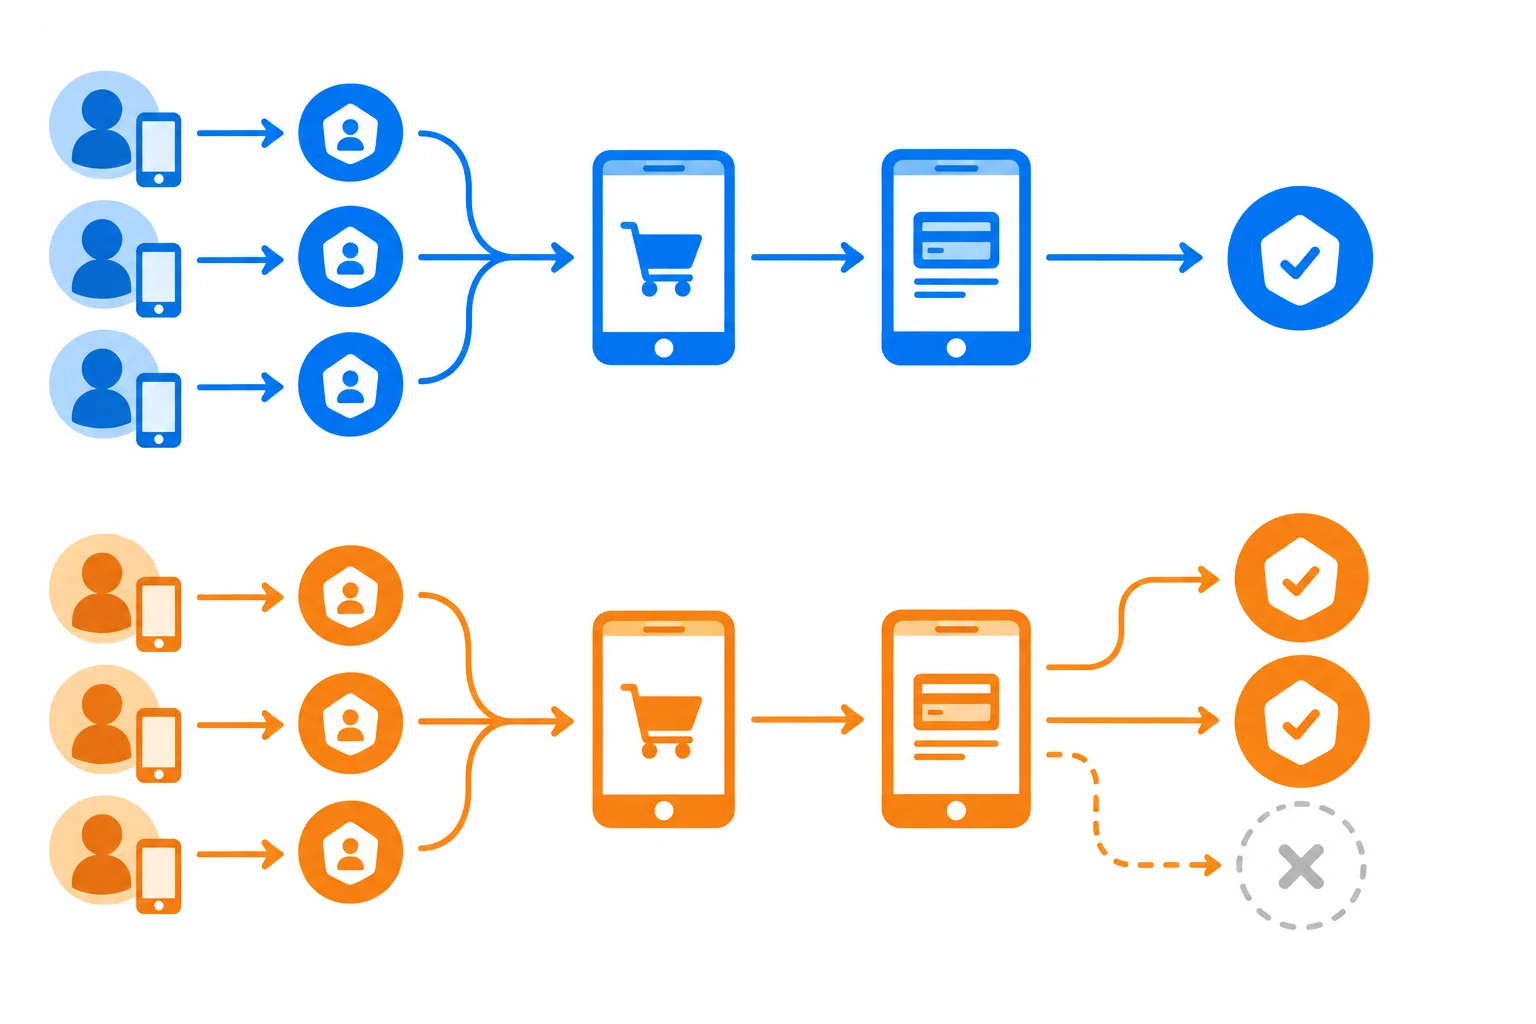
Comparable measurement requires the same visitor-based definitions and event recording in control A and variation B.
Warning
Do not repair an inconvenient result after seeing it. Do not switch the primary metric, remove selected visitors, or extend the same test only because the result currently looks promising. Investigate a flaw transparently; if needed, plan a separate valid test.
The simulated final results should be reviewed against the predeclared increases versus control A. Guardrails are harm checks; they do not turn the purchase result into proof of a reliable effect.
Simulated final guardrail review
| Guardrail | control A | variation B | Increase vs control A | Alert threshold | Status |
|---|---|---|---|---|---|
| checkout error rate | 2.0% | 2.2% | +0.2 pp | +1.0 pp | Below alert |
| checkout-related support-contact rate | 1.0% | 1.1% | +0.1 pp | +0.5 pp | Below alert |
Example
The simulated increases are below the predeclared alert thresholds. That is useful evidence, but it does not prove that variation B cannot cause harm. A confirmed checkout-blocking defect is different: pause exposure immediately and investigate, regardless of these percentages.
Match each simulated diagnostic situation with its most appropriate immediate response.
Match each situation to the appropriate action.
Tap an item and then its matching pair.
Write three short bullets, one for each simulated situation:
A. An audit finds that variation B excludes confirmed orders made with one payment method, while control A includes them.
B. A confirmed checkout-blocking defect appears in variation B.
C. Measurement is comparable, enrollment and follow-up are complete, and the observed purchase rates are 4.0% for control A and 5.0% for variation B. Both guardrails remain below their alert thresholds, but no formal uncertainty assessment is supplied.
For each, state the next action and explain why it differs from the other two.
Write at least 180 characters (0/180).

Step 8 of 8
Integrate a predeclared A/B test plan with simulated final results, then write a cautious decision note that separates observed improvement from evidence still needed.
Your final deliverable has two parts: a test brief written before results, then a decision note written from the simulated final results. Keep the plan fixed when you interpret the data.
Use these brief headings exactly:
Use these decision-note headings exactly:
The simulated evidence is that 3 of 5 observed mobile shoppers hesitated because the cart button’s next step was unclear. This motivates a hypothesis; it does not prove that a new label will increase purchases.
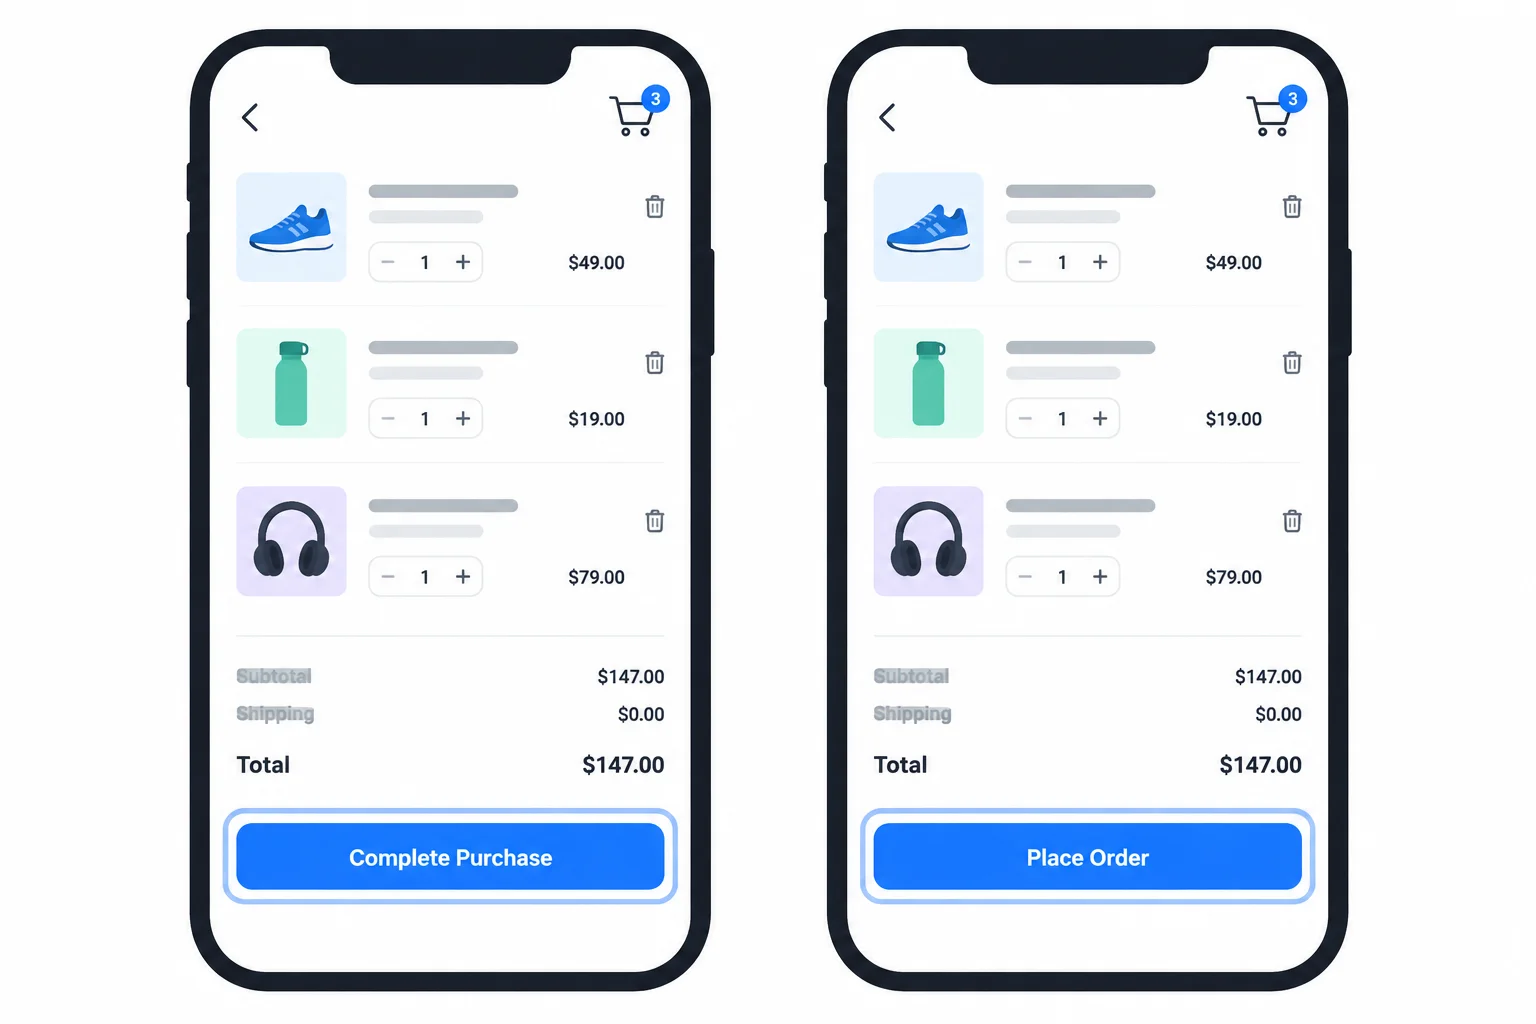
For Trailside, control A uses “Continue” and variation B uses “Proceed to checkout.” No other copy, layout, pricing, or checkout behavior changes.
Write the hypothesis as a connection: because the simulated observation suggests that the next step is unclear, changing only the cart-button label may increase confirmed purchases. Name control A and variation B precisely; do not add a second change to the variation.
For Assignment, specify eligible mobile cart visitors. Exclude staff and known bots using rules set before assignment. Randomly allocate eligible visitors 50/50 using one stable, permitted visitor identifier for assignment and counting. Returning visitors keep their original version. The identifier does not reliably identify a person across devices, and both versions run concurrently for comparable traffic.
Use the following predeclared definitions in the brief. The primary metric is purchase conversion rate = purchasing visitors / eligible assigned visitors × 100. Count eligible assigned visitors with at least one confirmed purchase within 7 days of first assignment. Count each visitor once in each relevant numerator or denominator.
The guardrails use the same eligible assigned visitors and 7-day window: checkout error rate and checkout-related support-contact rate. Their alert thresholds are increases versus control A of at least +1.0 pp and +0.5 pp, respectively.
The stopping plan is 14 consecutive enrollment days, an operational exposure requirement of 1,000 eligible visitors per version, then final analysis only after every enrolled visitor has had 7 days of follow-up. If exposure is insufficient at the deadline, do not extend opportunistically. A confirmed checkout-blocking defect requires an immediate safety pause.
Enrollment and follow-up are complete. This is the main simulated dataset; it is not a live experiment.
| Version | Eligible visitors | Purchasing visitors | Checkout errors | Support contacts |
|---|---|---|---|---|
| control A | 1,000 | 40 | 20 | 10 |
| variation B | 1,000 | 50 | 22 | 11 |
Purchase conversion rate: control A is 40 / 1,000 × 100 = 4.0%; variation B is 50 / 1,000 × 100 = 5.0%. The observed difference is 5.0% - 4.0% = +1.0 pp. Relative uplift = (rate B - rate A) / rate A × 100 = +25%.
For guardrails, checkout error rate is 2.0% for control A and 2.2% for variation B: an increase of +0.2 pp. Support-contact rate is 1.0% and 1.1%: an increase of +0.1 pp. Neither reaches its alert threshold.
These are descriptive simulated results. No formal uncertainty assessment is supplied, so the observed improvement is not evidence enough to declare a winner or statistical significance.
Before you write the decision note, make these distinctions:
Summary
Use your response to show that you can connect design, arithmetic, guardrails, and uncertainty without overstating what simulated rates establish.
Submit one concise response with all eight required headings, in this order:
Evidence and hypothesis
Control and variation
Assignment
Metrics and guardrails
Stopping plan
Observed result
Limitations
Next action
In the brief, specify the focused hypothesis, the unchanged elements, consistent assignment and eligibility, the primary-metric counting rule, both guardrails and thresholds, and the stopping plan. In the decision note, report the calculated purchase comparison in both required forms, assess both guardrails against their thresholds, identify what evidence is missing, and recommend a cautious next action. Do not claim a winner, statistical significance, or proven equivalence.
Write at least 700 characters (0/700).
Congratulations! You completed: Design and Interpret a Simple A/B Test
You completed this level!
Up next: Paid Media and Budget Optimization
 Draft a Google Ads Search CampaignDraft the structure and targeting of a Google Ads Search campaign in a text document, connecting search intent to ad groups, keywords, exclusions, and destinations. No advertising account, payment details, or live campaign is required.
Thousands of online courses in video, ebooks and audiobooks.
To test your knowledge during online courses
Generated directly from your cell phone's photo gallery and sent to your email

Download our app via QR Code or the links below:.



Carry knowledge in your pocket.
Download the Cursa app.
There are hundreds of free courses available, with a free certificate of completion that is saved in your mobile image gallery.
Download the app to access the Course Completion Certificate for Free.


+ 10 million
students

Free and Valid
Certificate

60 thousand free
exercises

4.8/5 rating in
app stores

Free courses in
video and ebooks