
Step 1 of 9
Separate Bidding from Budgeting
Learn to distinguish a bidding strategy, a bid, observed costs, and a spending budget before choosing any platform-specific settings.

Learning path · Level 7 · Tutorial 4
Choose an introductory bidding and budget approach for a hypothetical campaign and build a transparent forecast using simple arithmetic. Evaluate whether apparently strong advertising returns could still leave the business unprofitable, without spending money.

 Separate Bidding from Budgeting
Learn to distinguish a bidding strategy, a bid, observed costs, and a spending budget before choosing any platform-specific settings. 2 min
 Match Bidding to the Goal and the Signals
Match a Google Ads or Meta delivery approach to the intended outcome and the quality of the available measurement signal. 3 min
 Build a Bounded Spending and Pacing Plan
Translate Northstar Goods' hypothetical authorization into a paced, platform-aware spending plan with safeguards. 3 min
 Choose Where Meta Controls the Budget
Choose between shared campaign-level budgeting and direct ad-set-level allocation for a hypothetical Meta campaign. 2 min
 Calculate Metrics with the Right Denominators
Use one simulated campaign report to calculate paid-media efficiency metrics with explicit denominators and distinguish purchase actions from verified new customers. 3 min
 Build a Transparent Base Forecast
Build a transparent 30-day Expected forecast for Northstar Goods from hypothetical spend, CPC, purchase conversion rate, and average order value. 3 min
 Replace One Prediction with a Scenario Range
Compare Conservative, Expected, and Optimistic forecast assumptions for Northstar Goods, then communicate what the range can and cannot claim. 3 min
 Check Whether the Revenue Can Cover the Costs
Calculate ROAS and modeled contribution, then explain why a positive-looking advertising return may still leave the business unprofitable. 3 min
 Finish Your Bidding, Budget, and Forecast Brief
Create a concise hypothetical campaign brief that joins a bidding choice, a bounded budget, a scenario forecast, and a cost-aware conclusion. 3 min
Step 1 of 9
Learn to distinguish a bidding strategy, a bid, observed costs, and a spending budget before choosing any platform-specific settings.
Northstar Goods sells desk lamps. In this tutorial, you will plan one hypothetical purchase campaign—no account creation, payment details, or live advertising.
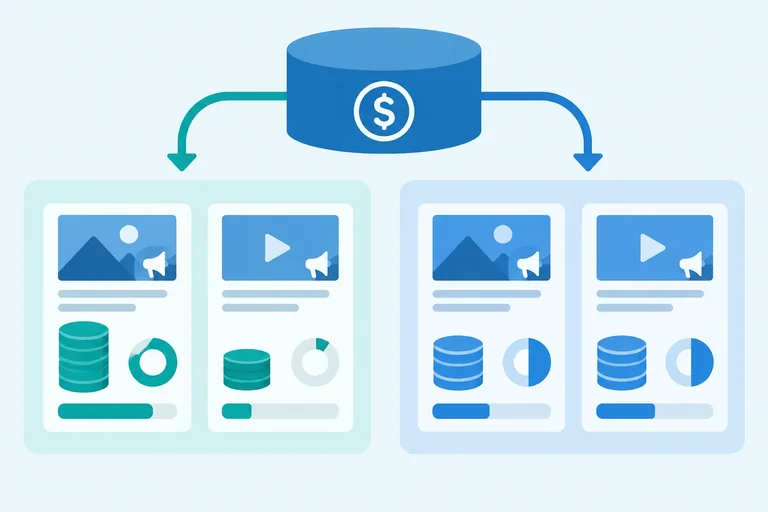
The planning brief authorizes a maximum of $1,200.00 in ad spend for one 30-day calendar month. Keep two decisions separate:
A campaign can have both decisions, but they answer different questions.
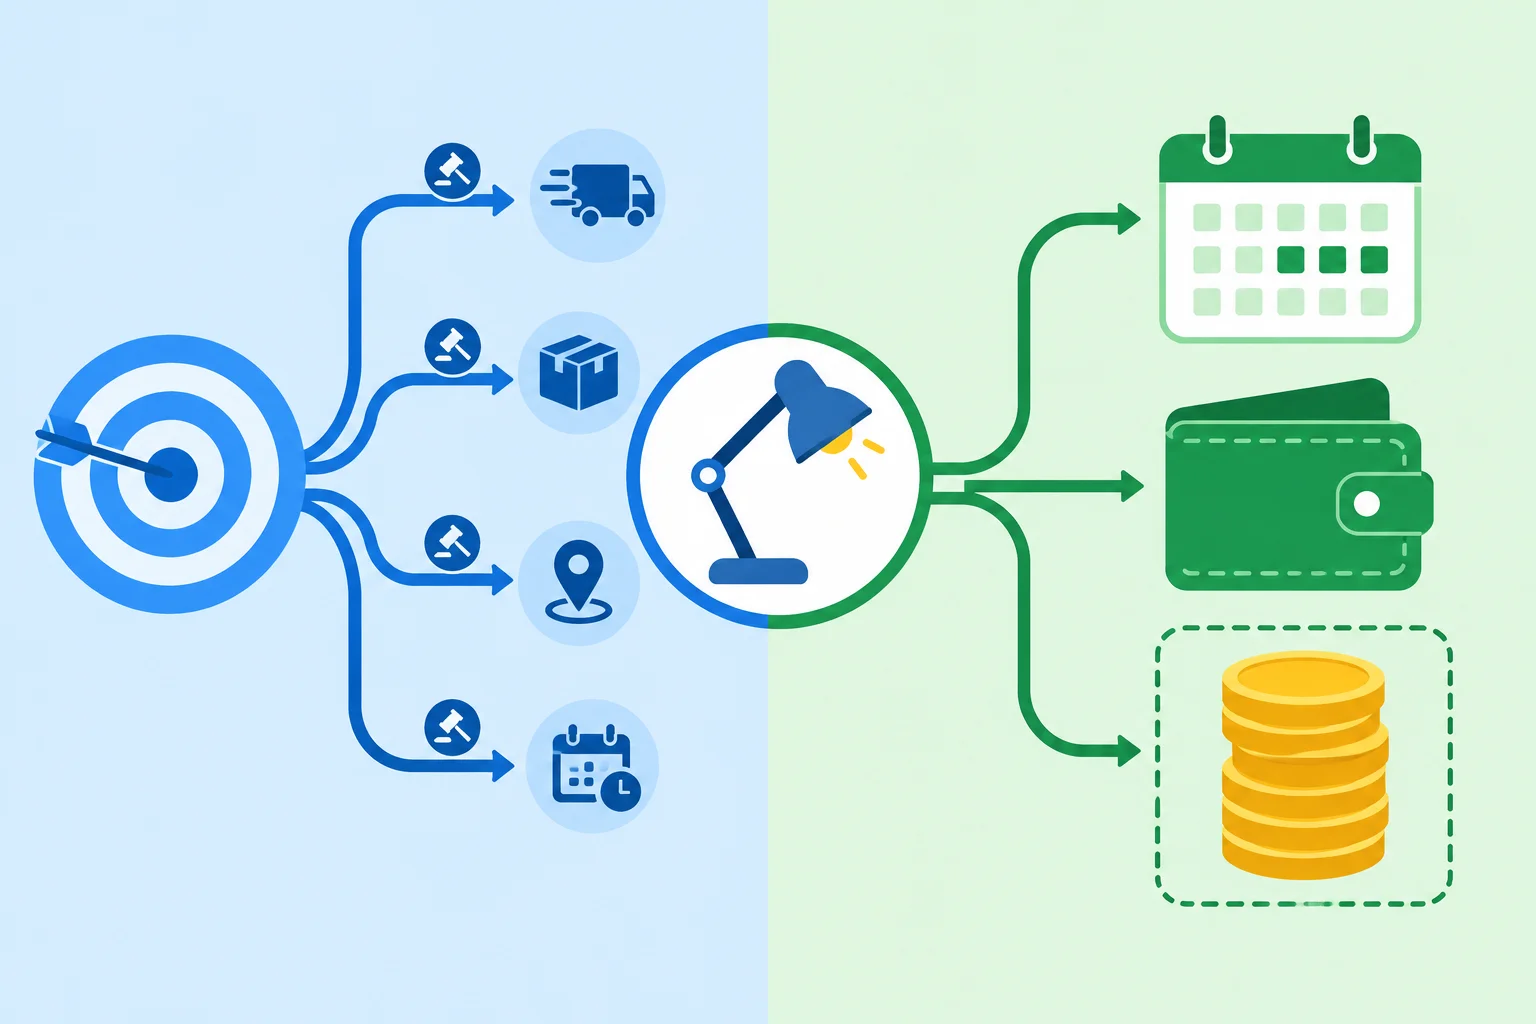
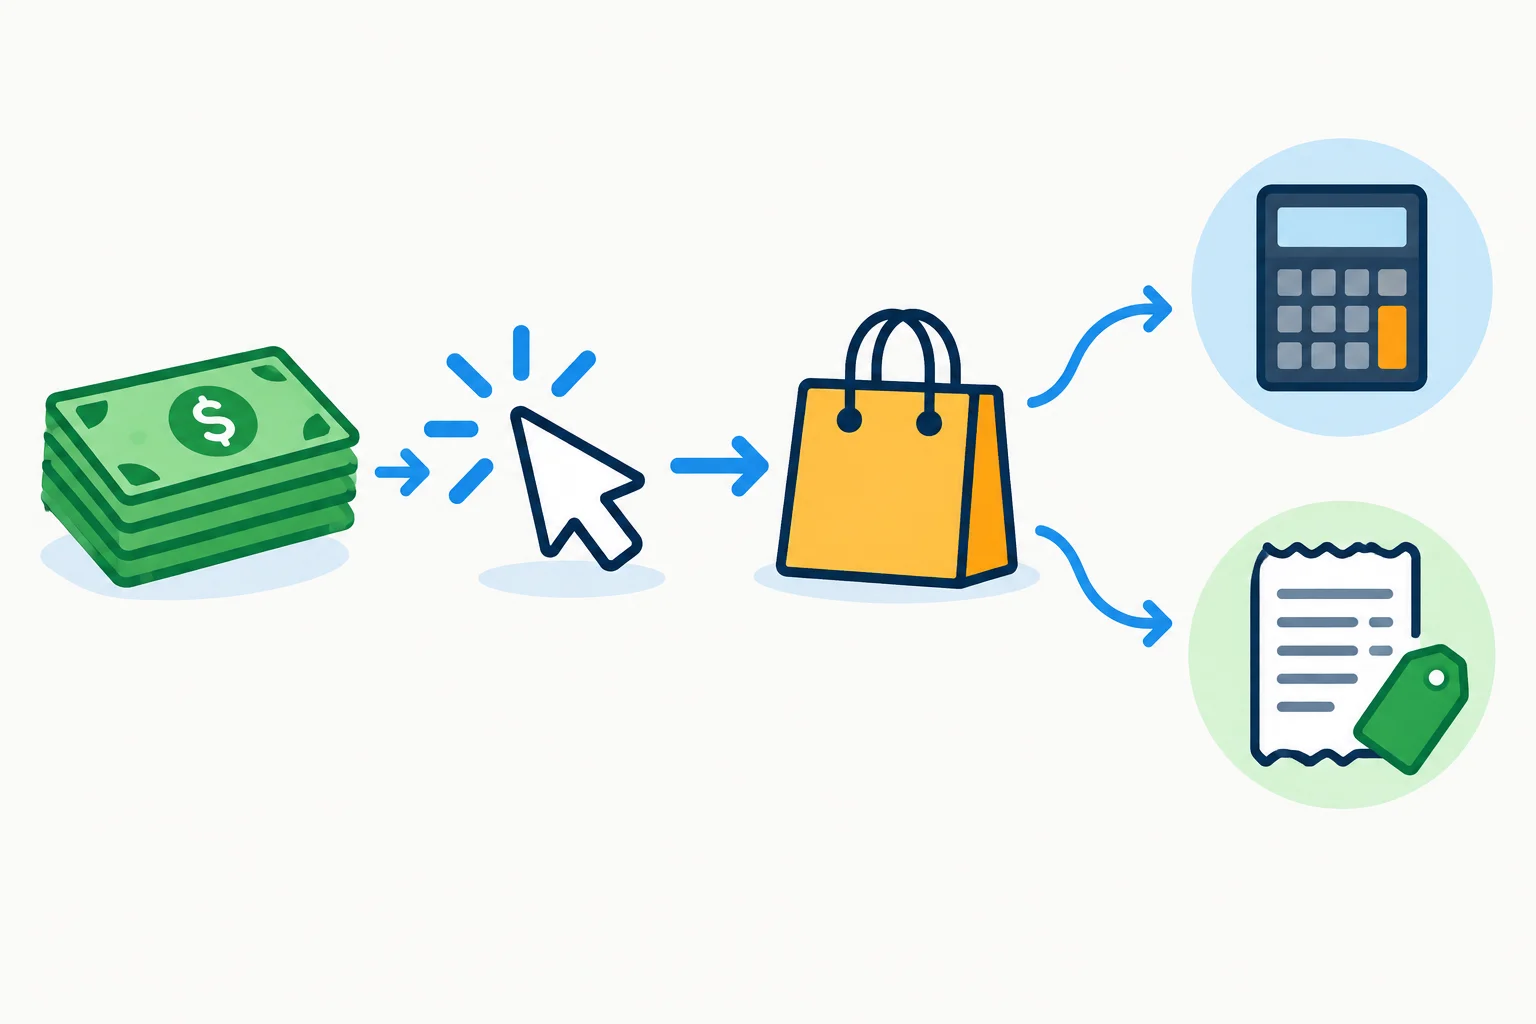
The left side represents a bidding strategy; the right side represents a spending budget.
A bid is not the same thing as a budget. A bid is an auction-related input or constraint that can influence delivery. It is not an authorization to spend a total amount.
Likewise, an observed CPC or CPA is a result reported after delivery. It describes what clicks or actions cost in the report; it is not automatically the bid and is not a spending limit.
Use the terms precisely when reviewing a plan.
Use this comparison to keep settings and reported outcomes distinct.
| Term | What it represents | What it does not establish |
|---|---|---|
| Bidding strategy | Instruction for pursuing a delivery outcome | A guaranteed result |
| Bid | Auction-related input or constraint | A total spending authorization |
| Observed CPC or CPA | Reported cost after delivery | A promised cost or a budget |
| Spending budget | Amount authorized over time | Guaranteed full spending |
Warning
Neither setting is a promise. A budget may underspend if suitable delivery opportunities are limited. A bidding strategy may pursue an outcome without achieving a particular volume or cost. Treat available spend and reported results as things to check, not as guaranteed consequences of a setting.
Match each planning statement to its correct classification.
Match every statement with its classification.
Tap an item and then its matching pair.

Step 2 of 9
Match a Google Ads or Meta delivery approach to the intended outcome and the quality of the available measurement signal.
A bidding strategy tells a platform which delivery outcome to pursue. It does not itself set the spending authorization.
For Northstar Goods, start with the business goal and the event the platform can measure reliably:
A click is not a purchase. Choosing an easier action to optimize can produce more of that action without proving more sales.
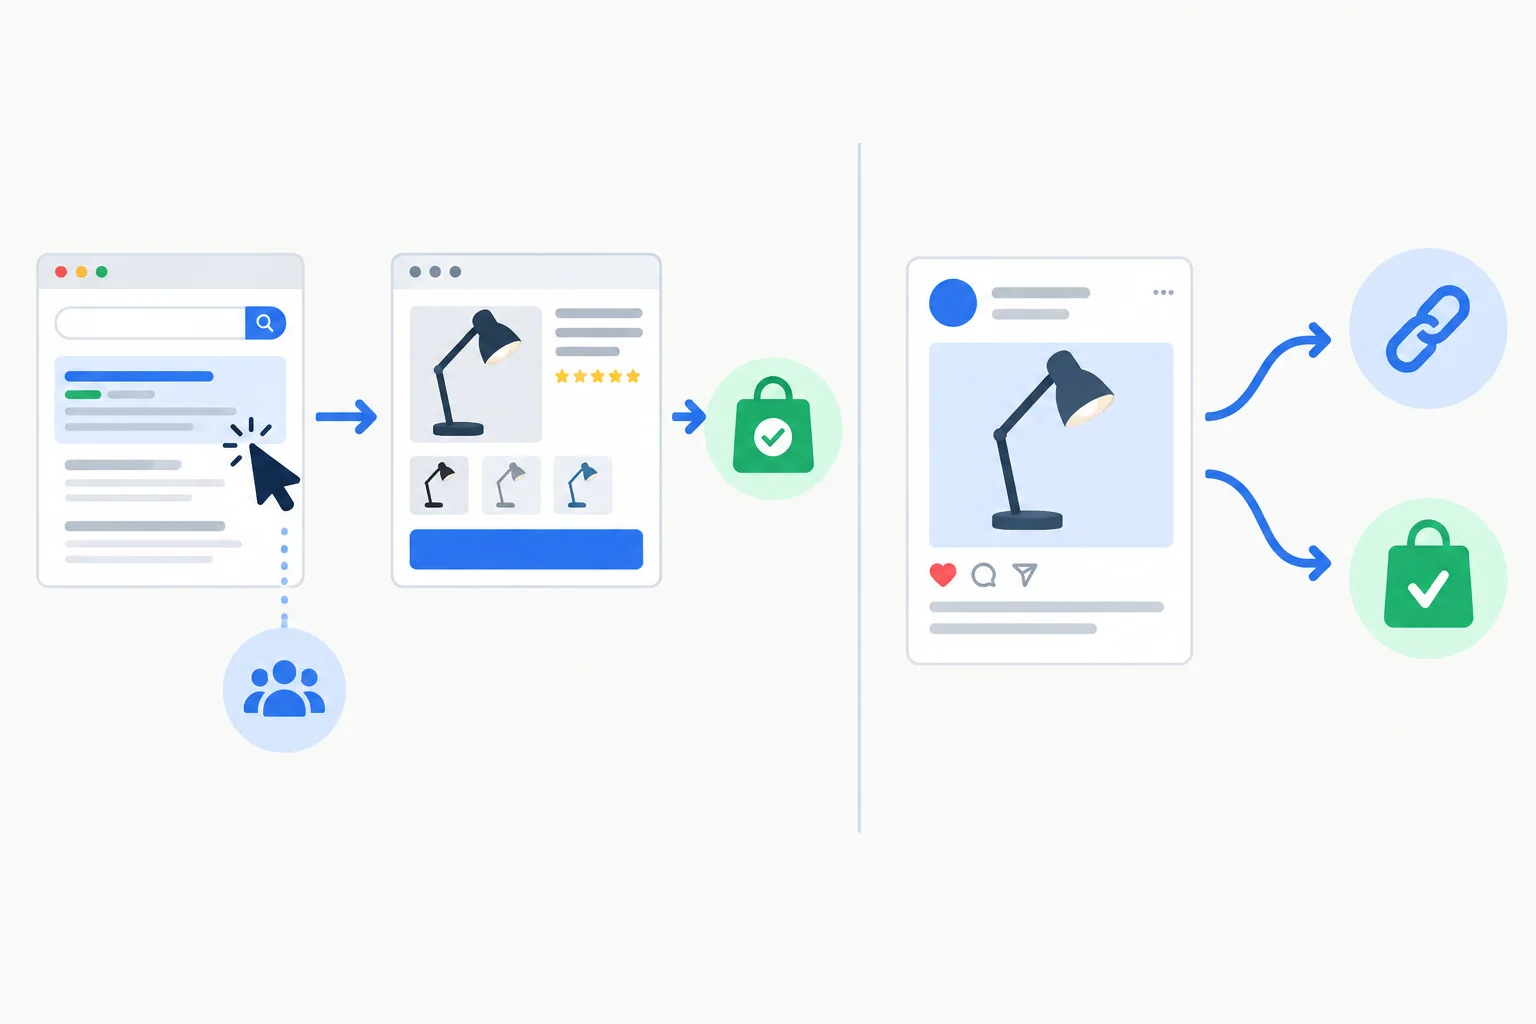
Select a bidding strategy or delivery approach that matches the outcome you can measure.
These introductory approaches describe what the system tries to obtain within the available budget. Names and availability depend on the current platform, campaign objective, and configuration.
Use the desired outcome and measurement condition together; do not infer a guaranteed cost or result.
| Platform and approach | What it seeks | Important boundary |
|---|---|---|
| Google Ads: Maximize Clicks | More clicks | Traffic is not a purchase outcome. A maximum CPC limit may be available in supported setups, but it does not guarantee clicks or a final CPC. |
| Google Ads: Maximize Conversions | More selected conversion actions | It seeks actions within the available budget; it does not guarantee a CPA. |
| Meta: highest-volume delivery | Most results for the selected performance goal and optimization event | It does not automatically seek purchases. The selected event determines the result pursued. |
Tip
Purchase-focused planning needs more than an event name. Check that the purchase action is appropriate, event collection has been validated, counting is accurate, and there is usable conversion history. Accurate order values are also necessary before treating a revenue estimate as credible.
Reliable tracking and abundant history are different. Limited history raises uncertainty, but there is no universal conversion-count threshold that makes automation appropriate for every campaign.
When purchase signals are missing, duplicated, or otherwise unreliable, do not select a traffic approach and describe it as purchase optimization. Repair the purchase measurement first, or explicitly change the planning objective to traffic.
For this hypothetical exercise, Northstar Goods wants purchases. In Google Ads, its selected purchase conversion action has validated collection, accurate counting, and modest usable history. In Meta, the purchase event is unreliable because some purchases are missing and others are duplicated; destination-link clicks are measured accurately.
Which planning choice is most defensible?
Select the best paired decision for the two platforms.
Step 3 of 9
Translate Northstar Goods' hypothetical authorization into a paced, platform-aware spending plan with safeguards.
Northstar Goods has authorized at most $1,200.00 for one hypothetical 30-day campaign. Its planned average pace is:
$1,200.00 ÷ 30 days = $40.00 per day
This is a planning average, not a guaranteed daily charge or a promise that the campaign will spend all available money. A bidding strategy affects how a platform pursues delivery; a spending budget controls the amount and schedule authorized for spending.
Keep three quantities separate:
Actual spend can be below the authorization when delivery is limited or the campaign ends with unspent budget.
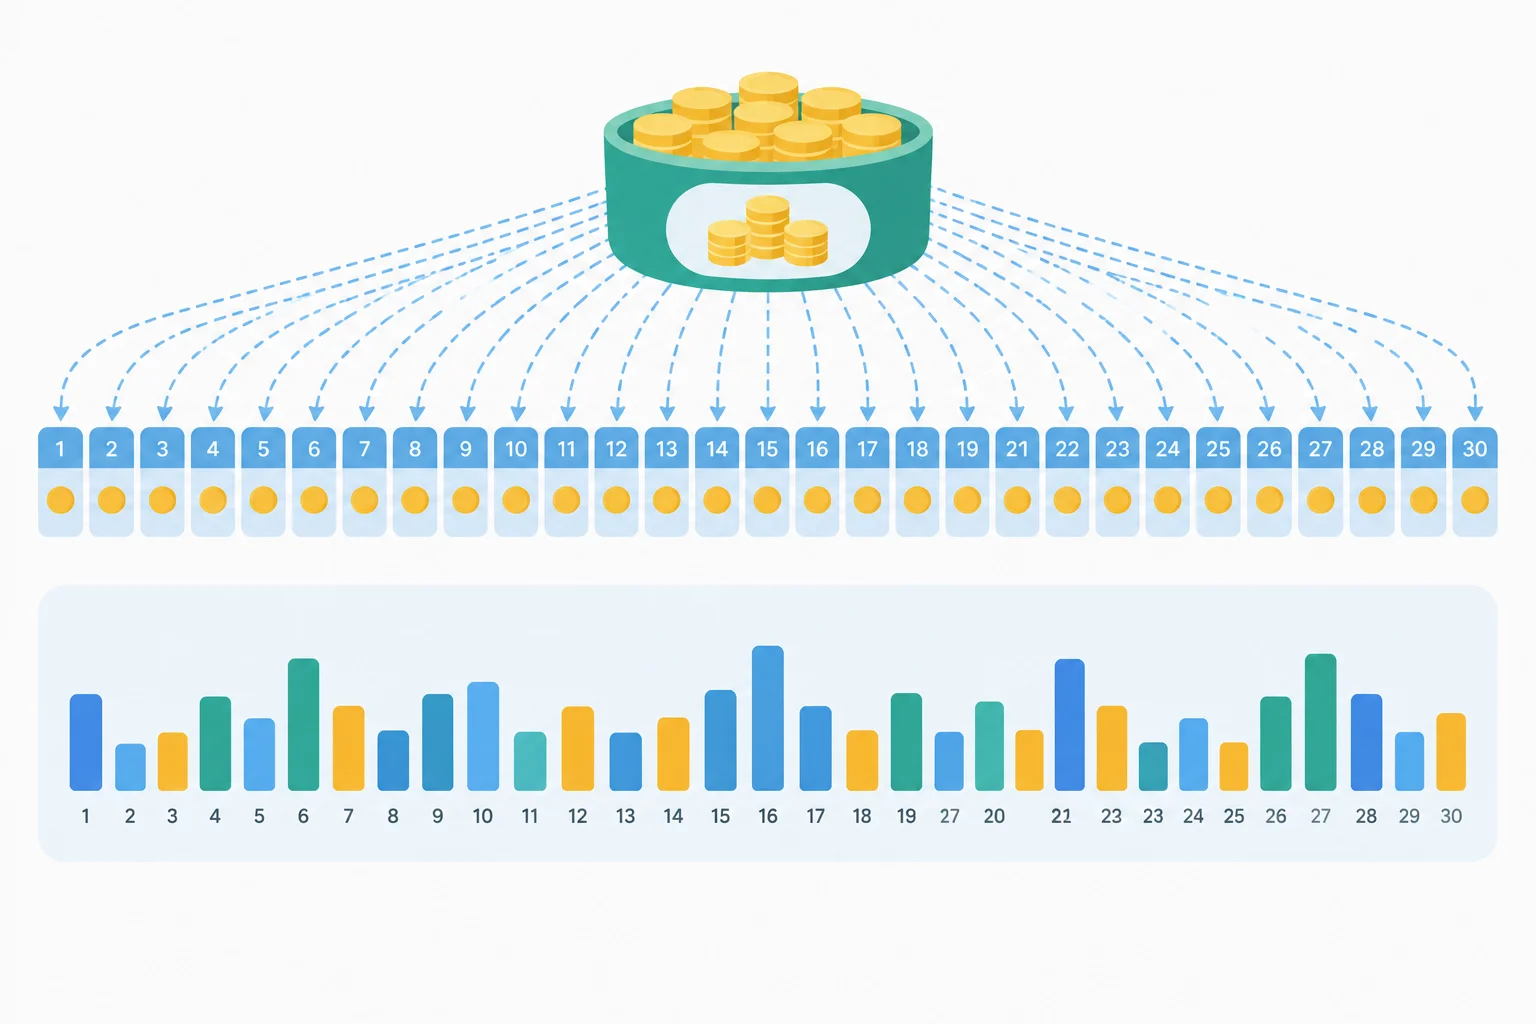
The $40.00 planned average pace comes from dividing the authorization by 30 days; actual daily spending may differ.
A separate hypothetical campaign has a $900.00 authorization for 30 days. Its planned average pace is $____ per day.
A platform budget setting is not always identical to the authorization you are trying to protect.
For Google, use this illustration only under these common standard-rule assumptions: an unchanged average daily budget throughout one complete 30-day calendar month, with no relevant exception. Most campaigns can be charged up to twice the average daily budget on a day, and the monthly charging limit is based on 30.4 times that budget.
So a $40.00 Google average daily budget is not a $1,200.00 cap:
30.4 × $40.00 = $1,216.00 monthly charging limit
To work backward from Northstar's $1,200.00 authorization:
$1,200.00 ÷ 30.4 = $39.473684...
Round the setting down: $39.00. Under these assumptions, 30.4 × $39.00 = $1,185.60. The planned average pace remains $40.00, while the more conservative setting leaves room below the authorization.
Choose controls according to the platform and configuration, then document what they do—not what you hope they do.
| Platform approach | Spending budget behavior | Northstar planning use |
|---|---|---|
| Google average daily budget | Daily charges may vary; under the stated standard-rule assumptions, the monthly charging limit uses 30.4 times the setting. | A $40.00 setting can imply $1,216.00. A $39.00 setting implies $1,185.60 under those assumptions. |
| Meta daily budget | A daily budget is an average; pacing can vary by day. | Do not describe the daily amount as a guaranteed daily charge or a complete monthly cap. |
| Eligible Meta lifetime budget | Can bound spending over a specified schedule when available for the configuration. | Use defined start and end dates, and verify the current configuration and controls. |
Warning
A bounded plan records the authorized maximum, platform-specific spending budget, start and end dates, and planned reviews on Day 7, Day 14, and Day 30. Compare actual spend with the authorization at each review.
Alerts and manual checks are useful monitoring tools, but they are not hard caps. Budget changes, partial-month schedules, cross-month schedules, and campaign exceptions require separate checks. Before real activation, verify current platform rules, available controls, and charging terms.
Northstar selects the Google alternative. Under the stated standard-rule assumptions for one complete 30-day calendar month, which planning note both identifies the mismatch and respects the $1,200.00 authorization?
Step 4 of 9
Choose between shared campaign-level budgeting and direct ad-set-level allocation for a hypothetical Meta campaign.
In Meta, a campaign-level budget is one shared spending budget for the campaign. Meta can distribute that budget across eligible ad sets toward the opportunities it predicts are most likely to produce the selected result.
This is an allocation choice, not a promise of delivery or results. Two eligible ad sets can receive different amounts because the campaign budget is shared; they do not automatically receive an equal split.
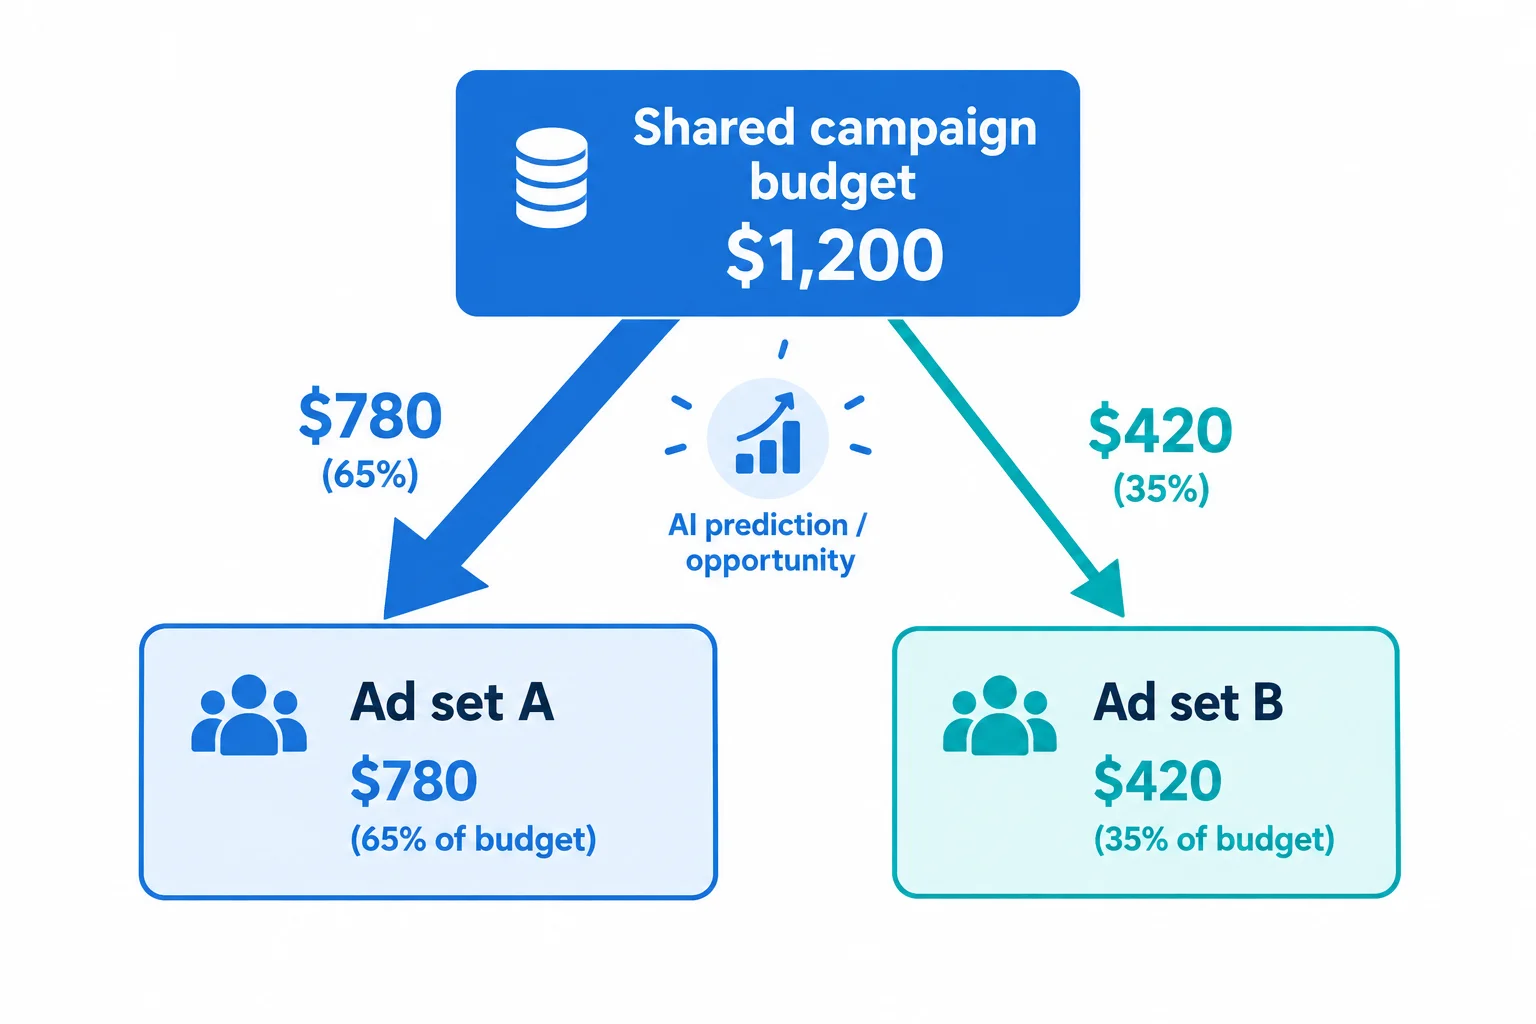
With a campaign-level budget, distribution can differ between eligible ad sets.
Choose ad-set-level budgeting when preserving a planned allocation matters more than allowing the campaign to shift spending automatically. The budget is assigned more directly to each ad set.
For example, Northstar Goods could plan $600.00 for Ad set A and $600.00 for Ad set B from its $1,200.00 authorized campaign spend. That is a planning control—not evidence that the ad sets are equally effective, fairly compared, or part of a valid A/B test.
Budget-level availability and spending controls depend on the current campaign configuration. Confirm the available settings before any real activation.
Use the budget level that matches the operational need—not an assumption that one option is always better.
| Budget level | How allocation works | Useful when | Trade-off |
|---|---|---|---|
| Campaign level | One shared budget is distributed across eligible ad sets | You want automated distribution toward predicted opportunities | No fixed split between ad sets |
| Ad-set level | A planned amount is assigned to each ad set | Each ad set needs a preserved planned allocation | Less automatic shifting between ad sets |
| Equal $600.00 each | Ad set A: $600.00; Ad set B: $600.00 | An operational plan requires equal allocation | Not proof of equal performance or a valid test |
A campaign has two eligible ad sets. The manager wants Meta to distribute one shared spending budget toward the ad set with stronger predicted opportunities, without requiring an equal split. Which budget level best fits?
Northstar Goods has one hypothetical Meta campaign with a maximum authorized ad spend of $1,200.00. It contains Ad set A and Ad set B. An operational plan requires a planned $600.00 allocation to each ad set.
Choose campaign-level or ad-set-level budgeting. Then explain why the other level would not assure that $600.00/$600.00 split.
Write at least 120 characters (0/120).

Step 5 of 9
Use one simulated campaign report to calculate paid-media efficiency metrics with explicit denominators and distinguish purchase actions from verified new customers.
Northstar Goods has one simulated 30-day report. Every figure below uses the same reporting scope, so its ratios can be calculated consistently.
For this tutorial, a click means a destination-link click: a click that takes a person toward the campaign destination. Do not silently substitute all clicks, sessions, or users; those can be counted differently.
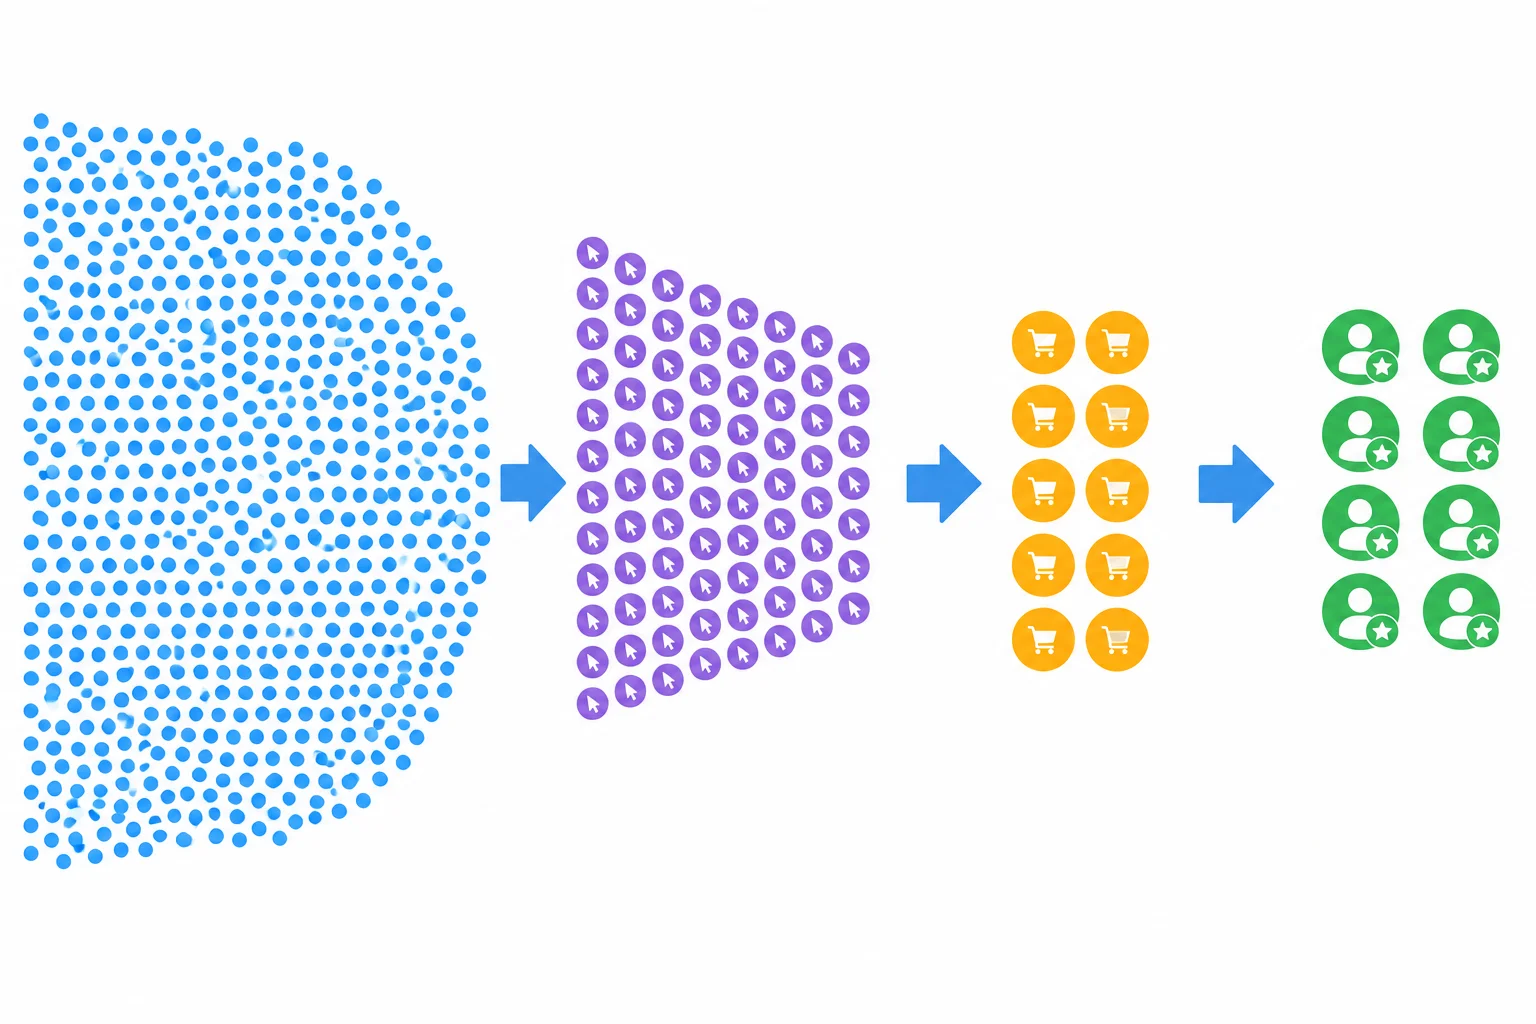
Each stage answers a different question. A purchase action and a verified new customer are not interchangeable.
Simulated 30-day campaign report for Northstar Goods.
| Measure | Reported value |
|---|---|
| Spend | $300.00 |
| Impressions | 10,000 |
| Destination-link clicks | 250 |
| Purchase conversions | 10 |
| Verified new customers | 8 |
Use the denominator named in each formula. A cost metric divides spend by the relevant outcome; a rate divides an outcome by its earlier stage. Retain unrounded intermediate calculations, then display money to two decimals and rates to one decimal.
Results from the simulated report.
| Metric | Calculation | Result |
|---|---|---|
| CTR | CTR = Destination-link clicks ÷ Impressions × 100% = 250 ÷ 10,000 × 100% | 2.5% |
| CPC | CPC = Spend ÷ Destination-link clicks = $300.00 ÷ 250 | $1.20 |
| CPM | CPM = Spend ÷ Impressions × 1,000 = $300.00 ÷ 10,000 × 1,000 | $30.00 |
| Purchase conversion rate | Purchase conversion rate = Purchase conversions ÷ Destination-link clicks × 100% = 10 ÷ 250 × 100% | 4.0% |
| Purchase CPA | Purchase CPA = Spend ÷ Purchase conversions = $300.00 ÷ 10 | $30.00 |
| Ad cost per verified new customer | Ad cost per new customer = Spend ÷ Verified new customers = $300.00 ÷ 8 | $37.50 |
A purchase conversion is a recorded purchase action. It does not, by itself, establish that the buyer is new. The ad cost per verified new customer uses customer-status evidence, so it is a separate calculation from Purchase CPA.
Neither measure is automatically a fully loaded customer acquisition cost: this simple calculation contains ad spend only, not every possible business cost.
Warning
If a denominator is zero, the ratio is undefined. For example, with zero destination-link clicks, CPC and purchase conversion rate cannot be calculated; with zero purchase conversions, Purchase CPA is undefined. Do not report an undefined cost or rate as $0.00 or 0.0%.
Tip
Before comparing any ratio, check two things: the denominator is nonzero, and the numerator and denominator use the same reporting scope.
Using the supplied 30-day report, match each metric to its calculated result. Keep Purchase CPA separate from ad cost per verified new customer.
Match every metric to the correct result.
Tap an item and then its matching pair.

Step 6 of 9
Build a transparent 30-day Expected forecast for Northstar Goods from hypothetical spend, CPC, purchase conversion rate, and average order value.
Northstar Goods is planning—not activating—a 30-day purchase campaign. Use these Expected inputs as hypothetical practice assumptions. The $1,200.00 assumed spend is conditional: a budget authorization does not guarantee that a platform will deliver all of it.
Keep one scope throughout the forecast: the same 30-day period, purchase conversion definition, and $60.00 average order value. A forecast purchase is an expected conversion quantity; it does not establish how many purchasers are verified new customers.
A forecast is a visible chain of assumptions and calculations, not a promise of delivery or results.
Use these values consistently in the calculation chain.
| Input | Value |
|---|---|
| Assumed spend | $1,200.00 |
| Assumed CPC | $1.20 |
| Assumed purchase conversion rate | 4.0% |
| Average order value | $60.00 |
| Planning period | 30 days |
Calculate each output from a stated input or a prior output. Convert the percentage before multiplying: 4.0% = 0.04.
Forecast clicks = Assumed spend ÷ Assumed CPC
Forecast purchases = Forecast clicks × Assumed purchase conversion rate
Purchase CPA = Spend ÷ Purchase conversions
Forecast revenue = Forecast purchases × Average order value
Example
These are conditional expected values for the stated 30-day inputs. Record where real assumptions came from; here, every input is hypothetical practice data, not an industry benchmark.
Tip
Clicks and purchases are counts, so do not add a dollar sign to them. Purchase CPA and forecast revenue are monetary outputs and should use USD formatting. A purchase conversion is the same defined action used in the conversion-rate assumption; do not relabel forecast purchases as verified new customers without customer-status evidence.
Order the dependent stages from first to last. The final stage includes both outputs that use the forecast purchase quantity.
Complete the Expected 30-day forecast using the supplied assumptions. Enter clicks and purchases as counts. Enter Purchase CPA and forecast revenue with a dollar sign, comma separators where needed, and two decimal places.
Forecast clicks = $1,200.00 ÷ $1.20 =
Forecast purchases = ($1,200.00 ÷ $1.20) × 0.04 =
Purchase CPA = $1,200.00 ÷ (($1,200.00 ÷ $1.20) × 0.04) =
Forecast revenue = (($1,200.00 ÷ $1.20) × 0.04) × $60.00 = 
Step 7 of 9
Compare Conservative, Expected, and Optimistic forecast assumptions for Northstar Goods, then communicate what the range can and cannot claim.
Use a scenario range instead of treating one forecast as a promise. For Northstar Goods, hold the assumed spend at $1,200.00 and the average order value at $60.00, then vary CPC and purchase conversion rate.
Use the same chain for each scenario:
Forecast clicks = Assumed spend ÷ Assumed CPC
Forecast purchases = Forecast clicks × Assumed purchase conversion rate
Forecast revenue = Forecast purchases × Average order value
For example, convert 4.0% to 0.04 before multiplying. The $1,200.00 spend is conditional: delivery may still differ from the assumption.
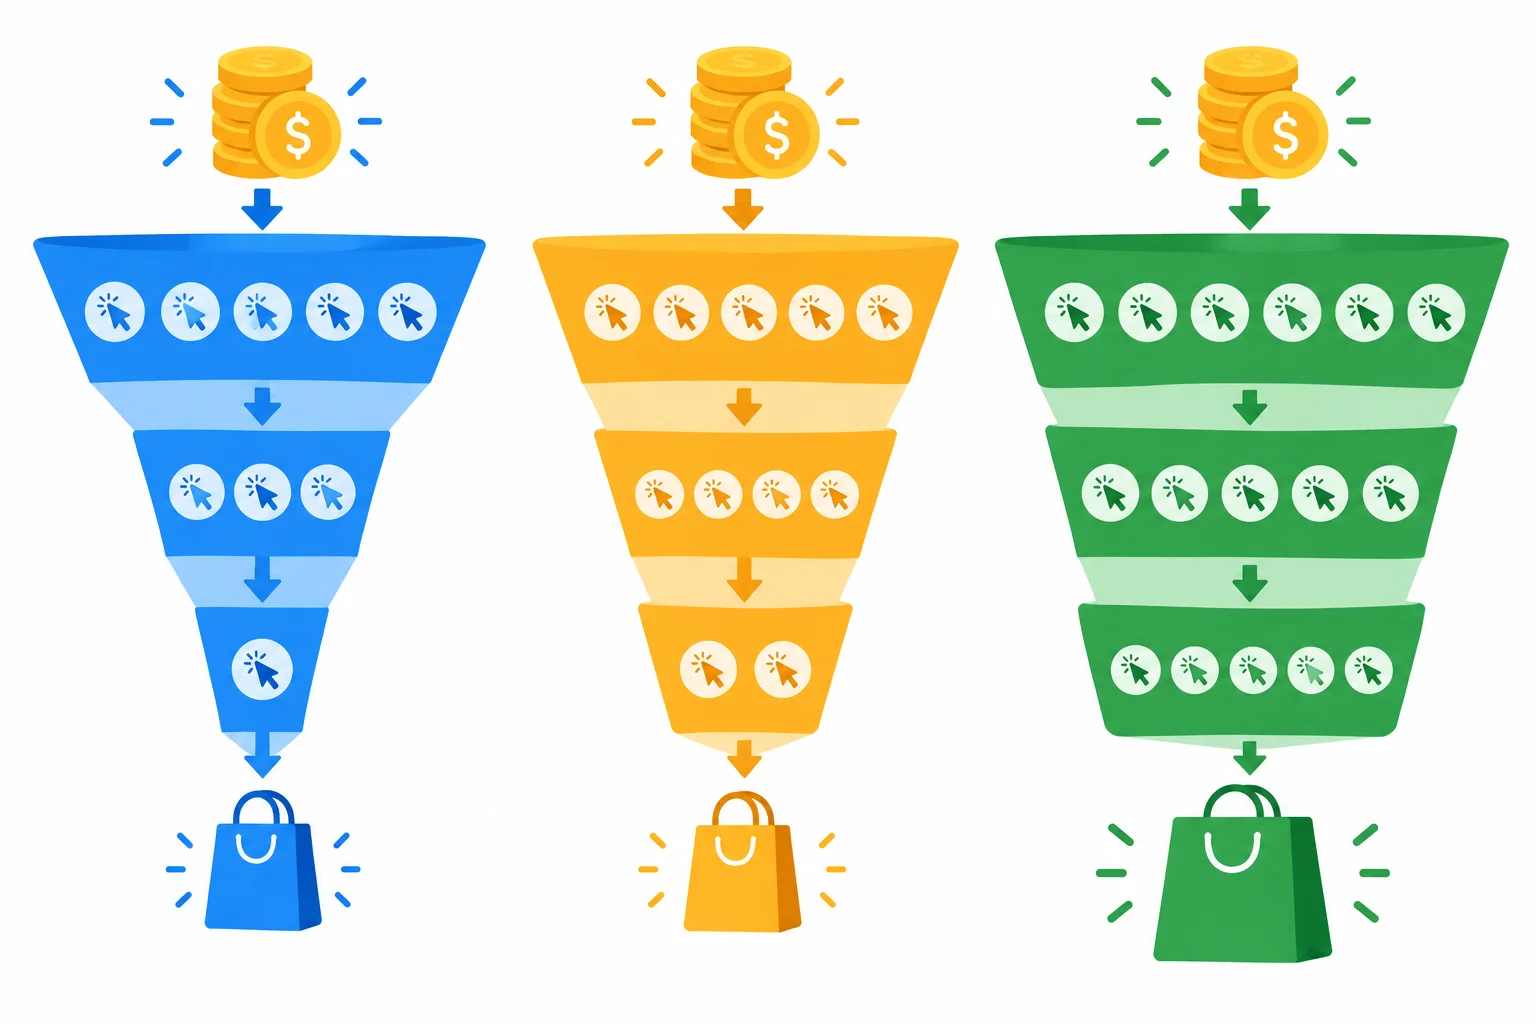
The scenario labels describe assumptions, not a guaranteed range of outcomes.
All scenarios use the same planning-period assumptions: $1,200.00 spent and a $60.00 average order value.
| Scenario | Assumed spend | Assumed CPC | Purchase conversion rate | Average order value |
|---|---|---|---|---|
| Conservative | $1,200.00 | $1.50 | 2.0% | $60.00 |
| Expected | $1,200.00 | $1.20 | 4.0% | $60.00 |
| Optimistic | $1,200.00 | $1.00 | 6.0% | $60.00 |
Apply the formulas without rounding intermediate values. Purchase CPA here is calculated as assumed spend ÷ forecast purchases.
Higher CPC produces fewer forecast clicks from the same spend. A lower purchase conversion rate then turns a smaller share of those clicks into purchases. Together, those assumptions reduce purchase volume and raise purchase CPA.
Forecast results use the common $1,200.00 spend assumption. Fractional values would be expected quantities; these particular inputs happen to produce whole purchase estimates.
| Scenario | Forecast clicks | Forecast purchases | Purchase CPA | Forecast revenue |
|---|---|---|---|---|
| Conservative | 800 | 16 | $75.00 | $960.00 |
| Expected | 1,000 | 40 | $30.00 | $2,400.00 |
| Optimistic | 1,200 | 72 | $16.67 | $4,320.00 |
Warning
Conservative, Expected, and Optimistic are planning labels. They are not assigned probabilities, confidence intervals, or promised minimum and maximum results. With hypothetical inputs, “Expected” is not an evidence-backed prediction.
Use Day 7, Day 14, and Day 30 as planned review checkpoints. Check actual spending and whether the assumptions still seem suitable, but do not treat a small early sample as definitive.
If the spending budget later increases, do not assume CPC or purchase conversion rate will remain unchanged. A larger budget needs fresh assumptions and a new scenario calculation.
For the Conservative scenario, assumed spend is $1,200.00, assumed CPC is $1.50, and purchase conversion rate is 2.0%. Forecast purchases = {{blank}}.
Which completed statement correctly summarizes the forecast purchase estimates and the status of the scenario range?

Step 8 of 9
Calculate ROAS and modeled contribution, then explain why a positive-looking advertising return may still leave the business unprofitable.
A positive revenue-to-spend ratio is not a profitability conclusion. Keep the cost layers separate for the same 30-day reporting scope.
For Northstar Goods, each completed desk-lamp order contributes $60.00 in revenue after discounts and returns, but also has $36.00 in variable costs for goods, fulfillment, and payment fees. Ad spend is a separate cost. The stated fixed operating costs for the planning period are another separate $400.00.
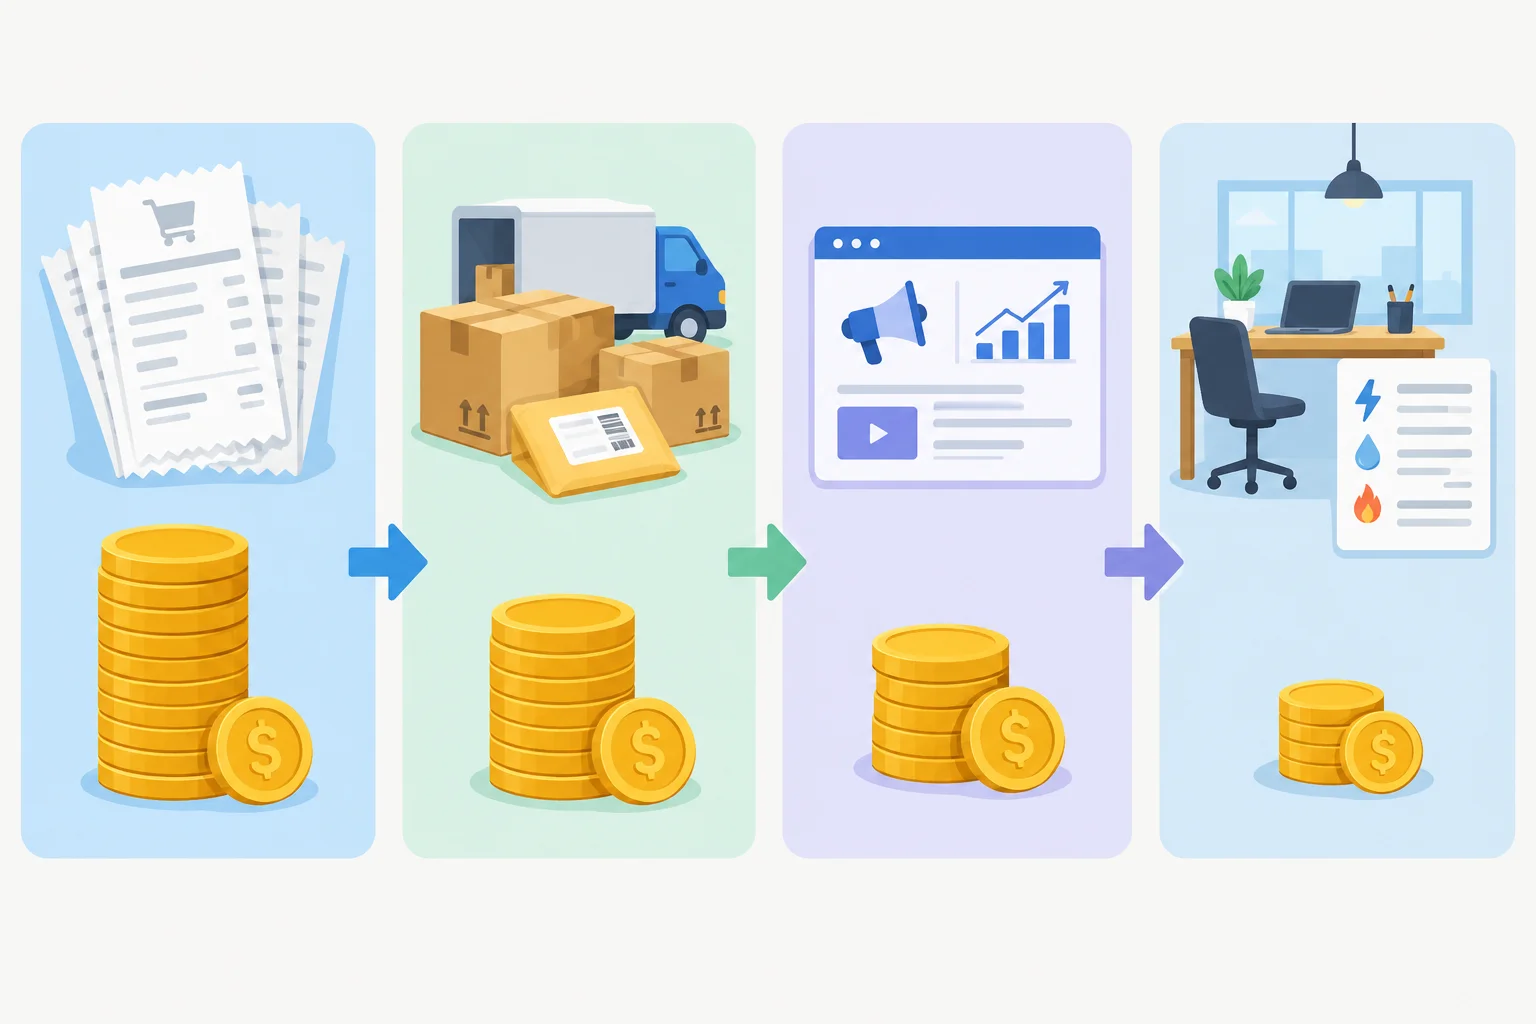
Revenue first covers variable costs and ad spend; stated fixed costs are deducted afterward.
The Expected scenario is conditional on $1,200.00 of spend and forecasts 40.0 purchases, $2,400.00 in ad-attributed revenue, and a $60.00 average order value.
First calculate the total variable costs:
40.0 purchases × $36.00 per order = $1,440.00
Then apply the cost layers:
ROAS = $2,400.00 ÷ $1,200.00 = 2.00x
Contribution after ads = $2,400.00 − $1,440.00 − $1,200.00 = -$240.00
Modeled result after stated fixed costs = -$240.00 − $400.00 = -$640.00
So, revenue is twice ad spend, yet the modeled result remains negative after the costs included here.
Each scenario uses the same $1,200.00 assumed ad spend, $36.00 variable cost per completed order, and $400.00 stated fixed costs for the same planning period.
| Scenario | Ad-attributed revenue | ROAS | Variable costs | Contribution after ads | Modeled result after stated fixed costs |
|---|---|---|---|---|---|
| Conservative | $960.00 | 0.80x | $576.00 | -$816.00 | -$1,216.00 |
| Expected | $2,400.00 | 2.00x | $1,440.00 | -$240.00 | -$640.00 |
| Optimistic | $4,320.00 | 3.60x | $2,592.00 | $528.00 | $128.00 |
Warning
This is a simplified planning model, not proof that advertising caused incremental revenue or a complete accounting statement. It assumes no lifetime-value or repeat-purchase benefit, and it keeps only the stated fixed costs visible.
Using the Expected scenario, write four labeled lines:
Write at least 120 characters (0/120).

Step 9 of 9
Create a concise hypothetical campaign brief that joins a bidding choice, a bounded budget, a scenario forecast, and a cost-aware conclusion.
A defensible brief connects five decisions in one place:
It is a planning record, not a promise that spend, purchases, or revenue will occur.
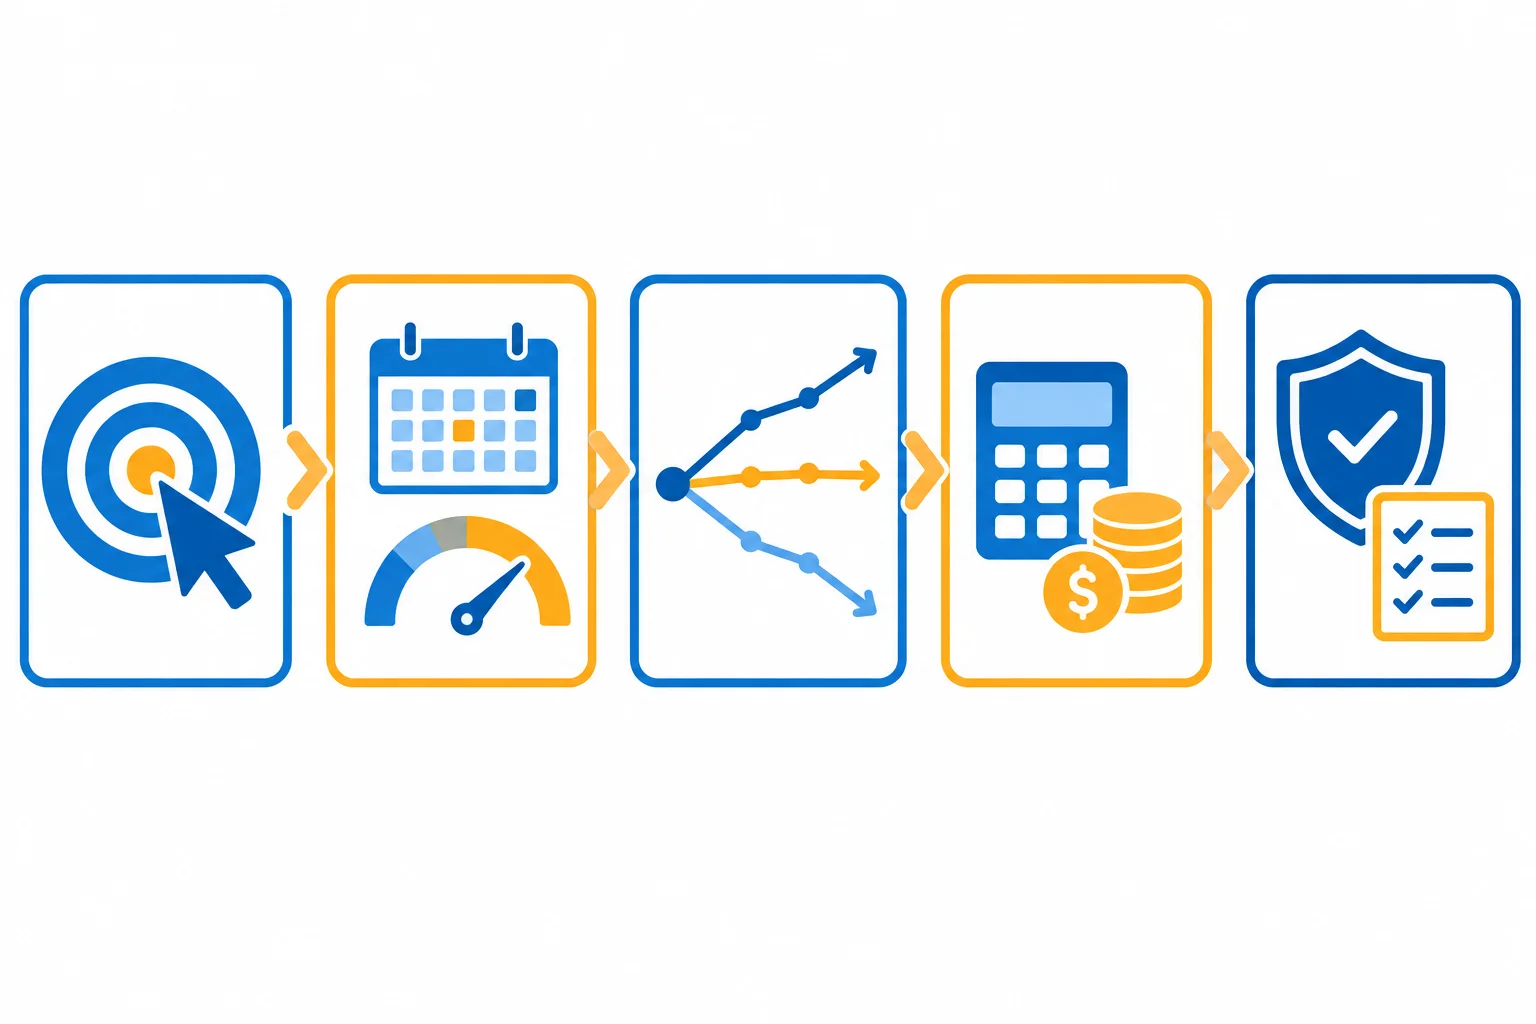
Each block supports the next: a forecast is credible only when its strategy, budget, assumptions, and costs are visible.
Use this fictional case packet for your brief.
Northstar Goods sells desk lamps. The objective is purchase conversion. The purchase event has been validated, counts completed purchases accurately, and its values support revenue estimates. Conversion history is limited, so outcomes remain uncertain.
Plan one Meta campaign for one 30-day calendar month. Use an eligible $1,200.00 lifetime spending budget over the stated schedule. This makes $40.00 per day the planned average pace, not a guaranteed daily charge. Review on Day 7, Day 14, and Day 30. Before any real activation, confirm the current configuration and platform rules.
Each completed order has $60.00 revenue and $36.00 variable costs. Stated fixed operating costs are $400.00 for the planning period.
All scenarios assume $1,200.00 spent and a $60.00 average order value. They are conditional possibilities, not benchmarks or promised outcomes.
| Scenario | Assumed CPC | Purchase conversion rate | Forecast clicks | Forecast purchases | Forecast revenue |
|---|---|---|---|---|---|
| Conservative | $1.50 | 2.0% | 800.0 | 16.0 | $960.00 |
| Expected | $1.20 | 4.0% | 1,000.0 | 40.0 | $2,400.00 |
| Optimistic | $1.00 | 6.0% | 1,200.0 | 72.0 | $4,320.00 |
These results keep every stated cost visible. They use the same period and cost definitions as the scenario forecast.
| Scenario | ROAS | Variable costs | Contribution after ads | Modeled result after stated fixed costs |
|---|---|---|---|---|
| Conservative | 0.80x | $576.00 | -$816.00 | -$1,216.00 |
| Expected | 2.00x | $1,440.00 | -$240.00 | -$640.00 |
| Optimistic | 3.60x | $2,592.00 | $528.00 | $128.00 |
Warning
This is a hypothetical planning brief only. A validated measurement setup and a bounded plan support a decision discussion; they do not authorize a live campaign, payment setup, or spending.
Write a concise five-part planning brief for the Northstar case packet on the previous screen. Use these headings:
Use the supplied facts and calculations. State assumptions, distinguish planned pace from actual delivery, and avoid guarantees. Your conclusion must explain why the Expected scenario’s ROAS does not by itself establish profitability.
Write at least 450 characters (0/450).
Summary
Compare your brief with these criteria after submitting it.
Congratulations! You completed: Choose Ad Bids and Budgets with Realistic Forecasts
25 XP
Thousands of online courses in video, ebooks and audiobooks.
To test your knowledge during online courses
Generated directly from your cell phone's photo gallery and sent to your email

Download our app via QR Code or the links below:.



Carry knowledge in your pocket.
Download the Cursa app.
There are hundreds of free courses available, with a free certificate of completion that is saved in your mobile image gallery.
Download the app to access the Course Completion Certificate for Free.


+ 10 million
students

Free and Valid
Certificate

60 thousand free
exercises

4.8/5 rating in
app stores

Free courses in
video and ebooks