
Step 1 of 7
Ask for an Analysis You Can Check
Create a request that makes an assistant’s analysis of Cedar Learning Center evidence easier to inspect.

Learning path · Level 3 · Tutorial 3
Analyze short text and small tables with an assistant, then check whether each conclusion is supported and whether the calculations are correct using a calculator or simple manual checks.

 Ask for an Analysis You Can Check
Create a request that makes an assistant’s analysis of Cedar Learning Center evidence easier to inspect. 2 min
 Trace Each Claim to Its Source
Locate the exact passage or table cell behind a claim, then decide whether the source supports, contradicts, or does not resolve the claim. 3 min
 Find Gaps Before Drawing Conclusions
Identify missing values, unclear labels, and counting-unit limits that make a conclusion unreliable. 3 min
 Recalculate Counts and Totals
Independently rebuild Cedar Learning Center totals from T1, reconcile monthly and overall values, and preserve the difference between attendance records and unique people. 3 min
 Check What Each Percentage Is Of
3 min
 Keep Conclusions Within the Evidence
Revise a conclusion so it keeps checked findings while avoiding an unproven explanation. 3 min
 Complete a Small Analysis Audit
4 min
Step 1 of 7
Create a request that makes an assistant’s analysis of Cedar Learning Center evidence easier to inspect.
Use this fixed case material for this tutorial. Treat it as the complete source: do not add facts from outside it.
P1: Registrations counts registered people within each session. Attended counts those registrants who attended. A person may appear in multiple sessions.
P2: Reminder emails began in May. The venue also changed in May. Organizers believe reminders improved attendance.
P3: Feedback was optional. Feedback response counts are unavailable. The meaning of the Positive column is unspecified.
T1 records four Cedar Learning Center sessions. An em dash means the value is unavailable; it is not a recorded zero.
| Row | Month | Session | Registrations | Attended | Positive |
|---|---|---|---|---|---|
| R1 | April | Morning | 20 | 15 | 8 |
| R2 | April | Evening | 30 | 15 | — |
| R3 | May | Morning | 25 | 20 | 12 |
| R4 | May | Evening | 25 | 15 | 9 |
Ask the assistant to keep four kinds of statements separate.
Evidence is what P1–P3 explicitly state or what T1 records. Interpretation is what an analyst thinks those materials suggest. Assumptions are premises used without support in the supplied material. Unresolved questions identify information still needed.
Separation makes a response easier to inspect. It does not make every statement true: the evidence and references still need review.
A response can be organized as a visible path from source material to four different kinds of statements.
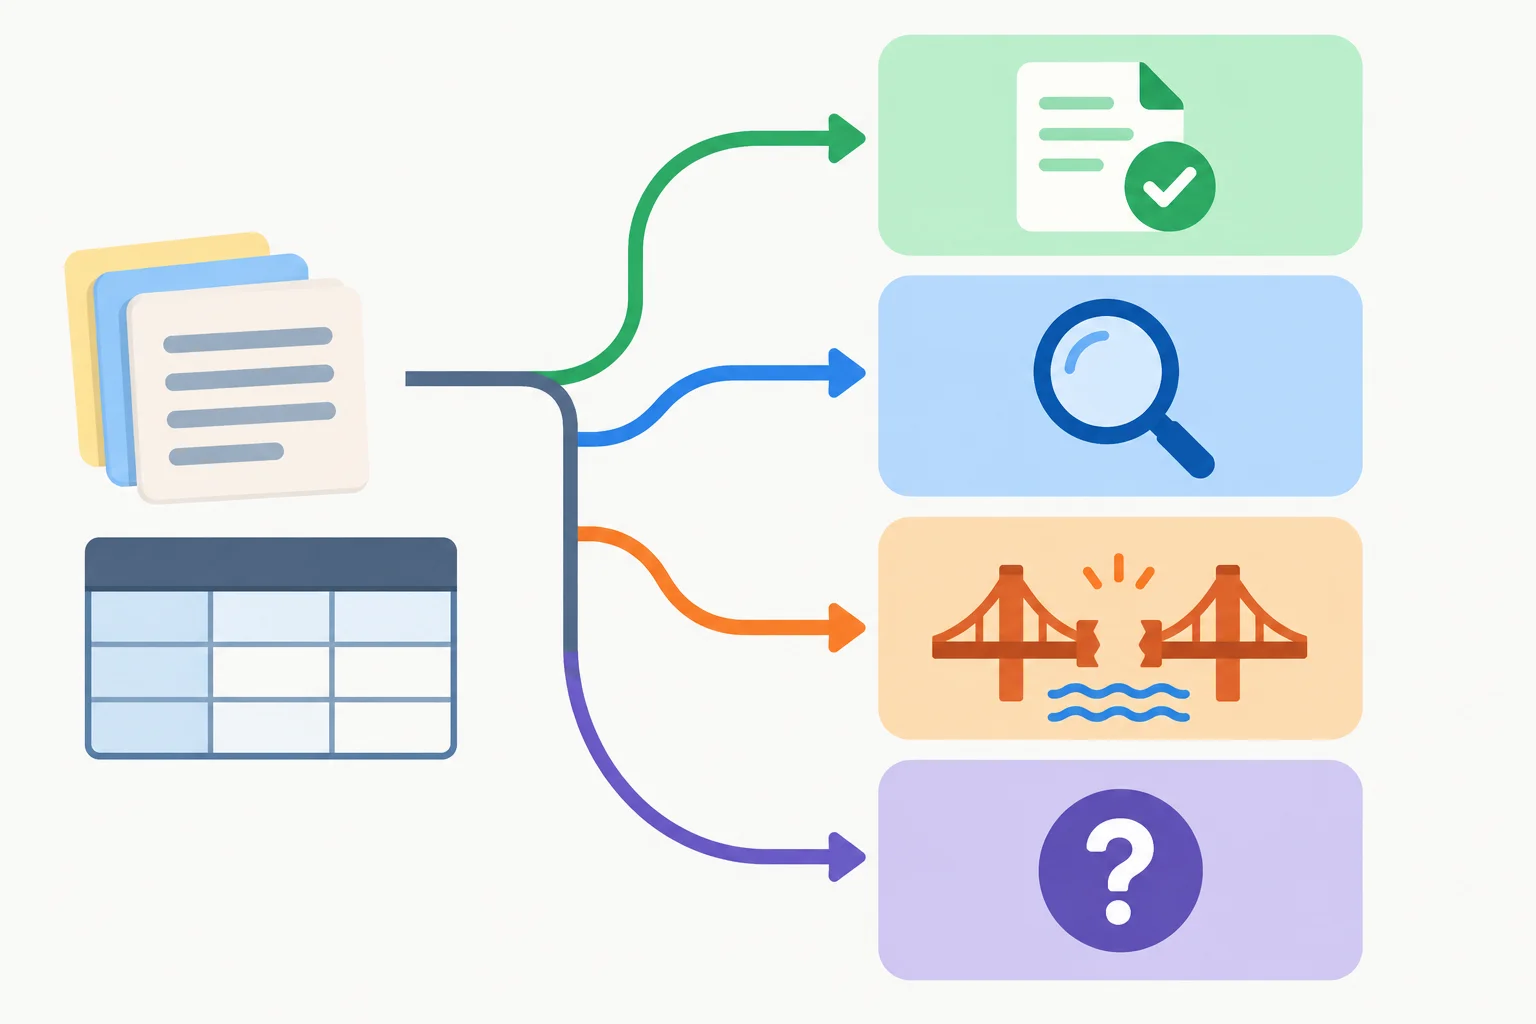
Use this order: Evidence, Interpretation, Assumptions, Unresolved questions.
Tip
Require a source reference with each evidence statement. Use paragraph references such as P2 and table references such as T1:R3 (Attended). A reference helps a reviewer find the material; it is not proof by itself that the claim is accurate.
A useful request gives the assistant a task, boundaries, and a reviewable output format. This pattern tells it not to turn an interpretation or an assumption into an asserted source fact.
Example
Analyze the Cedar Learning Center source notes P1–P3 and table T1 using only the supplied material. Do not use outside information.
Organize the response under these headings, in this order:
Evidence
Interpretation
Assumptions
Unresolved questions
Under Evidence, state only what the passages explicitly say or T1 records, and attach a reference such as P2 or T1:R3 (Attended) to each point. Label interpretations as interpretations. Identify premises that are not established as assumptions. State what information is still needed as unresolved questions. Do not treat the headings themselves as proof that a claim is correct.
Example
Evidence
Interpretation
Assumptions
Unresolved questions
The headings reveal what kind of statement each line is. They do not remove the need to check the cited passages and cells.
Draft a short request to the assistant about the Cedar Learning Center material. Require an analysis that separates source facts from interpretations, assumptions, and questions that remain open. Include the four prescribed output headings in their specified order, require source references for evidence, and make clear that organization is not proof.
Do not analyze the case itself; write the request you would give the assistant.
Write at least 180 characters (0/180).

Step 2 of 7
Locate the exact passage or table cell behind a claim, then decide whether the source supports, contradicts, or does not resolve the claim.
Use these fixed source notes and table as the material to check. A source reference tells a reader exactly where a claim can be inspected.
P1: Registrations counts registered people within each session. Attended counts those registrants who attended. A person may appear in multiple sessions.
P2: Reminder emails began in May. The venue also changed in May. Organizers believe reminders improved attendance.
P3: Feedback was optional. Feedback response counts are unavailable. The meaning of the Positive column is unspecified.
T1 records four Cedar Learning Center sessions. A dash (—) is an unavailable value.
| Row | Month | Session | Registrations | Attended | Positive |
|---|---|---|---|---|---|
| R1 | April | Morning | 20 | 15 | 8 |
| R2 | April | Evening | 30 | 15 | — |
| R3 | May | Morning | 25 | 20 | 12 |
| R4 | May | Evening | 25 | 15 | 9 |
Check one claim at a time. A sentence can contain several claims, and each may need a different reference.
For a text claim, locate the exact paragraph. For a number, locate the row and column that contain it. Then compare the full wording of the claim with the source. A reference that mentions the topic is not enough: it must support the claim's scope and detail.
Example
Statement: “May Morning had 25 registrations, and organizers believe reminders improved attendance.”
Split it into two checks:
The second reference supports what the organizers believe. Keep that wording; do not replace it with a stronger claim about what the records prove.
A claim-to-source map makes separate support paths visible.

One claim may point to a paragraph, while another points to a specific table cell.
After locating a reference, assign a verdict. The verdict concerns the claim as written—not whether its topic appears somewhere in the material.
Use the source wording and values to decide whether a claim is supported, contradicted, or still unresolved.
| Verdict | Use when | Example check |
|---|---|---|
| Supported | The source states the whole claim. | P1 states that a person may appear in multiple sessions. |
| Contradicted | The source conflicts with the claim. | T1:R4 (Attended) records 15, not a claim of 20. |
| Unresolved | The source does not establish a needed detail. | P2 says both events occurred in May, not which happened first. |
Match each claim to its source reference and verdict.
Tap an item and then its matching pair.

Step 3 of 7
Identify missing values, unclear labels, and counting-unit limits that make a conclusion unreliable.
Before accepting a conclusion, inspect what the source does not establish.
P1: Registrations counts registered people within each session. Attended counts those registrants who attended. One person may appear in more than one session.
P3: Feedback was optional, feedback response counts are unavailable, and the meaning of Positive is unspecified.
These limits matter even when a table looks complete. A blank-looking unavailable value, an unclear category, and repeated people across sessions each require a different clarification.
T1 records four Cedar Learning Center sessions. Keep the heading Positive exactly as supplied: P3 does not define it.
| Row | Month | Session | Registrations | Attended | Positive |
|---|---|---|---|---|---|
| R1 | April | Morning | 20 | 15 | 8 |
| R2 | April | Evening | 30 | 15 | — |
| R3 | May | Morning | 25 | 20 | 12 |
| R4 | May | Evening | 25 | 15 | 9 |
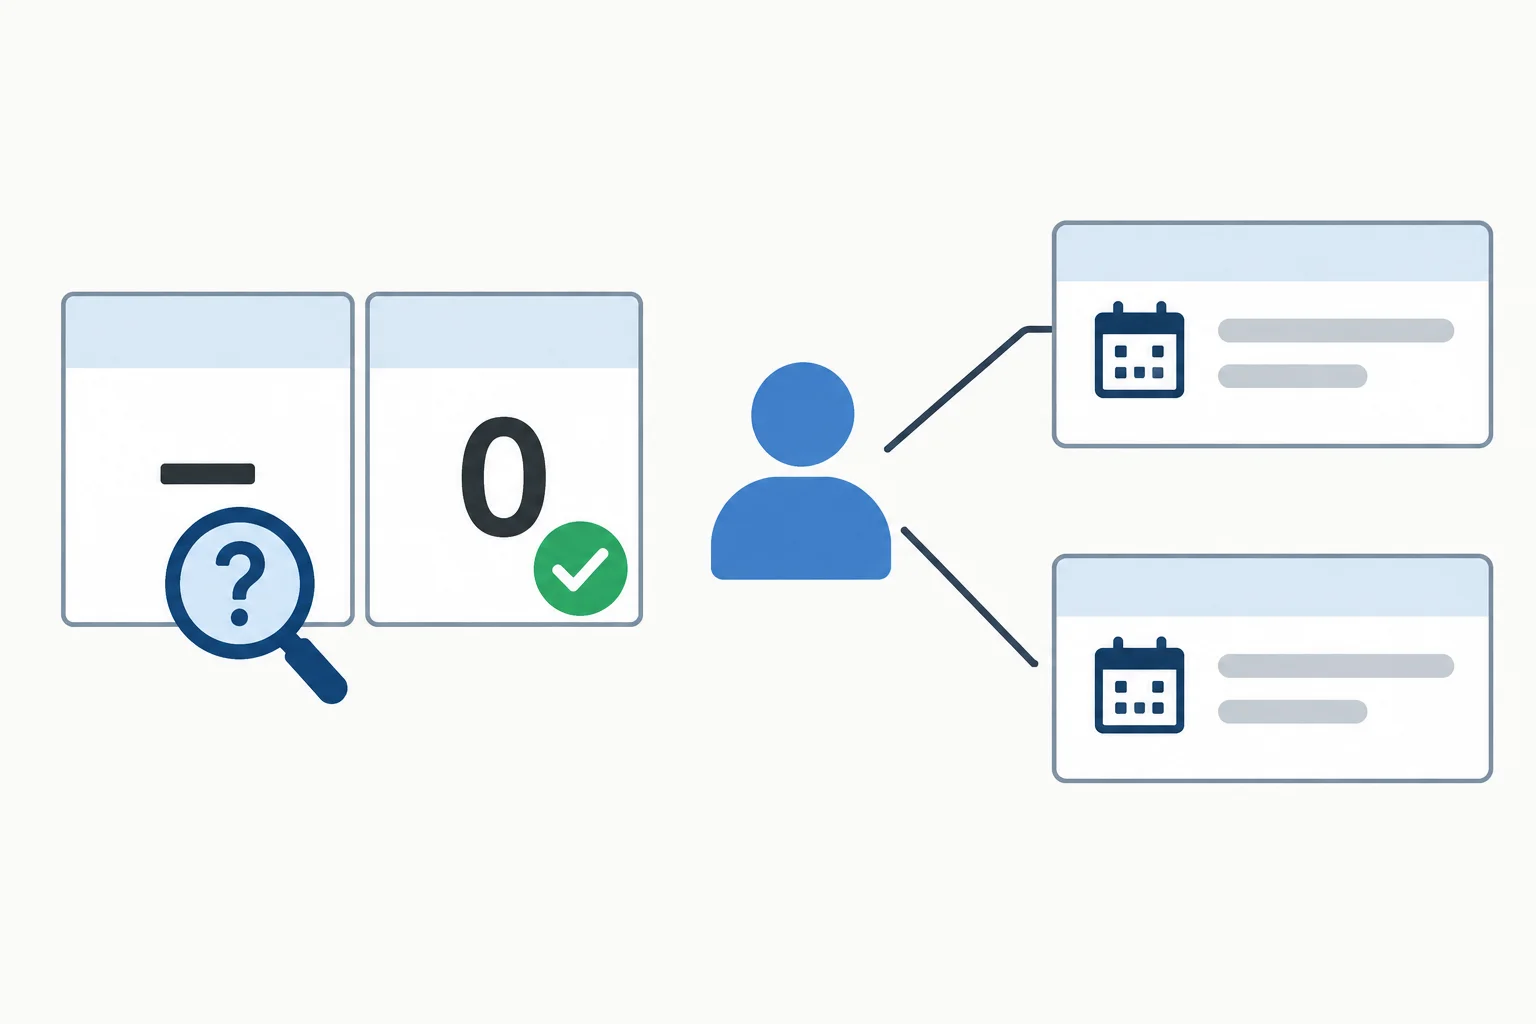
A dash means the value is unavailable; it is not evidence of a recorded zero. Because one person can appear in multiple sessions, session records cannot automatically be counted as distinct people.
Use a precise question for each gap.
—. Do not replace it with 0, and do not infer why it is unavailable.Ask for the missing definition, count, or identifier. Do not fill the gap with an assumption.
Example
Evidence
Interpretation
Assumptions
Unresolved questions
An assistant writes: “May had a higher feedback percentage than April, and all registration records in T1 represent distinct people.” Which clarification is needed before this conclusion can be checked?

Step 4 of 7
Independently rebuild Cedar Learning Center totals from T1, reconcile monthly and overall values, and preserve the difference between attendance records and unique people.
To check a total, return to the source values—not to the assistant’s intermediate arithmetic.
P1 states that Registrations counts registered people within each session, and Attended counts those registrants who attended. A person may appear in multiple sessions. Therefore, a sum of Attended values is a count of attendance records across sessions, not a count of unique people.
Use T1 as the original record for every calculation in this step.
| Row | Month | Session | Registrations | Attended | Positive |
|---|---|---|---|---|---|
| R1 | April | Morning | 20 | 15 | 8 |
| R2 | April | Evening | 30 | 15 | — |
| R3 | May | Morning | 25 | 20 | 12 |
| R4 | May | Evening | 25 | 15 | 9 |
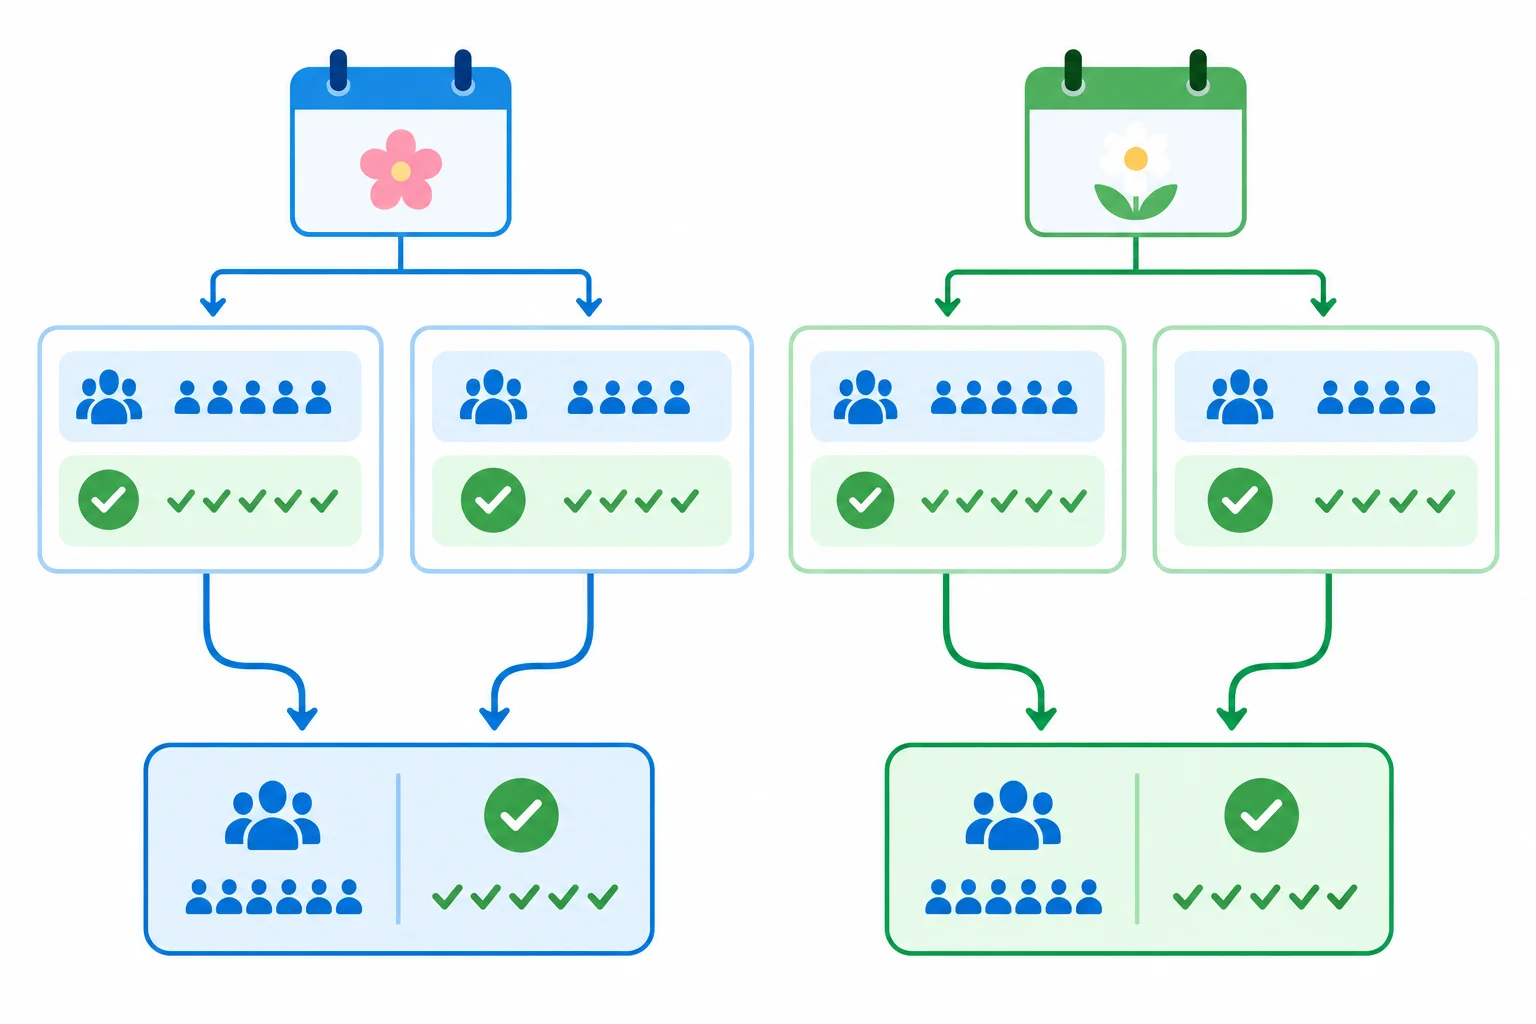
Group the relevant session rows by month, then add values from one column at a time.
Use the same checking sequence each time:
As a basic consistency check in T1, an Attended value cannot be greater than Registrations for the same row.
Example
Claim to check: April registrations total 50.
Trace the values to T1:R1–R2 (Registrations). Rebuild the arithmetic from those cells:
20 + 30 = 50 registrations
This supports the claim for April registrations. It does not say anything about attendance records, because those are in a different column.
Tip
For an independent check, enter the source values from T1 into a calculator yourself. Asking the assistant to repeat its subtotal only repeats a result; it does not independently test the arithmetic.
T1 contains ___ listed sessions.
April attendance records total ___.
May attendance records total ___.
Across all listed sessions, registrations total ___.
Across all listed sessions, attendance records total ___.
Write one concise audit result using T1 and P1. Include the number of listed sessions, the April and May attendance totals, the overall registrations total, and the overall attendance total. State why the attendance total must not be described as a count of unique people.
Write at least 110 characters (0/110).

Step 5 of 7
A percentage answers a part-of-a-whole question. Before calculating, name the scope: which sessions are included, what is the part, and what is the matching whole.
For an attendance rate, use Attended / Registrations × 100 for the same stated sessions. P1 defines Registrations as people registered within each session and Attended as those registrants who attended. When sessions are combined, describe the numerator as attendance records, not unique people: one person may appear in more than one session.
A number can be arithmetically correct yet answer the wrong question if its denominator comes from a different scope.
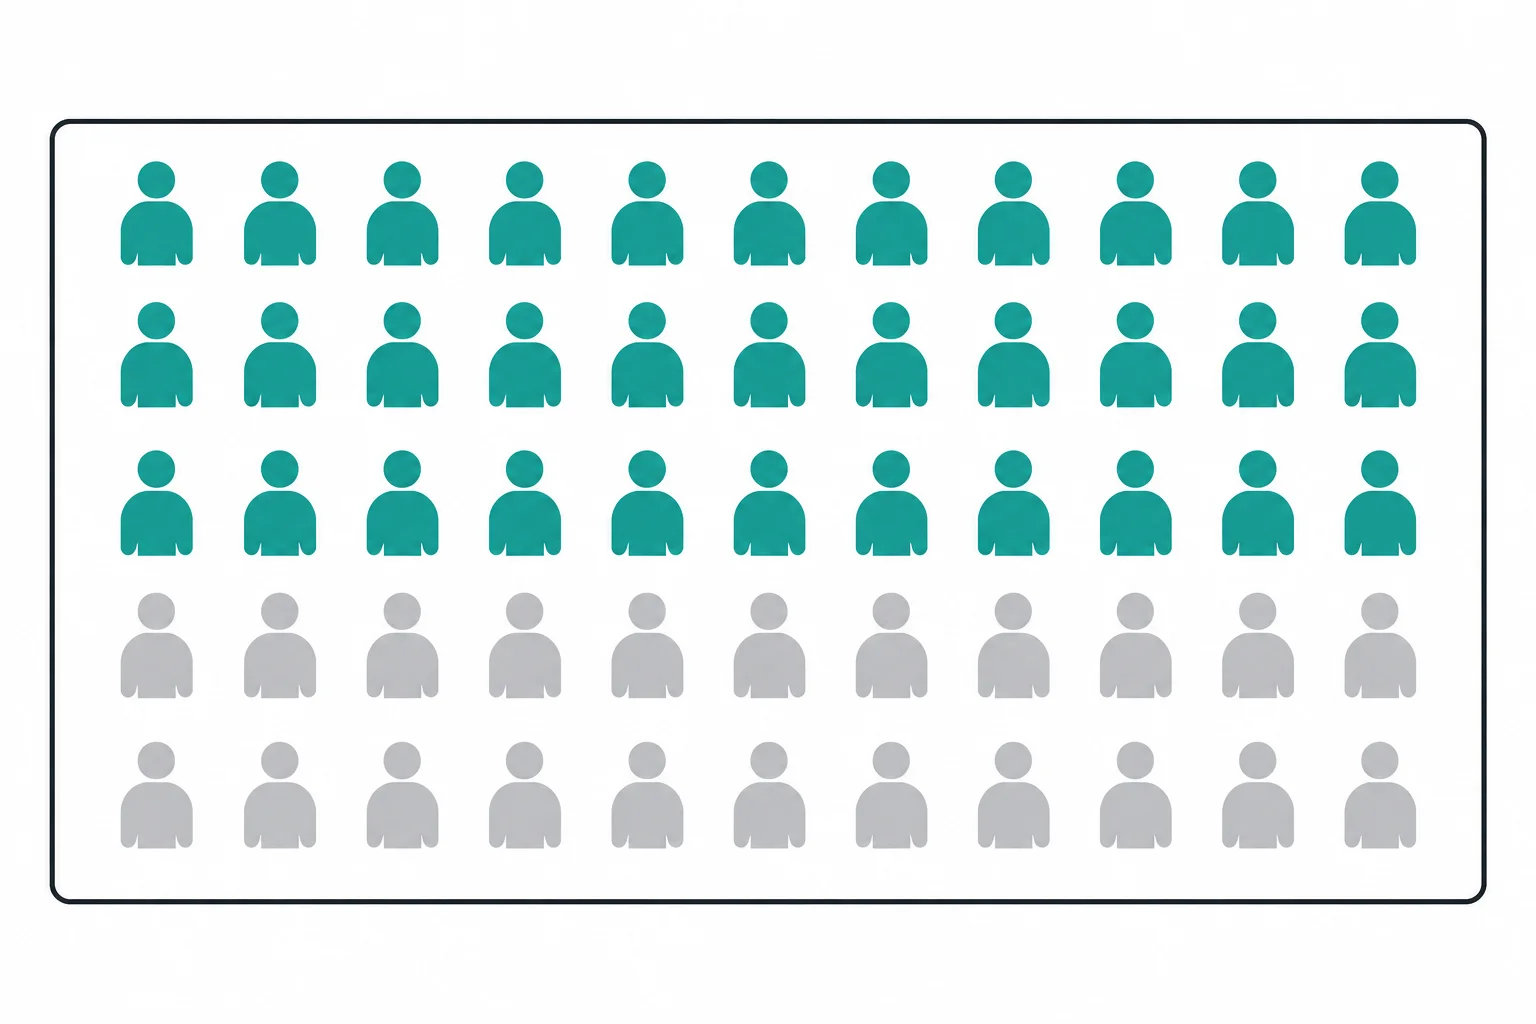
For April, 30 attendance records are the part and 50 registrations are the matching whole.
T1 contains the source values. Keep each column separate: Registrations is the denominator for an attendance rate; Attended is the numerator. The Positive column is not an attendance count.
| Row | Month | Session | Registrations | Attended | Positive |
|---|---|---|---|---|---|
| R1 | April | Morning | 20 | 15 | 8 |
| R2 | April | Evening | 30 | 15 | — |
| R3 | May | Morning | 25 | 20 | 12 |
| R4 | May | Evening | 25 | 15 | 9 |
Example
First calculate each session using its own counts:
15 / 20 × 100 = 75%
15 / 30 × 100 = 50%
These session rates should not simply be averaged when the session sizes differ. Instead, add the relevant attendance records and registrations first, then divide:
(15 + 15) / (20 + 30) × 100 = 60%
The simple average of 75% and 50% is 62.5%, which does not represent the combined April attendance rate.
An assistant writes: “For April, the attendance rate is 30 / 30 × 100 = 100%.” What is the error?
Which source values should be combined to calculate the May attendance rate?
P3 says feedback was optional, feedback response counts are unavailable, and the meaning of Positive is unspecified. What verdict applies to the claim “The feedback percentage was 58%”?
Using T1:R1–R2, calculate the April attendance rate:
(15 + 15) / (20 + 30) × 100 = ___ %
Using T1:R3–R4, calculate the May attendance rate:
(20 + 15) / (25 + 25) × 100 = ___ %
Using all rows in T1, calculate the combined attendance rate:
(15 + 15 + 20 + 15) / (20 + 30 + 25 + 25) × 100 = ___ %

Step 6 of 7
Revise a conclusion so it keeps checked findings while avoiding an unproven explanation.
A checked difference tells you what the records show, not automatically why it happened.
For Cedar Learning Center, the April attendance rate is 30 / 50 × 100 = 60%, using T1:R1–R2 (Registrations, Attended). The May attendance rate is 35 / 50 × 100 = 70%, using T1:R3–R4 (Registrations, Attended). The records therefore show a 10-percentage-point increase.
P2 says reminder emails began in May, the venue also changed in May, and organizers believe reminders improved attendance. That is evidence of the organizers’ belief and of both changes occurring in May. It is not proof that reminders caused the increase.
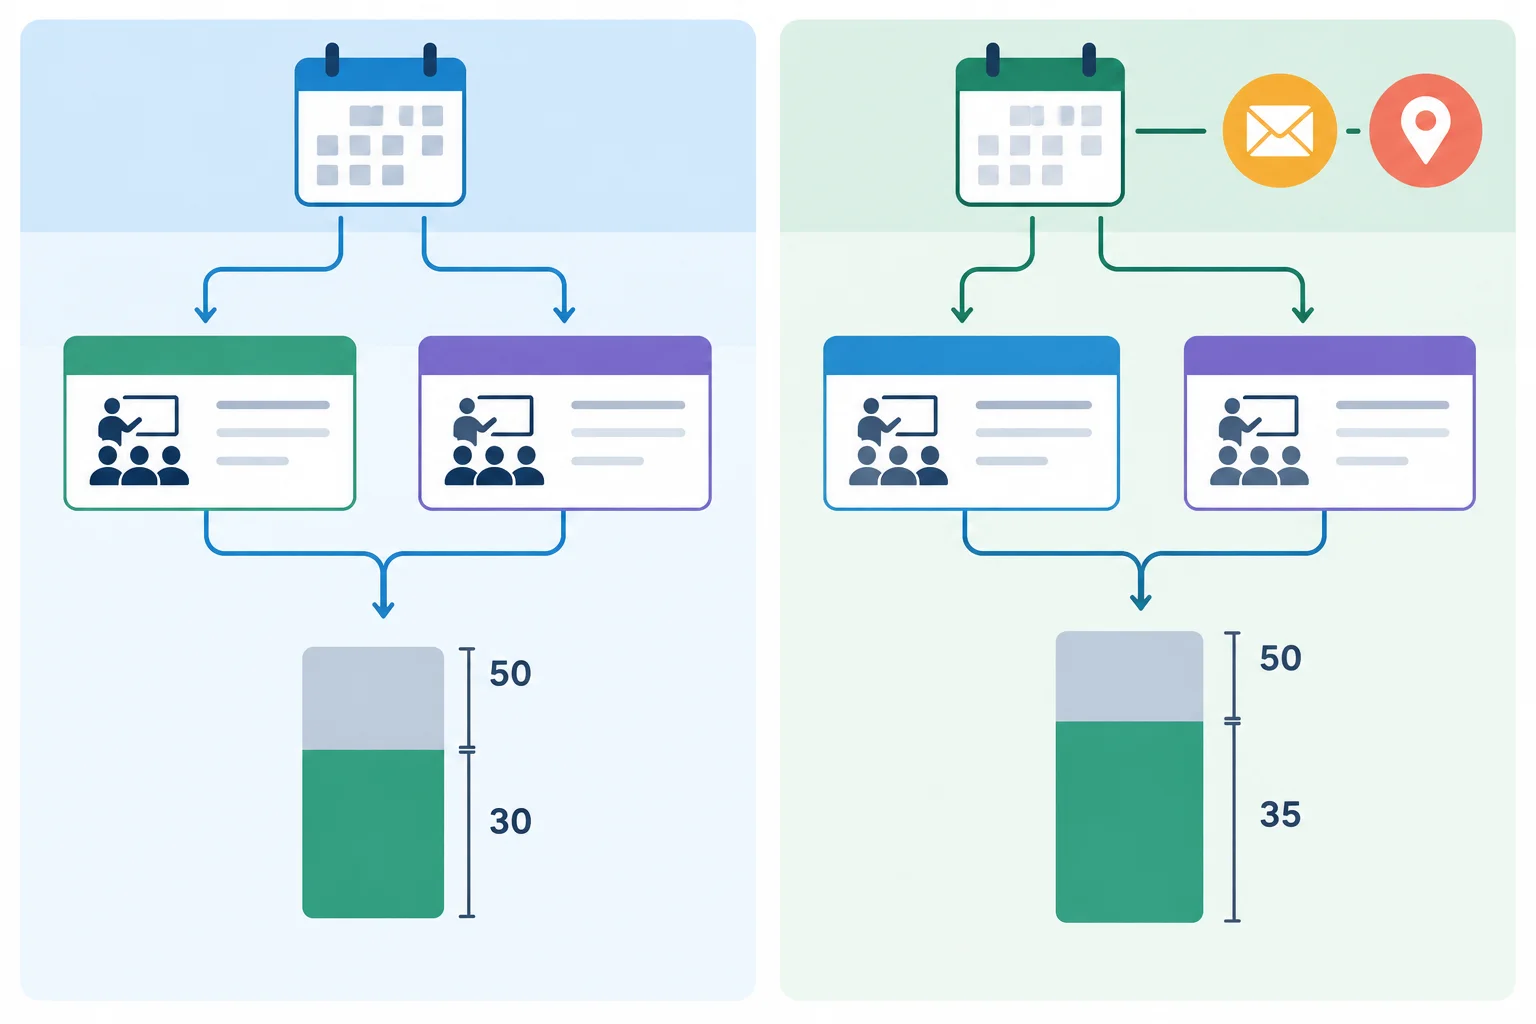
T1 shows a higher attendance rate in May. P2 places both reminder emails and a venue change in May, so this comparison does not isolate the effect of reminders.
Example
Evidence
T1:R1–R2 (Registrations, Attended) gives an April attendance rate of 30 / 50 × 100 = 60%. T1:R3–R4 (Registrations, Attended) gives a May attendance rate of 35 / 50 × 100 = 70%. P2 reports that reminder emails began in May, the venue changed in May, and organizers believe reminders improved attendance.
Interpretation
The overall attendance rate was 10 percentage points higher in May than in April.
Assumptions
Saying that reminders caused the increase assumes that the venue change and other possible differences did not affect attendance.
Unresolved questions
The supplied material does not show whether reminders, the venue change, or another factor explains the difference.
Tip
A precise revision does not need a vague word such as “perhaps.” State the exact limit instead: the May comparison cannot determine the effect of reminders because the venue also changed in May.
Which conclusion stays within the available evidence?
Rewrite this conclusion in 2–4 sentences:
“Reminder emails caused Cedar Learning Center’s May attendance rate to rise.”
Use the checked April and May rates from the previous screen. Distinguish the organizers’ belief in P2 from a verified cause, and name the venue change in May as the specific reason the explanation remains unresolved.
Write at least 120 characters (0/120).

Step 7 of 7
Use one audit path for each claim: locate its source, check any arithmetic independently, check whether a label or counting unit is defined, and then decide how far the conclusion can go. A polished response can contain both reliable and unreliable claims.

Do not accept or reject a whole assistant response at once; audit each claim separately.
P1: Registrations counts registered people within each session. Attended counts those registrants who attended. A person may appear in multiple sessions.
P2: Reminder emails began in May, the venue also changed in May, and organizers believe reminders improved attendance.
P3: Feedback was optional, feedback response counts are unavailable, and the meaning of the Positive column is unspecified.
Use the table name and row-and-column references when you trace numerical claims.
| Row | Month | Session | Registrations | Attended | Positive |
|---|---|---|---|---|---|
| R1 | April | Morning | 20 | 15 | 8 |
| R2 | April | Evening | 30 | 15 | — |
| R3 | May | Morning | 25 | 20 | 12 |
| R4 | May | Evening | 25 | 15 | 9 |
Example
Evidence
Interpretation
Assumptions
Unresolved questions
Which claim from the response can be retained as Supported?
Using a calculator or manual work, complete the independently checked May combined attendance rate:
35 / 50 × 100 = ___ %
P1: Registrations counts registered people within each session. Attended counts those registrants who attended. A person may appear in multiple sessions.
P2: Reminder emails began in May, the venue also changed in May, and organizers believe reminders improved attendance.
P3: Feedback was optional, feedback response counts are unavailable, and the meaning of the Positive column is unspecified.
Use T1 as the source for your traceable calculation.
| Row | Month | Session | Registrations | Attended | Positive |
|---|---|---|---|---|---|
| R1 | April | Morning | 20 | 15 | 8 |
| R2 | April | Evening | 30 | 15 | — |
| R3 | May | Morning | 25 | 20 | 12 |
| R4 | May | Evening | 25 | 15 | 9 |
Example
Evidence
Interpretation
Assumptions
Unresolved questions
Write a corrected, traceable audit of the response above. Use these headings in this exact order: Evidence, Interpretation, Assumptions, Unresolved questions.
Your audit must:
Use the source packet and your own arithmetic, not a repeated assistant calculation.
Write at least 280 characters (0/280).
Example
Evidence
Interpretation
Assumptions
Unresolved questions
Summary
Use this compact checklist whenever you inspect an assistant analysis of supplied material.
Congratulations! You completed: Checking AI Analysis of Text and Tables
Thousands of online courses in video, ebooks and audiobooks.
To test your knowledge during online courses
Generated directly from your cell phone's photo gallery and sent to your email

Download our app via QR Code or the links below:.



Carry knowledge in your pocket.
Download the Cursa app.
There are hundreds of free courses available, with a free certificate of completion that is saved in your mobile image gallery.
Download the app to access the Course Completion Certificate for Free.


+ 10 million
students

Free and Valid
Certificate

60 thousand free
exercises

4.8/5 rating in
app stores

Free courses in
video and ebooks