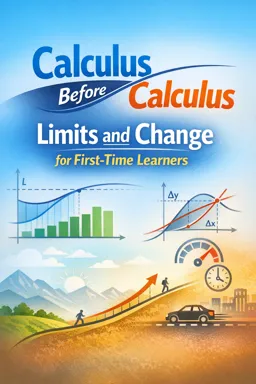

A free ebook introducing limits, slopes, rates of change, and area under curves to prepare first-time learners for calculus.
Free ebook content
-

Thinking in Graphs: Functions as Change You Can See
+ Exercise: A graph looks very steep in one section. Which action best helps you decide whether the function is truly changing quickly there (in real units) rather than just appearing steep?
-
Approaching a Value: Building Limit Intuition Without Heavy Algebra
+ Exercise: Which situation best shows that a two-sided limit can exist even if the function value at the point is different?
-
Continuity as Reliable Change: When Small Inputs Mean Small Output Shifts
+ Exercise: Which situation describes a removable discontinuity at x = a?


-
Average Rate of Change: Slope as a Measure of How Fast Things Vary
+ Exercise: Which statement best describes what the average rate of change from x=a to x=b represents?
-
Instantaneous Rate of Change: From Secant Lines to the Tangent Idea
+ Exercise: Which procedure best estimates the instantaneous rate of change of f at x=a using secant slopes?
-
Change in Real Situations: Speed, Growth, and Accumulation From Graphs
+ Exercise: On a rate–time graph used to estimate total accumulation over an interval, what does a portion of the graph below the time axis represent?
-
Area Under a Curve: Accumulating Quantity With Rectangles and Estimation
+ Exercise: For a function that is increasing on an interval, which statement best describes how left- and right-endpoint rectangle sums relate to the true area under the curve?
-
Connecting Slope and Area: Previewing Derivatives and Integrals Through Meaning
+ Exercise: A rate function r(t) is negative for a time interval. What does this imply about the accumulated change function A(t) over that interval?
-
Common Misconceptions: Where Limits, Slopes, and Areas Usually Go Wrong
+ Exercise: When deciding whether a two-sided limit exists at x = a, what must be true about the left-hand and right-hand behavior?
-
Calculus Readiness Checklist: Skills to Start Derivatives and Integrals Confidently
+ Exercise: When simplifying a rational expression, which approach best avoids common early calculus mistakes?
About the free ebook
Calculus Before Calculus: Limits and Change for First-Time Learners
Build a meaningful foundation for calculus by learning to see mathematics as change, motion, and accumulation. This free ebook introduces the central ideas behind derivatives and integrals before asking you to use formal rules or dense algebra.
Make sense of change through graphs
Graphs turn abstract relationships into visual stories. You will explore how functions change, how slope describes variation, and why approaching a value can matter more than reaching it. Limits are presented as a practical way to reason about what happens near a point.
Understand rates, slopes, and motion
Move from average rate of change to the idea of an instantaneous rate. By comparing secant lines with tangent lines, you can develop an intuitive understanding of speed and other changing quantities. Real-world graph examples connect these ideas to growth, movement, and accumulation.
Explore area as accumulated quantity
Learn why area under a curve can represent total distance, total growth, or another quantity built up over time. Rectangle estimates provide a visual bridge to integral thinking without requiring advanced techniques.
Prepare for formal calculus with confidence
The ebook also addresses common misunderstandings about limits, slopes, and areas. It closes by helping you identify the graph-reading, algebra, and reasoning skills that support a successful start with derivatives and integrals.
- Develop limit intuition without heavy symbolic work
- Interpret slope as a rate of change
- Connect tangent ideas to instantaneous change
- Use area to reason about accumulation
How does a limit differ from the value of a function?
A limit describes the value a function approaches near an input, even if the function has a different value or no value at that exact input.
Why is a tangent line connected to instantaneous speed?
Its slope represents the rate of change at one moment, such as an object's speed at a particular instant.
What can area under a graph represent?
It can represent an accumulated total, such as distance from a speed-time graph or growth over time.
This ebook includes:

10 content chapters

Digital certificate of course completion (Free)

Exercises to train your knowledge

100% free, from content to certificate
Ready to get started?

 recommended
In the app you will also find...

Over 5,000 free courses
Programming, English, Digital Marketing and much more! Learn whatever you want, for free.

Study plan with AI
Our app's Artificial Intelligence can create a study schedule for the course you choose.

From zero to professional success
Improve your resume with our free Certificate and then use our Artificial Intelligence to find your dream job.
You can also use the QR Code or the links below.