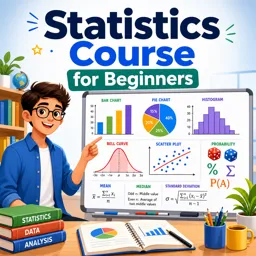

Free ebook on statistics fundamentals: summarize data, interpret uncertainty, evaluate evidence, and make responsible decisions.
Free ebook content
-

Statistical Thinking for Data-Driven Decisions
+ Exercise: When comparing Option A vs Option B, what best reflects statistical thinking about the observed difference in sample conversion rates?
-
Data Types, Measurement, and Organizing a Dataset
+ Exercise: A fitness study records step counts as columns steps_day1, steps_day2, and steps_day3 for each participant. Which change best converts this dataset into tidy form for analysis?
-
Describing Categorical Data with Counts, Proportions, and Rates
+ Exercise: In a two-way table comparing Premium purchases between New and Returning customers, which calculation correctly gives the conditional percentage of Premium purchases among New customers?
-
Describing Quantitative Data with Center and Spread
+ Exercise: A dataset of delivery times is right-skewed because it includes one unusually large value. Which pair of statistics is most appropriate to describe a typical delivery time and the typical variability without being dominated by that extreme value?
-
Understanding Distributions: Shape, Skew, and Outliers
+ Exercise: When interpreting a density plot for a continuous variable, which statement best describes how to judge where observations are most common?


-
Relationships Between Variables: Correlation, Association, and Confounding
+ Exercise: A scatterplot shows a clear U-shaped pattern between two quantitative variables, but the Pearson correlation r is close to 0. What is the best interpretation?
-
From Samples to Populations: Sampling, Bias, and Variability
+ Exercise: A team increases its sample size from 50 to 500 but still uses a sampling frame that systematically misses a key subgroup. What is the most likely effect on their estimate?
-
Probability Basics for Interpreting Uncertainty
+ Exercise: A shipment is rejected if it is late (L) or damaged (G). If P(L)=0.12, P(G)=0.07, and P(L ∩ G)=0.02, what is P(L ∪ G) and why is the intersection subtracted?
-
Random Variables and Common Distribution Patterns
+ Exercise: A team models a single page view as a Bernoulli random variable where 1 = “user clicked” and 0 = “user did not click.” Which statement best interprets the parameter p?
-
Estimation: Confidence Intervals as Ranges of Plausible Values
+ Exercise: Which statement best describes the correct long-run interpretation of a 95% confidence interval?
-
Hypothesis Testing: Evaluating Evidence Without Overstating Results
+ Exercise: In an A/B test, the p-value is greater than α = 0.05. Which interpretation best matches correct hypothesis-testing reasoning?
-
Reading Statistical Results and Making Responsible Decisions
+ Exercise: When deciding whether to roll out a new checkout design after an A/B test, which interpretation best reflects a disciplined use of effect size, confidence intervals, and decision thresholds?
About the free ebook
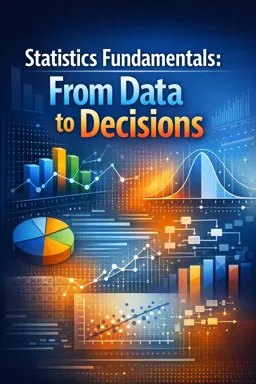
Statistics Fundamentals: From Data to Decisions
This free ebook introduces the essential ideas behind statistical reasoning and shows how data can support clear, responsible decisions. It builds practical understanding of how to collect, organize, summarize, interpret, and communicate information without overstating what the numbers can prove.
Build confidence with data
Learn to distinguish data types and measurement scales, organize datasets, and describe categorical and quantitative variables using appropriate summaries. The ebook explains center, spread, distributions, skewness, and outliers so readers can recognize meaningful patterns rather than rely on a single number.
Interpret relationships and uncertainty
Explore correlation, association, confounding, sampling, bias, and variability. These foundations help you evaluate whether an observed pattern is useful evidence or may be influenced by flawed data collection or hidden factors.
Use inference responsibly
The ebook presents probability, random variables, common distribution patterns, confidence intervals, and hypothesis testing in accessible terms. It emphasizes that statistical conclusions describe evidence and uncertainty, not absolute certainty.
What you will be able to do
- Select suitable summaries for categorical and numerical data.
- Interpret graphs, proportions, rates, averages, and variation.
- Recognize sampling bias, confounding, and misleading claims.
- Read confidence intervals and hypothesis-test results carefully.
- Make data-informed decisions with appropriate caution.
Statistics Fundamentals: From Data to Decisions is a useful foundation for school statistics, research reading, surveys, and everyday data literacy.
What is the difference between correlation and causation?
Correlation shows that variables move together; it does not prove that one variable causes the other.
How should a confidence interval be interpreted?
It gives a range of plausible values for a population parameter based on sample data and a stated confidence level.
Why can a sample produce biased statistical results?
Bias can occur when the sample systematically excludes, overrepresents, or influences parts of the population.
This ebook includes:

12 content chapters

Digital certificate of course completion (Free)

Exercises to train your knowledge

100% free, from content to certificate
Ready to get started?

 recommended
In the app you will also find...

Over 5,000 free courses
Programming, English, Digital Marketing and much more! Learn whatever you want, for free.

Study plan with AI
Our app's Artificial Intelligence can create a study schedule for the course you choose.

From zero to professional success
Improve your resume with our free Certificate and then use our Artificial Intelligence to find your dream job.
You can also use the QR Code or the links below.