Duration of the online course: 31 hours and 55 minutes
4.81
(32)
Master essential statistics skills in a free online course—analyze data, understand probability, and interpret results with confidence. Learn fast, earn more.
In this free course, learn about
Core statistics vocabulary: data, population vs sample, parameter vs statistic
Types of data & levels of measurement (nominal, ordinal, interval, ratio)
Sampling methods and how to build a random sample; observation vs experiment
Summarizing data with frequency tables and histograms
Measures of center: mean, median, mode, and when each is appropriate
Measures of spread: sample standard deviation, variance, and interpreting variability
z-scores, percentiles, quartiles, and comparing distributions using standard scores
Probability basics and rules: addition, multiplication ('and'), complements, 'at least one'
Counting methods: fundamental counting rule, permutations, combinations
Discrete distributions: binomial outcomes, parameters (p), mean and standard deviation
Normal distribution & continuous variables; using the standard normal via z-scores
Sampling distributions and the central limit theorem requirements and implications
Confidence intervals for proportions, means (z vs t), and variance/SD (chi-square)
Hypothesis testing framework for proportions, means, and variance/SD; choosing test stats
Course Description
Statistics is the language behind informed decisions, from classroom projects to real-world headlines and workplace reports. In this free online course, you will learn how to think statistically and turn raw information into clear conclusions. Instead of memorizing formulas without context, you will build an intuitive understanding of what data represents, how it is collected, and what makes an analysis reliable.
You will start by getting comfortable with the foundational terms that appear throughout statistics, then move into how different kinds of data are categorized and measured. From there, you will learn practical ways to gather information using sampling methods that reduce bias and improve accuracy. As your confidence grows, you will work with tools that summarize data visually and numerically, making it easier to spot patterns, compare groups, and communicate results.
The course also helps you develop fluency with the core measurements used to describe datasets, including the typical value and how spread out values are. You will learn how to standardize values using z-scores and interpret percentiles and quartiles, which are common in testing, business metrics, and performance reports. You will then connect these descriptive ideas to probability, where you will learn to reason about uncertainty, use counting strategies, and work with rules for combining events.
As you progress, you will explore probability distributions and see how models like the binomial and normal distributions help estimate outcomes and interpret real measurements. You will also learn the logic of sampling distributions and why the central limit theorem is so powerful for drawing conclusions from samples. Finally, you will practice making evidence-based claims through confidence intervals and hypothesis testing, including scenarios where population variation is known or unknown. By the end, you will be able to read statistical results with clarity and apply statistical thinking to academic work and everyday decisions.
Course content
Video class: Statistics Lecture 1.1: The Key Words and Definitions For Elementary Statistics17m
Exercise: _What does the term "data" mean in statistics?
Video class: Statistics Lecture 1.3: Exploring Categories of Data, Levels of Measurement31m
Exercise: _Which type of data is not related to numbers and mathematical operations are meaningless for it?
Video class: Statistics Lecture 1.5: Sampling Techniques. How to Develop a Random Sample31m
Exercise: _What is the main difference between an observation and an experiment in statistics?
Video class: Statistics Lecture 2.2: Creating Frequency Distribution and Histograms1h07m
Exercise: _What is a frequency distribution in statistics?
Video class: Statistics Lecture 3.2: Finding the Center of a Data Set. Mean, Median, Mode1h11m
Exercise: _What is the most common way to describe the center of a data set?
Video class: Statistics Lecture 3.3: Finding the Standard Deviation of a Data Set1h56m
Exercise: How do we calculate standard deviation for a sample?
Video class: Statistics Lecture 3.4: Finding Z-Score, Percentiles and Quartiles, and Comparing Standard Deviation1h31m
Exercise: _What is a z-score?
Video class: Statistics Lecture 4.2: Introduction to Probability1h42m
Exercise: _What does a low probability mean in statistics?
Video class: Statistics Lecture 4.3: The Addition Rule for Probability1h09m
Exercise: _In the game of craps, what are the two numbers that will double your money if rolled on the first roll?
Video class: Statistics Lecture 4.4: The Multiplication Rule for And Probabilities.1h06m
Exercise: What does the 'and' imply in the multiplication rule?
Video class: Statistics Lecture 4.5: Probability of Complementary Events with At Least One32m
Exercise: What is the probability of getting at least one head when flipping a coin three times?
Video class: Statistics Lecture 4.7: Fundamental Counting Rule, Permutations and Combinations1h37m
Exercise: _What is the fundamental counting rule in statistics?
Video class: Statistics Lecture 5.2: A Study of Probability Distributions, Mean, and Standard Deviation1h12m
Video class: Statistics Lecture 5.3: A Study of Binomial Probability Distributions1h32m
Exercise: _What are the two outcomes in a binomial probability distribution?
Video class: Statistics Lecture 5.4: Finding Mean and Standard Deviation of a Binomial Probability Distribution42m
Exercise: What does the letter 'P' represent in a binomial distribution?
Video class: Statistics Lecture 6.2: Introduction to the Normal Distribution and Continuous Random Variables2h11m
Exercise: What type of distribution is characterized by a symmetric bell-shaped curve?
Video class: Statistics Lecture 6.3: The Standard Normal Distribution. Using z-score, Standard Score56m
Video class: Statistics Lecture 6.4: Sampling Distributions Statistics. Using Samples to Approx. Populations50m
Exercise: _What is the underlying idea of sampling distributions?
Video class: Statistics Lecture 6.5: The Central Limit Theorem for Statistics. Using z-score, Standard Score1h31m
Exercise: _What is the first requirement for using the central limit theorem?
Video class: Statistics Lecture 7.2: Finding Confidence Intervals for the Population Proportion2h24m
Video class: Statistics Lecture 7.3: Confidence Interval for the Sample Mean, Population Std Dev -- Known49m
Exercise: _When dealing with confidence intervals for population means, what is assumed to be known?
Video class: Statistics Lecture 7.4: Confidence Interval for the Sample Mean, Population Std Dev -- Unknown1h00m
Exercise: _What type of score do we use to estimate the population mean when we don't know Sigma?
Video class: Statistics Lecture 7.5: Confidence Intervals for Variance and Std Dev. Chi-Squared Distribution.32m
Exercise: What distribution is used for estimating population variance?
Video class: Statistics Lecture 8.2: An Introduction to Hypothesis Testing2h26m
Exercise: Determine the type of hypothesis test based on a claim
Video class: Statistics Lecture 8.3: Hypothesis Testing for Population Proportion1h10m
Exercise: _What is the definition of proportion in statistics?
Video class: Statistics Lecture 8.4: Hypothesis Testing for Population Mean. Population Std Dev is Known.27m
Exercise: _What is the magic number for sample size (n) when conducting a hypothesis test for the population mean where Sigma is known?
Video class: Statistics Lecture 8.4: Hypothesis Testing for Population Mean. Population Std Dev is Unknown.38m
Exercise: _What test statistic would you use when you don't know the population standard deviation (Sigma) and you have a sample size of 50, and the sample standard deviation (s) is known?
Video class: Statistics Lecture 8.6: Hypothesis Testing Involving Variance and Standard Deviation.14m
Exercise: What test statistic is used for hypothesis testing of population standard deviation?
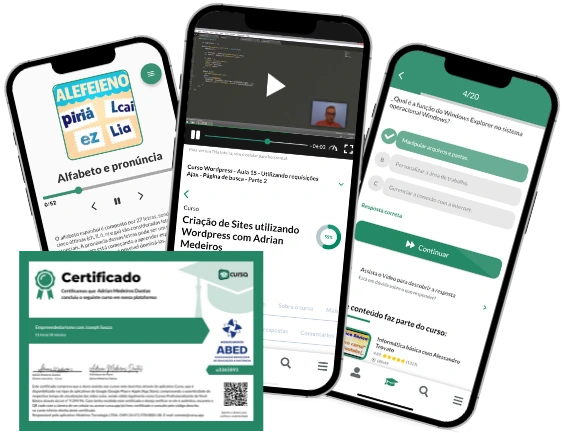
This free course includes:
31 hours and 55 minutes of online video course
Digital certificate of course completion (Free)
Exercises to train your knowledge
100% free, from content to certificate
Ready to get started?Download the app and get started today.