Free Course Image Applied Statistics

Free online courseApplied Statistics

Duration of the online course: 16 hours and 30 minutes

New course

Enroll in a comprehensive free online course on Applied Statistics. Learn data classification, probability, confidence intervals, hypothesis testing, regression analysis, and more.

In this free course, learn about

  • Introduction to Statistics and Data
  • Descriptive Statistics and Data Visualization
  • Foundations of Probability and Counting
  • Discrete Probability Distributions
  • Normal Distribution and the Central Limit Theorem
  • Confidence Intervals for Means and Proportions
  • Comparing Two Populations with Confidence Intervals
  • Foundations of Hypothesis Testing
  • Hypothesis Tests for One Population
  • Hypothesis Tests for Two Populations
  • Correlation and Simple Linear Regression

Course Description

Welcome to "Applied Statistics," an intensive 16-hour and 31-minute course designed to introduce you to the foundational concepts and practical applications of statistics. Although it currently has no reviews, this course is an essential starting point for anyone looking to build a solid understanding of statistical methods and their uses.

This course begins with an introduction to the fundamentals of statistics, covering topics such as classifying data and understanding different types of statistical studies, including experiments and observational studies. You will also learn how to critique published studies, ensuring you develop a critical eye for evaluating data and research findings.

Understanding data distribution is crucial, and this course delves into frequency distributions and various methods for displaying both qualitative and quantitative data. Additionally, you will learn how to analyze graphs to extract meaningful insights.

Measures of center and spread are essential concepts in statistics. You will explore how to calculate and interpret measures of center, such as mean and median, and measures of spread, including range, variance, and standard deviation. The course also introduces you to the Empirical Rule, Chebyshev's Theorem, and measures of relative position like z-scores and box plots.

Probability is a fundamental aspect of statistics, and this course provides a comprehensive introduction to probability rules, including the addition and multiplication rules, as well as permutations and combinations. You will practice calculating probabilities and learn about different probability distributions, such as binomial, Poisson, and hypergeometric distributions.

The normal distribution is a cornerstone of statistical analysis. This course covers the properties of the normal distribution, calculating areas under the curve, and determining probabilities. You will also learn how to approximate binomial distributions using the normal distribution and apply the Central Limit Theorem to means and proportions.

Confidence intervals are a key concept in inferential statistics. You will be introduced to constructing confidence intervals for population means and proportions, using both known and unknown standard deviations. The course also covers the Student's t-distribution, which is crucial for small sample sizes.

Comparing two populations is a common statistical task. This course guides you through comparing means and proportions for two populations, including cases with known and unknown variances, and dependent or paired samples.

Hypothesis testing is a critical skill in statistics. You will learn how to formulate and test hypotheses, interpret conclusions, and understand errors in testing. The course covers one-tailed and two-tailed tests for population means and proportions, as well as tests for two sample means with equal and unequal variances.

Finally, you will explore the relationship between variables through scatter plots, correlation, and linear regression. The course covers determining statistical significance for the Pearson correlation coefficient, creating and interpreting the Least Squares Regression Line (LSRL), and analyzing linear and multiple regression models, including prediction and confidence intervals.

Embark on this comprehensive journey through applied statistics and build the analytical skills you need to succeed in various fields requiring statistical expertise.

Course content

  • Video class: Statistics - 1.1 Intro to Statistics 13m
  • Exercise: In the context of statistics, which of the following statements best describes a parameter?
  • Video class: Statistics - 1.2 Classifying Data 14m
  • Exercise: How can data be classified based on its nature?
  • Video class: Statistics - 1.3.1 Introduction to Statistical Studies 08m
  • Exercise: In a statistical study aiming to analyze the impact of a new fertilizer on plant growth, what is the primary goal of the study?
  • Video class: Statistics - 1.3.2 Observational Studies 12m
  • Exercise: Which of the following best describes a stratified sampling method?
  • Video class: Statistics - 1.3.3 Experiments 12m
  • Exercise: What is the key feature that differentiates experiments from observational studies?
  • Video class: Statistics - 1.4 Critiquing a Published Study 06m
  • Exercise: What should you evaluate when critiquing a published study?
  • Video class: Statistics - 2.1 Frequency Distributions 19m
  • Exercise: Which of the following is true about frequency distributions?
  • Video class: Statistics - 2.2.1 Displaying Qualitative Data 09m
  • Exercise: What is the correct process to find the central angle for a pie chart?
  • Video class: Statistics - 2.2.2 Displaying Quantitative Data 13m
  • Exercise: What type of display shows quantitative data using a continuous number line and bars that represent frequency for each range of values?
  • Video class: Statistics - 2.3 Analyzing Graphs 06m
  • Exercise: What is an example of a misleading graph feature?
  • Video class: Statistics - 3.1 Measures of Center 20m
  • Exercise: Which measure of center should be used when dealing with skewed data that contains outliers?
  • Video class: Statistics - 3.2.1 Measures of Spread or Dispersion 16m
  • Exercise: Understanding Measures of Spread: Range and Standard Deviation
  • Video class: Statistics - 3.2.2 Empirical Rule and Chebyshev's Theorem 10m
  • Exercise: The empirical rule describes the distribution of values in a normal distribution. If a normal distribution has a mean of 500 and a standard deviation of 100, what percentage of data would fall between 400 and 600?
  • Video class: Statistics - 3.3.1 Measures of Relative Position 16m
  • Exercise: What is the 20th percentile in a dataset of 135 values?
  • Video class: Statistics - 3.3.2 Box Plots and the 5-Number Summary 13m
  • Exercise: When interpreting a box plot, what does the interquartile range (IQR) represent?
  • Video class: Statistics - 3.3.3 Intro to Z-Scores 12m
  • Exercise: How is a z-score calculated?
  • Video class: Statistics - 4.1 Intro to Probability 20m
  • Exercise: What is the probability that in two coin tosses, at least one of them comes up heads?
  • Video class: Statistics - 4.2 Addition Rule for Probability 20m
  • Exercise: What is the probability of rolling either a 3 or a 2 using a six-sided die?
  • Video class: Statistics - 4.3 Multiplication Rule for Probability 16m
  • Exercise: What is the probability of drawing two face cards with replacement?
  • Video class: Statistics - 4.4 Permutations and Combinations 19m
  • Exercise: How many permutations can be made with three friends if the order matters?
  • Video class: Statistics - 4.5 Probability and Counting Practice 14m
  • Exercise: A teacher wants to arrange books on a shelf using the rules of permutations and combinations. They have 5 different mathematics books and 3 different science books. The teacher wishes to arrange 4 mathematics books and all 3 science books. In how many different ways can the teacher arrange these books if the mathematics books must stay together?
  • Video class: Statistics - 5.1.1 Expected Value of Discrete Probability Distributions 16m
  • Video class: Statistics - 5.1.2 Variance and Standard Deviation of Discrete Probability Distributions 05m
  • Exercise: When calculating the variance of a discrete probability distribution, what step involves adjusting each value relative to the mean before applying the probability?
  • Video class: Statistics - 5.2 The Binomial Distribution 22m
  • Video class: Statistics - 5.3 The Poisson Distribution 12m
  • Exercise: In a city park, a fountain averages 3 burst sprays every hour. What is the probability that in two hours, the fountain will spray exactly 8 burst sprays?
  • Video class: Statistics - 5.4.1 The Hypergeometric Distribution 12m
  • Video class: Statistics - 5.4.2 Binomial, Poisson or Hypergeometric? 06m
  • Exercise: Which distribution is best suited for calculating the probability of a website receiving a certain number of views in a fixed period, given the average views per week?
  • Video class: Statistics - 6.1 The Normal Distribution and Z-Scores 11m
  • Video class: Statistics - 6.2 Area Under a Normal Distribution 19m
  • Exercise: In the context of normal distributions, what does the area under the curve represent?
  • Video class: Statistics - 6.3 Probabilities in a Normal Distribution 18m
  • Video class: Statistics - 6.4 Z-Scores in Reverse 16m
  • Exercise: In a normal distribution, if the mean is 100 and the standard deviation is 15, what is the z-score for a raw score of 115?
  • Video class: Statistics - 6.5 Approximating a Binomial Distribution With a Normal Distribution 18m
  • Video class: Statistics - 7.1 The Central Limit Theorem 09m
  • Exercise: According to the central limit theorem, under what condition can the sampling distribution of the sample mean be approximated to a normal distribution when the population distribution is not normal?
  • Video class: Statistics - 7.2 The Central Limit Theorem with Means 25m
  • Video class: Statistics - 7.3 The Central Limit Theorem with Proportions 15m
  • Exercise: In applying the central limit theorem to proportions, what condition must be met for the theorem to be applicable?
  • Video class: Statistics - 8.1.1 An Introduction to Confidence Intervals 08m
  • Video class: Statistics - 8.1.2 Estimating Population Means (? known) 19m
  • Exercise: Suppose you are constructing a 95% confidence interval for the mean number of books read per year by a population of students. The population standard deviation is known to be 3 books, and a random sample of 50 students shows a mean of 20 books. Which of the following is the critical value (z-score) used to determine the margin of error for this confidence interval?
  • Video class: Statistics - 8.1.3 Calculations With Estimating Population Means - Sigma Known 08m
  • Video class: Statistics - 8.2 Student's t-Distribution 13m
  • Exercise: When using the Student's t-distribution, which of the following is true regarding the shape of the distribution as the degrees of freedom increase?
  • Video class: Statistics - 8.3 Estimating Population Means (Unknown) 15m
  • Video class: Statistics - 8.4.1 Estimating Population Proportions 11m
  • Exercise: When estimating population proportions using confidence intervals, which condition must be met for the sample size?
  • Video class: Statistics - 8.4.2 Calculations With Estimating Population Proportions 09m
  • Video class: Statistics - 9.1 Comparing Two Population Means (? Known) 19m
  • Exercise: In applied statistics, when attempting to compare the study habits between two independent groups of students, which of the following statements is correct regarding the use of confidence intervals to determine differences in mean study times?
  • Video class: Statistics - 9.2.1 Comparing Two Population Means (Unknown, Unequal Variances) 14m
  • Video class: Statistics - 9.2.2 Comparing Two Population Means (Unknown, Equal Variances) 13m
  • Exercise: When comparing two population means with unknown population standard deviations and assuming equal variances, which of the following statements is true for calculating the degrees of freedom in a t-distribution?
  • Video class: Statistics - 9.3 Comparing Two Population Means (Sigma Unknown, Dependent/Paired) 12m
  • Video class: Statistics - 9.4 Comparing Two Population Proportions 09m
  • Exercise: When comparing two population proportions, which condition must be met to use the z-model for estimation?
  • Video class: Statistics - 10.1.1 Introduction to Hypothesis Testing 19m
  • Video class: Statistics - 10.1.2 Writing Hypotheses 07m
  • Exercise: When formulating hypotheses for hypothesis testing, which of the following best describes the null hypothesis?
  • Video class: Statistics - 10.1.3 Interpreting Conclusions to Hypothesis Tests 05m
  • Video class: Statistics - 10.1.4 Errors in Hypothesis Testing 07m
  • Exercise: In the context of hypothesis testing, what is typically denoted by the letter alpha (α)?
  • Video class: Statistics - 10.2.1 Hypothesis Testing for Population Means (? known) - Right-Tailed 20m
  • Video class: Statistics - 10.2.2 Hypothesis Testing for Population Means (? known) - Left-Tailed 08m
  • Exercise: A researcher claims that the mean age of women at the time of their first marriage is lower than 26.5 years. A simple random sample of 213 newlywed women shows a mean age of 26.3 years. Assuming the population standard deviation is 2.3 years, and using a 90% confidence level, what is the conclusion of the hypothesis test with respect to the researcher's claim?
  • Video class: Statistics - 10.2.3 Hypothesis Testing for Population Means (? known) - 2-Tailed 13m
  • Video class: Statistics - 10.3.1 Hypothesis Testing for Population Means (? unknown) - 1-Tailed 20m
  • Exercise: When conducting a hypothesis test for population means where the population standard deviation (sigma) is unknown, which distribution model is used?
  • Video class: Statistics - 10.3.2 Hypothesis Testing for Population Means (? unknown) - 2-Tailed 09m
  • Video class: Statistics - 10.4.1 Hypothesis Testing for Population Proportions - 1-Tailed 17m
  • Exercise: What is the correct decision to make when the p-value is greater than the alpha level in a one-tailed hypothesis test for population proportions?
  • Video class: Statistics - 10.4.2 Hypothesis Testing for Population Proportions - 2-Tailed 09m
  • Video class: Statistics - 11.1.1 Hypothesis Testing for 2 Sample Means (? known) - 1-Tailed 22m
  • Exercise: What is the main focus of hypothesis testing in chapter 11 when dealing with two samples?
  • Video class: Statistics - 11.1.2 Hypothesis Testing for 2 Sample Means (? known) - 2-Tailed 08m
  • Video class: Statistics - 11.2.1 Hypothesis Testing for 2 Sample Means (? unknown) - Unequal Variances 12m
  • Exercise: In a hypothesis test involving two sample means with unknown and unequal variances, which of the following statements is true?
  • Video class: Statistics - 11.2.2 Hypothesis Testing for 2 Sample Means (? unknown) - Equal Variances 13m
  • Video class: Statistics - 11.3 Hypothesis Testing for 2 Sample Means - Paired 15m
  • Exercise: In hypothesis testing for two sample means with paired data, what is the test statistic formula when calculating the t-score for paired differences?
  • Video class: Statistics - 11.4 Hypothesis Testing for 2 Sample Proportions 23m
  • Video class: Statistics - 12.1.1 Scatter Plots and Correlation 19m
  • Exercise: In analyzing a scatter plot of two quantitative variables, which of the following best describes a positive correlation?
  • Video class: Statistics - 12.1.2 Determining Statistical Significance for the Pearson Correlation Coefficient 16m
  • Video class: Statistics - 12.2.1 The Least Squares Regression Line (LSRL) 10m
  • Exercise: What is the purpose of the least squares regression line in statistics?
  • Video class: Statistics - 12.2.2 Predicting With and Interpreting Values of the LSRL 09m
  • Video class: Statistics - 12.2.3 Creating and Analyzing a Linear Regression Model 05m
  • Exercise: In a study analyzing the relationship between average monthly temperature and monthly precipitation totals, a linear regression model was created with the equation ŷ = -15.424 + 0.225x. The coefficient of determination (R²) was calculated to be 0.7382. Which of the following interpretations of R² is correct?
  • Video class: Statistics - 12.3.1 Prediction Intervals for Linear Regression 16m
  • Video class: Statistics - 12.3.2 Confidence Intervals for ?0 and ?1 05m
  • Exercise: In understanding the process of constructing a 95% confidence interval for the slope in a simple linear regression, which variables are typically involved?
  • Video class: Statistics - 12.4 Multiple Regression 09m

This free course includes:

16 hours and 30 minutes of online video course

Digital certificate of course completion (Free)

Exercises to train your knowledge

100% free, from content to certificate

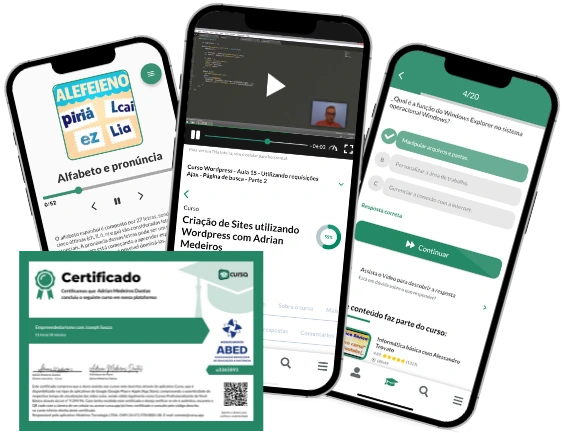
Ready to get started?Download the app and get started today.

Install the app now

to access the course
Icon representing technology and business courses

Over 5,000 free courses

Programming, English, Digital Marketing and much more! Learn whatever you want, for free.

Calendar icon with target representing study planning

Study plan with AI

Our app's Artificial Intelligence can create a study schedule for the course you choose.

Professional icon representing career and business

From zero to professional success

Improve your resume with our free Certificate and then use our Artificial Intelligence to find your dream job.

You can also use the QR Code or the links below.

QR Code - Download Cursa - Online Courses

More free courses at Statistics

Download the App now to have access to + 3300 free courses, exercises, certificates and lots of content without paying anything!

  • 100% free online courses from start to finish

    Thousands of online courses in video, ebooks and audiobooks.

  • More than 48 thousand free exercises

    To test your knowledge during online courses

  • Valid free Digital Certificate with QR Code

    Generated directly from your cell phone's photo gallery and sent to your email

Cursa app on the ebook screen, the video course screen and the course exercises screen, plus the course completion certificate

+ 9 million
students

Free and Valid
Certificate

60 thousand free
exercises

4.8/5 rating in
app stores

Free courses in
video and ebooks