Free Course Image Statistics

Free online courseStatistics

Duration of the online course: 12 hours and 44 minutes

4.87

StarStarStarStarStar

(30)

Build real data confidence with a free statistics course—master averages, variance, distributions, and hypothesis testing for school and beyond.

In this free course, learn about

  • Compute and interpret arithmetic mean; distinguish sample mean vs population mean
  • Compute population and sample variance; relate variance to standard deviation
  • Use alternate/simplified variance formulas to speed up calculations
  • Define random variables; understand PDFs and why P(X=exact value)=0 for continuous
  • Solve binomial probability problems; use expected value of a binomial (np)
  • Model counts with Poisson processes; compute probabilities given rate (lambda)
  • Apply law of large numbers to connect sample averages to true means
  • Understand normal distribution, z-scores, and the empirical (68–95–99.7) rule
  • Use CLT and sampling distributions; see how larger n reduces standard error
  • Bernoulli distribution mean/variance and expectations of sums of independent RVs
  • Build confidence intervals and margins of error; use z vs t for small samples
  • Run hypothesis tests: p-values, one- vs two-tailed, Type I error, null hypothesis
  • Compare two means or two proportions via CI and hypothesis tests
  • Fit least-squares regression, interpret slope, covariance link, and R-squared

Course Description

Strengthen your math skills and learn to think clearly with data in this free online statistics course designed for school-level learning and lasting real-world usefulness. Statistics is more than formulas: it is a practical way to describe what is happening, measure uncertainty, and make decisions when outcomes are not guaranteed. By the end, you will be able to interpret common summaries, evaluate evidence, and communicate conclusions in a way that is both logical and easy to justify.

You will start by building a solid descriptive foundation, learning how measures like the mean, variance, and standard deviation capture different aspects of a data set. Instead of memorizing steps, you will practice recognizing what each measure is telling you, why it changes from one data set to another, and how sample-based calculations connect to the idea of a population. That intuition becomes essential as you move from describing data to modeling randomness.

From there, you will develop an understanding of random variables and probability models, including discrete and continuous cases, and why probability density behaves differently from probabilities you can count. You will work with major distributions such as binomial and Poisson, and connect them to expected value so you can summarize long-run outcomes for repeated experiments and everyday scenarios.

The course then builds toward the big ideas that power inference. You will see how the law of large numbers and the normal distribution help explain patterns that appear across many types of data, and how tools like z-scores support comparison and interpretation. You will also understand why the central limit theorem is so important, especially when working with sample means, standard error, and what changes when sample size grows.

Next, you will learn how to estimate and test claims with confidence intervals, margins of error, and hypothesis testing, including p-values and the difference between one-tailed and two-tailed tests. You will compare z and t approaches, recognize common error types, and practice drawing conclusions responsibly rather than overclaiming. Finally, you will connect statistics to relationships between variables through regression, correlation, coefficient of determination, and methods for analyzing categorical or grouped data such as chi-square tests and ANOVA. Throughout, practice exercises help turn concepts into dependable skills you can use in school, exams, projects, and data-informed conversations.

Course content

  • Video class: Statistics: The average | Descriptive statistics | Probability and Statistics | Khan Academy 12m
  • Exercise: What is the arithmetic mean of the set of numbers 1, 1, 2, 3, 4?
  • Video class: Statistics: Sample vs. Population Mean 06m
  • Exercise: What is the difference between population mean and sample mean in statistics?
  • Video class: Statistics: Variance of a population | Probability and Statistics | Khan Academy 12m
  • Exercise: What is the variance of the data set {0, 0, 5, 5}?
  • Video class: Statistics: Sample variance | Descriptive statistics | Probability and Statistics | Khan Academy 11m
  • Exercise: _What is the difference between the variance of a population and the variance of a sample?
  • Video class: Statistics: Standard deviation | Descriptive statistics | Probability and Statistics | Khan Academy 13m
  • Exercise: What is the variance of this population: {1, 2, 3, 8, 7}?
  • Video class: Statistics: Alternate variance formulas | Probability and Statistics | Khan Academy 12m
  • Exercise: What is the simplified formula for the variance of a population?
  • Video class: Introduction to Random Variables 12m
  • Exercise: What is a characteristic of a random variable?
  • Video class: Probability density functions | Probability and Statistics | Khan Academy 10m
  • Exercise: What is the probability of a continuous random variable taking an exact value?
  • Video class: Binomial Distribution 1 12m
  • Exercise: What is the probability of getting exactly 2 heads when flipping a coin 5 times?
  • Video class: Binomial Distribution 2 11m
  • Exercise: _What is the probability of getting exactly 4 heads after flipping a fair coin 5 times?
  • Video class: Binomial Distribution 3 13m
  • Exercise: What is the probability of making exactly 2 shots in a 6-shot basketball attempt with a 30% success rate per shot?
  • Video class: Binomial Distribution 4 10m
  • Exercise: What is the probability of making 0 shots when given 6 attempts?
  • Video class: Expected Value: E(X) 14m
  • Exercise: _What is the population mean for the given population of numbers: three 3's, a 4, and a 5?
  • Video class: Expected value of binomial distribution | Probability and Statistics | Khan Academy 16m
  • Exercise: What is the expected value of a binomial distribution?
  • Video class: Poisson process 1 | Probability and Statistics | Khan Academy 11m
  • Exercise: What distribution can be used to model the probability of cars passing a point on the street?
  • Video class: Poisson process 2 | Probability and Statistics | Khan Academy 12m
  • Exercise: What is the probability that 2 cars pass in a given hour when the expected number of cars per hour is 9?
  • Video class: Law of large numbers | Probability and Statistics | Khan Academy 09m
  • Exercise: What does the law of large numbers suggest?
  • Video class: Normal distribution excel exercise | Probability and Statistics | Khan Academy 26m
  • Exercise: What is the central concept discussed in the video?
  • Video class: Introduction to the normal distribution | Probability and Statistics | Khan Academy 26m
  • Exercise: _What is the normal distribution?
  • Video class: ck12.org normal distribution problems: Qualitative sense of normal distributions | Khan Academy 10m
  • Exercise: Which data set is most likely to be normally distributed?
  • Video class: ck12.org normal distribution problems: z-score | Probability and Statistics | Khan Academy 07m
  • Video class: ck12.org normal distribution problems: Empirical rule | Probability and Statistics | Khan Academy 10m
  • Exercise: _What is the probability of finding a one-year-old girl in the US whose weight is within one standard deviation of the mean weight of one-year-old girls in the US, assuming the mean weight is 9.5 kilograms and the standard deviation is 1.1 grams?
  • Video class: k12.org exercise: Standard normal distribution and the empirical | Khan Academy 08m
  • Video class: ck12.org: More empirical rule and z-score practice | Probability and Statistics | Khan Academy 05m
  • Video class: Central limit theorem | Inferential statistics | Probability and Statistics | Khan Academy 09m
  • Exercise: _What is the central limit theorem?
  • Video class: Sampling distribution of the sample mean | Probability and Statistics | Khan Academy 10m
  • Video class: Sampling distribution of the sample mean 2 | Probability and Statistics | Khan Academy 13m
  • Video class: Standard error of the mean | Inferential statistics | Probability and Statistics | Khan Academy 15m
  • Exercise: _What is the effect of increasing the sample size on the sampling distribution of the sample mean?
  • Video class: Sampling distribution example problem | Probability and Statistics | Khan Academy 14m
  • Video class: Mean and variance of Bernoulli distribution example | Probability and Statistics | Khan Academy 08m
  • Video class: Bernoulli distribution mean and variance formulas | Probability and Statistics | Khan Academy 06m
  • Exercise: _What is the formula for the mean of a Bernoulli Distribution with probability of success p and probability of failure 1-p?
  • Video class: Margin of error 1 | Inferential statistics | Probability and Statistics | Khan Academy 15m
  • Video class: Margin of error 2 | Inferential statistics | Probability and Statistics | Khan Academy 10m
  • Video class: Confidence interval example | Inferential statistics | Probability and Statistics | Khan Academy 18m
  • Video class: Small sample size confidence intervals | Probability and Statistics | Khan Academy 11m
  • Video class: Hypothesis testing and p-values | Inferential statistics | Probability and Statistics | Khan Academy 11m
  • Video class: One-tailed and two-tailed tests | Inferential statistics | Probability and Statistics | Khan Academy 06m
  • Exercise: _What is the difference between a one-tailed test and a two-tailed test in hypothesis testing?
  • Video class: Z-statistics vs. T-statistics | Inferential statistics | Probability and Statistics | Khan Academy 06m
  • Video class: Type 1 errors | Inferential statistics | Probability and Statistics | Khan Academy 03m
  • Video class: Small sample hypothesis test | Inferential statistics | Probability and Statistics | Khan Academy 09m
  • Exercise: _What is the null hypothesis in this scenario?
  • Video class: T-statistic confidence interval | Inferential statistics | Probability and Statistics | Khan Academy 11m
  • Video class: Large sample proportion hypothesis testing | Probability and Statistics | Khan Academy 14m
  • Video class: Variance of differences of random variables | Probability and Statistics | Khan Academy 10m
  • Exercise: _What is the expected value of a random variable z defined as x+y, where x and y are independent random variables?
  • Video class: Difference of sample means distribution | Probability and Statistics | Khan Academy 12m
  • Video class: Confidence interval of difference of means | Probability and Statistics | Khan Academy 15m
  • Video class: Clarification of confidence interval of difference of means | Khan Academy 02m
  • Video class: Hypothesis test for difference of means | Probability and Statistics | Khan Academy 10m
  • Video class: Comparing population proportions 1 | Probability and Statistics | Khan Academy 10m
  • Video class: Comparing population proportions 2 | Probability and Statistics | Khan Academy 10m
  • Video class: Hypothesis test comparing population proportions | Probability and Statistics | Khan Academy 16m
  • Video class: Squared error of regression line | Regression | Probability and Statistics | Khan Academy 06m
  • Video class: Proof (part 1) minimizing squared error to regression line | Khan Academy 10m
  • Video class: Proof (part 3) minimizing squared error to regression line | Khan Academy 10m
  • Video class: Proof (part 4) minimizing squared error to regression line | Khan Academy 04m
  • Video class: Regression line example | Regression | Probability and Statistics | Khan Academy 09m
  • Exercise: _What is the formula for the slope of the best fitting regression line when measuring the error by the squared distance to that line?
  • Video class: Proof (part 2) minimizing squared error to regression line | Khan Academy 09m
  • Video class: R-squared or coefficient of determination | Regression | Probability and Statistics | Khan Academy 12m
  • Video class: Second regression example | Regression | Probability and Statistics | Khan Academy 09m
  • Exercise: _What is the equation for the regression line that best fits the data points and what is the formula for calculating the slope of the line?
  • Video class: Calculating R-squared | Regression | Probability and Statistics | Khan Academy 09m
  • Video class: Covariance and the regression line | Regression | Probability and Statistics | Khan Academy 15m
  • Video class: Chi-square distribution introduction | Probability and Statistics | Khan Academy 10m
  • Exercise: _What is the definition of Q1 in the chi-square distribution?
  • Video class: Pearson's chi square test (goodness of fit) | Probability and Statistics | Khan Academy 11m
  • Video class: Contingency table chi-square test | Probability and Statistics | Khan Academy 17m
  • Video class: ANOVA 1: Calculating SST (total sum of squares) | Probability and Statistics | Khan Academy 07m
  • Exercise: _What is the total sum of squares (SST) in the given data set?
  • Video class: ANOVA 2: Calculating SSW and SSB (total sum of squares within and between) | Khan Academy 13m
  • Video class: ANOVA 3: Hypothesis test with F-statistic | Probability and Statistics | Khan Academy 10m
  • Video class: Correlation and causality | Statistical studies | Probability and Statistics | Khan Academy 10m
  • Exercise: _What is the implication of the article titled "Eating breakfast may beat teen obesity"?

This free course includes:

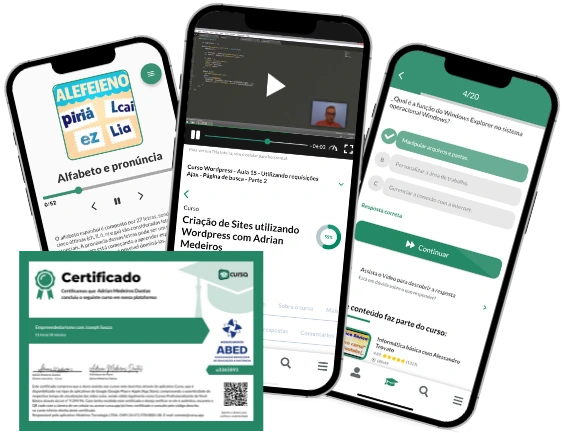
12 hours and 44 minutes of online video course

Digital certificate of course completion (Free)

Exercises to train your knowledge

100% free, from content to certificate

Ready to get started?Download the app and get started today.

Install the app now

to access the course
Icon representing technology and business courses

Over 5,000 free courses

Programming, English, Digital Marketing and much more! Learn whatever you want, for free.

Calendar icon with target representing study planning

Study plan with AI

Our app's Artificial Intelligence can create a study schedule for the course you choose.

Professional icon representing career and business

From zero to professional success

Improve your resume with our free Certificate and then use our Artificial Intelligence to find your dream job.

You can also use the QR Code or the links below.

QR Code - Download Cursa - Online Courses

Course comments: Statistics

RC

Routh Chitaranjan

StarStarStarStarStar

Easy and simple explanation.

More free courses at Statistics

Free Ebook + Audiobooks! Learn by listening or reading!

Download the App now to have access to + 5000 free courses, exercises, certificates and lots of content without paying anything!

  • 100% free online courses from start to finish

    Thousands of online courses in video, ebooks and audiobooks.

  • More than 60 thousand free exercises

    To test your knowledge during online courses

  • Valid free Digital Certificate with QR Code

    Generated directly from your cell phone's photo gallery and sent to your email

Cursa app on the ebook screen, the video course screen and the course exercises screen, plus the course completion certificate