Free Course Image Statistics Course for Beginners

Free online courseStatistics Course for Beginners

Duration of the online course: 9 hours and 48 minutes

New

Build data confidence fast with this free statistics course: read charts, summarize data, and run inference with confidence intervals and hypothesis tests.

In this free course, learn about

  • Core stats terms: descriptive vs inferential statistics; samples vs populations
  • Study designs: cross-sectional, case-control, cohort; observational vs experimental
  • Variable types (categorical/numeric; discrete/continuous) and appropriate summaries
  • Data visualization: bar/pie, tables, histograms vs density plots, boxplots, scatter/side-by-side
  • Describing distributions: center/spread, skewness; mean/median/mode; quantiles/percentiles
  • Standard deviation/variance and why sample SD uses (n-1) (Bessel’s correction)
  • Normal distribution, z-scores, and the 68–95–99.7 empirical rule
  • Sampling distributions, statistical inference, and the Central Limit Theorem
  • Standard error of the mean and how it underpins confidence intervals & margin of error
  • Hypothesis testing: H0/HA, p-values, one- vs two-sided tests; CI–test relationship
  • t-distribution and t-tests: paired, one-sample, two-sample; equal vs unequal variances
  • Errors and power: Type I/II errors, factors affecting power, basics of power calculations
  • ANOVA: sums of squares, F statistic, p-values; multiple comparisons & Bonferroni correction
  • Categorical inference & effect sizes: chi-square test; odds ratio, relative risk, risk difference

Course Description

Statistics can feel like a foreign language until you see how it answers everyday questions: What is typical, what is unusual, and how sure are we about a conclusion? This free online course is designed for beginners who want a clear, practical path from describing data to making sound decisions with evidence. You will learn to interpret results you see in school, business reports, health studies, and the news, and to spot common misreadings before they turn into bad choices.

You start by building a foundation in statistical thinking and terminology, then move into how studies are designed and why design choices affect what you can claim. From there, you learn how to work with different types of variables and choose the right visual displays, so charts become tools for insight rather than decoration. As you progress, you practice describing distributions using ideas of center and spread, and you gain intuition for measures like the mean, median, percentiles, and standard deviation, including what they reveal and what they can hide.

Once the descriptive side feels comfortable, the course guides you into probability models and the normal distribution, helping you understand z-scores and why sampling variability matters. You will then connect those ideas to the key logic of inference: how samples relate to populations, why the central limit theorem is so important, and how standard error supports estimation. Step by step, you learn to interpret confidence intervals, margin of error, and p-values in a way that supports real reasoning rather than memorization.

Hypothesis testing becomes a decision framework you can explain: null vs alternative ideas, one-sided vs two-sided questions, and the meaning of Type I/II errors and power. You also explore resampling approaches such as bootstrapping and permutation tests, which offer flexible ways to assess uncertainty when classical assumptions are shaky. Finally, you strengthen your ability to compare groups and relationships with common methods such as t-tests, nonparametric alternatives, ANOVA, chi-square analysis, risk measures, and the basics of linear regression, including how to interpret slopes and R-squared responsibly.

Throughout, short checks and questions help you verify understanding, build intuition, and develop the habit of justifying conclusions with clear statistical evidence. By the end, you will be able to read and communicate statistical results with confidence, whether you are preparing for exams, supporting a project, or leveling up skills for data-driven roles.

Course content

  • Video class: Statistics Course Overview | Best Statistics Course | MarinStatsLectures 14m
  • Exercise: In an introductory statistics course, what is an example of a numeric summary statistic used to summarize a sample?
  • Video class: Statistics Video Tutorials at a Glance | Best Statistics Tutorials | MarinStatsLectures 02m
  • Exercise: What is the main goal of the video series?
  • Video class: Statistics Terminology and Definitions| Statistics Tutorial | MarinStatsLectures 09m
  • Exercise: In the context of statistical analysis, what does inferential statistics aim to accomplish?
  • Video class: Study Designs (Cross-sectional, Case-control, Cohort) | Statistics Tutorial | MarinStatsLectures 11m
  • Exercise: What is the main difference between observational and experimental study designs in health research?
  • Video class: Variables and Types of Variables | Statistics Tutorial | MarinStatsLectures 13m
  • Exercise: What is the correct term for variables that can take on integer values, potentially ranging up to infinity, but cannot be fractions?
  • Video class: Bar Chart, Pie Chart, Frequency Tables | Statistics Tutorial | MarinStatsLectures 07m
  • Exercise: What is the best method to visually represent a categorical variable distribution?
  • Video class: Histograms and Density Plots for Numeric Variables | Statistics Tutorial | MarinStatsLectures 07m
  • Exercise: What is the main advantage of using kernel density plots over histograms?
  • Video class: Boxplots in Statistics | Statistics Tutorial | MarinStatsLectures 08m
  • Exercise: What is the purpose of a box plot in data analysis?
  • Video class: Plots for Two Variables | Statistics Tutorial | MarinStatsLectures 09m
  • Exercise: Which of the following is an appropriate plot to analyze the relationship between a categorical and a numeric variable?
  • Video class: Describing Distributions: Center, Spread 07m
  • Exercise: How are income distributions typically characterized?
  • Video class: Mean, Median and Mode in Statistics | Statistics Tutorial | MarinStatsLectures 10m
  • Exercise: Which measure of central tendency is known for being robust, meaning it is not sensitive to outliers or extreme values in a dataset?
  • Video class: Percentiles, Quantiles and Quartiles in Statistics | Statistics Tutorial | MarinStatsLectures 07m
  • Exercise: What is a median in statistics?
  • Video class: Standard Deviation 11m
  • Exercise: What is the reason for using the (n-1) term in the denominator when calculating the sample standard deviation rather than just 'n'?
  • Video class: Sample and Population in Statistics | Statistics Tutorial | MarinStatsLectures 09m
  • Exercise: What is the sample proportion of individuals with the disease in a sample of 100?
  • Video class: Normal Distribution, Z-Scores 09m
  • Exercise: According to the 68, 95, 99.7 rule for a normal distribution, if the mean height of a population is 175 cm with a standard deviation of 10 cm, what percentage of the population will have heights between 155 cm and 195 cm?
  • Video class: Measures of Spread 11m
  • Video class: Samples from a Normal Distribution | Statistics Tutorial #4 | MarinStatsLectures 05m
  • Exercise: What is the key concept of statistical inference?
  • Video class: Central Limit Theorem 07m
  • Exercise: What is the central limit theorem?
  • Video class: Standard Error of the Mean: Concept and Formula | Statistics Tutorial #6 | MarinStatsLectures 05m
  • Exercise: What is the standard error of the sample mean formula?
  • Video class: Confidence Interval Concept Explained | Statistics Tutorial #7 | MarinStatsLectures 08m
  • Exercise: What is the standard error of the mean used to estimate when constructing a confidence interval for a single mean?
  • Video class: Confidence Interval for Mean with Example | Statistics Tutorial #10 | MarinStatsLectures 13m
  • Video class: Margin of Error 09m
  • Exercise: Which of the following actions can effectively decrease the margin of error when constructing a confidence interval?
  • Video class: Hypothesis Testing Explained | Statistics Tutorial | MarinStatsLectures 09m
  • Exercise: What is the probability of obtaining a sample mean of 135 or more?
  • Video class: t-distribution in Statistics and Probability | Statistics Tutorial #9 | MarinStatsLectures 04m
  • Exercise: Why is the t-distribution used instead of the standard normal (Z) distribution when dealing with sample data?
  • Video class: Hypothesis Testing: Calculations and Interpretations| Statistics Tutorial #13 | MarinStatsLectures 16m
  • Exercise: In hypothesis testing, what is the purpose of a null hypothesis (H0)?
  • Video class: Hypothesis Test vs. Confidence Interval | Statistics Tutorial #15 | MarinStatsLectures 05m
  • Exercise: What can we infer about the relationship between the p-value of a hypothesis test and the corresponding confidence interval?
  • Video class: Errors and Power in Hypothesis Testing | Statistics Tutorial #16 | MarinStatsLectures 12m
  • Video class: Power Calculations in Hypothesis Testing | Statistics Tutorial #17 | MarinStatsLectures 19m
  • Exercise: Which of the following factors does NOT affect the power of a hypothesis test?
  • Video class: Statistical Inference Definition with Example | Statistics Tutorial #18 | MarinStatsLectures 05m
  • Video class: Bootstrapping and Resampling in Statistics with Example| Statistics Tutorial #12 |MarinStatsLectures 17m
  • Video class: Bootstrap Hypothesis Testing in Statistics with Example |Statistics Tutorial #35 |MarinStatsLectures 16m
  • Exercise: In the context of a hypothesis test involving two diets for chicks, which of the following is a characteristic of the null hypothesis?
  • Video class: Bootstrap Confidence Interval with Examples | Statistics Tutorial #36 | MarinStatsLectures 09m
  • Video class: Permutation Hypothesis Testing with Example | Statistics Tutorial # 37 | MarinStatsLectures 17m
  • Exercise: In the context of hypothesis testing, which of the following best describes a permutation test?
  • Video class: Bivariate Analysis Meaning | Statistics Tutorial #19 | MarinStatsLectures 09m
  • Exercise: Which one of the following is NOT a typical property of parametric approaches?
  • Video class: Bivariate Analysis for Categorical 12m
  • Video class: Paired t Test | Statistics Tutorial #21| MarinStatsLectures 14m
  • Exercise: What is the primary reason for pairing or matching individuals in a paired t-test?
  • Video class: Wilcoxon Signed Rank Test | Statistics Tutorial #22 | MarinStatsLectures 19m
  • Video class: Two Sample t-test for Independent Groups | Statistics Tutorial #23| MarinStatsLectures 15m
  • Exercise: What does the independent two-sample t-test compare?
  • Video class: Two Sample t-Test:Equal vs Unequal Variance Assumption| Statistics Tutorial #24| MarinStatsLectures 14m
  • Video class: One Way ANOVA (Analysis of Variance): Introduction | Statistics Tutorial #25 | MarinStatsLectures 09m
  • Video class: ANOVA (Analysis of Variance) and Sum of Squares | Statistics Tutorial #26 | MarinStatsLectures 17m
  • Exercise: In the context of one-way ANOVA, what does the sum of squares within groups (SS within) represent?
  • Video class: ANOVA Part III: F Statistic and P Value | Statistics Tutorial #27 | MarinStatsLectures 09m
  • Video class: ANOVA Part IV: Bonferroni Correction | Statistics Tutorial #28 | MarinStatsLectures 16m
  • Exercise: What does the Bonferroni correction do in the context of multiple hypothesis testing?
  • Video class: Chi Square Test of Independence | Statistics Tutorial #29| MarinStatsLectures 24m
  • Video class: Odds Ratio, Relative Risk, Risk Difference | Statistics Tutorial #30| MarinStatsLectures 11m
  • Exercise: What is the definition of the odds ratio in the context of a 2x2 table when comparing two groups?
  • Video class: Case-Control Study and Odds Ratio | Statistics Tutorial #31| MarinStatsLectures 09m
  • Video class: Simple Linear Regression Concept | Statistics Tutorial #32 | MarinStatsLectures 18m
  • Exercise: Which of the following statements best describes the interpretation of the slope in a simple linear regression model?
  • Video class: Linearity and Nonlinearity in Linear Regression | Statistics Tutorial #33 | MarinStatsLectures 18m
  • Video class: R Squared or Coefficient of Determination | Statistics Tutorial | MarinStatsLectures 15m
  • Exercise: What does R-squared (coefficient of determination) indicate in a linear regression model?
  • Video class: Bootstrapping and Resampling in Statistics with Example| Statistics Tutorial #12 |MarinStatsLectures 17m
  • Video class: Hypothesis Testing: Calculations and Interpretations| Statistics Tutorial #13 | MarinStatsLectures 16m
  • Exercise: In hypothesis testing, what is the purpose of a null hypothesis (H0)?
  • Video class: Hypothesis Testing: One Sided vs Two Sided Alternative | Statistics Tutorial #14 |MarinStatsLectures 08m
  • Video class: Hypothesis Test vs. Confidence Interval | Statistics Tutorial #15 | MarinStatsLectures 05m
  • Exercise: What can we infer about the relationship between the p-value of a hypothesis test and the corresponding confidence interval?
  • Video class: Errors and Power in Hypothesis Testing | Statistics Tutorial #16 | MarinStatsLectures 12m
  • Video class: Power Calculations in Hypothesis Testing | Statistics Tutorial #17 | MarinStatsLectures 19m
  • Exercise: Which of the following factors does NOT affect the power of a hypothesis test?
  • Video class: The Monty Hall Problem in Statistics | Statistics Tutorial | MarinStatsLectures 06m
  • Exercise: In the Monty Hall problem, you start with three doors, behind one is a car (the winning prize) and behind the other two are goats (gag prizes). After choosing a door, the host (who knows where the car is) opens one of the other two doors, revealing a goat. You are then given the chance to stick with your initial choice or switch to the other unopened door. What is the optimal strategy to increase your chances of winning the car?

This free course includes:

9 hours and 48 minutes of online video course

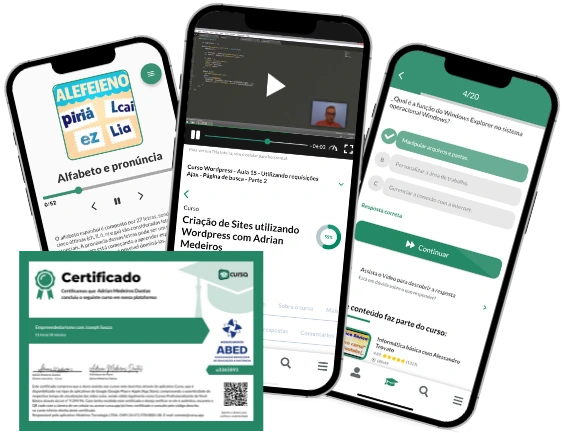
Digital certificate of course completion (Free)

Exercises to train your knowledge

100% free, from content to certificate

Ready to get started?Download the app and get started today.

Install the app now

to access the course
Icon representing technology and business courses

Over 5,000 free courses

Programming, English, Digital Marketing and much more! Learn whatever you want, for free.

Calendar icon with target representing study planning

Study plan with AI

Our app's Artificial Intelligence can create a study schedule for the course you choose.

Professional icon representing career and business

From zero to professional success

Improve your resume with our free Certificate and then use our Artificial Intelligence to find your dream job.

You can also use the QR Code or the links below.

QR Code - Download Cursa - Online Courses

More free courses at Statistics

Free Ebook + Audiobooks! Learn by listening or reading!

Download the App now to have access to + 5000 free courses, exercises, certificates and lots of content without paying anything!

  • 100% free online courses from start to finish

    Thousands of online courses in video, ebooks and audiobooks.

  • More than 60 thousand free exercises

    To test your knowledge during online courses

  • Valid free Digital Certificate with QR Code

    Generated directly from your cell phone's photo gallery and sent to your email

Cursa app on the ebook screen, the video course screen and the course exercises screen, plus the course completion certificate