Backend development isn’t just about shipping endpoints—it’s about being able to explain what your system is doing when something goes wrong. That’s where observability comes in: the practice of understanding a backend from the signals it produces. With strong observability, you can answer questions like “Why is this request slow?”, “Which dependency is failing?”, and “What changed right before errors spiked?” without guessing.
This guide introduces the three pillars of observability—logs, metrics, and distributed tracing—plus pragmatic patterns you can apply across stacks like Node.js, Django, Flask, and more. If you’re exploring backend topics broadly, start from the https://cursa.app/free-online-information-technology-courses and then dive into https://cursa.app/free-courses-information-technology-online to practice these concepts hands-on.
What “observability” means (and how it differs from monitoring)
Monitoring tells you something is wrong (CPU is high, error rate increased). Observability helps you figure out why it’s wrong by providing enough context to trace the cause. In practice, monitoring is built from observability signals: you collect telemetry (logs/metrics/traces) and then build dashboards and alerts on top of them.
Think of observability as the system’s “black box recorder.” When the incident happens, you want a reliable story: request path, user impact, dependency calls, timings, errors, and correlation identifiers.
Pillar 1: Logging that helps you debug (not just read)
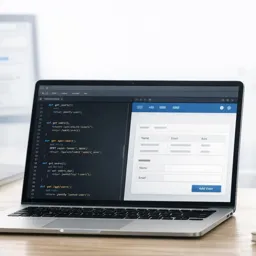
Logs are event records. The most common observability failure is having lots of logs that are impossible to search or correlate. The fix is “structured logging”: emitting logs as JSON (or key-value fields) so you can filter by request_id, user_id, route, status_code, and latency_ms.

Structured logging essentials
To make logs useful across services and frameworks, standardize fields such as:
- timestamp (UTC)
- level (debug/info/warn/error)
- service and environment
- request_id / trace_id
- route, method, status_code
- duration_ms
- error (type/message/stack)
Also: avoid logging secrets (tokens, passwords), and be careful with personal data. If you must log identifiers, prefer hashed or surrogate IDs.
Correlate logs with a request ID
The single most powerful improvement is consistent correlation IDs. Generate a request_id at the edge (load balancer or API gateway) or at the app entry, then pass it through internal calls and include it in every log line. That way, one request becomes one searchable thread—especially useful when debugging “it only happens sometimes” issues.
Pillar 2: Metrics that quantify health and performance
Metrics are numbers tracked over time. They help you spot trends, regressions, and capacity limits. For backend APIs, the highest-value metrics usually fall into four categories:
- Traffic: requests per second, concurrency
- Errors: error rate, exception counts
- Latency: p50/p95/p99 response times
- Saturation: CPU, memory, DB connections, queue depth
This “RED” (Rate-Errors-Duration) framing for request-driven services is easy to implement and maps well to dashboards and alerts.
Histograms beat averages for latency
Averages hide pain. A system can look “fine” on average while a subset of users suffers timeouts. Prefer histograms or summary metrics that let you track percentiles (p95/p99). This is essential for real-world API performance where long tails happen due to cold caches, slow queries, or dependency hiccups.
Define SLIs and SLOs (simple version)
An SLI is what you measure (e.g., “% of requests under 300ms”). An SLO is your target (e.g., “99% under 300ms”). Even a basic SLO makes alerts more meaningful: you alert on user impact, not on random spikes.
External resource for deeper reliability concepts: https://sre.google/sre-book/service-level-objectives/.
Pillar 3: Distributed tracing to follow a request across services
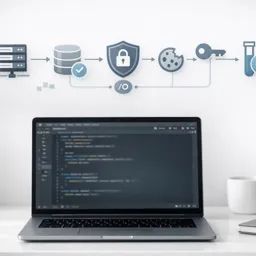
Tracing connects the dots. A distributed trace is a tree of “spans” representing work done across components—API gateway, backend service, database, cache, and third-party APIs—with timing for each step. When a request is slow, traces show exactly where time is spent.
Why traces matter in microservices (and even monoliths)
In microservices, a single user action often triggers many internal calls. Without tracing, you’re stuck correlating timestamps across multiple log files. With tracing, you open one view and see the whole waterfall.
Even in a monolith, tracing helps break down time spent in middleware, DB queries, template rendering, and external calls, which speeds up performance tuning.
Adopt OpenTelemetry for vendor-neutral instrumentation
https://opentelemetry.io/ is a widely adopted standard for generating and exporting logs/metrics/traces. Learning OTel concepts makes you more portable across tools (Grafana, Datadog, New Relic, Elastic, etc.) and across languages/frameworks.
If you’re building services with JavaScript/TypeScript, exploring Node tooling can complement this well; browse https://cursa.app/free-online-courses/node-js and https://cursa.app/free-online-courses/typescript to pair runtime knowledge with observability patterns.
Putting it together: the “three-signal” debugging workflow
When an incident hits, a reliable flow looks like this:
- Start with metrics to confirm scope and user impact (error rate, p95 latency, affected routes).
- Jump to traces for a representative slow/failed request to identify the bottleneck span.
- Use logs (filtered by
trace_id/request_id) to read the exact error details and context.
This workflow prevents “log diving” as the first step and gets you to root cause faster.
Common pitfalls (and how to avoid them)
- Too many logs, not enough structure: switch to structured logs and standard fields.
- No correlation IDs: generate and propagate
request_id/trace_ideverywhere. - Alert fatigue: alert on SLO symptoms (user impact), not on every noisy metric.
- Ignoring dependencies: instrument DB calls, cache, queues, and outbound HTTP clients.
- Sampling without strategy: keep tail-based sampling options for capturing slow/error traces.
These improvements are stack-agnostic whether you’re using Python frameworks like https://cursa.app/free-online-courses/django or https://cursa.app/free-online-courses/flask, or building APIs with Node via https://cursa.app/free-online-courses/express-js.

A practical learning plan to build observability skills
To turn these concepts into skill, practice in small increments:
- Week 1: Add structured request logs + request ID middleware.
- Week 2: Add RED metrics and a basic dashboard.
- Week 3: Add tracing for inbound requests and outbound HTTP calls.
- Week 4: Define one SLO and create one actionable alert.
As you learn, keep a single demo API and evolve it—observability becomes much clearer when you can generate load and see telemetry change.
Continue exploring backend topics and implementations via https://cursa.app/free-courses-information-technology-online, and expand into related subjects such as https://cursa.app/free-online-courses/graphql (different query patterns, different metrics) and https://cursa.app/free-online-courses/htmx (server-driven UI, different performance hotspots).
Conclusion: Make your backend explain itself
Great backend engineers don’t just write code that works—they build systems that can be understood under pressure. By investing in structured logging, meaningful metrics, and distributed tracing, you’ll debug faster, ship safer changes, and improve performance with evidence instead of guesswork.