Duration of the online course: 46 minutes
New
Turn spreadsheets into clear business answers with a practical, finance-focused approach to Microsoft Excel. This course is designed for anyone who wants to move beyond basic formulas and use Excel the way analysts and managers do: to summarize messy data, spot trends, test assumptions, and support real decisions with numbers. You will gain confidence working with common business scenarios and learn techniques that translate directly to productivity on the job.
You will start by learning how to organize and explore large datasets efficiently using pivot tables. Instead of manually counting transactions or sorting rows repeatedly, you will be able to create dynamic summaries that reveal patterns across customer types, products, or time periods. This skill is especially valuable when you need quick insights, flexible reporting, and repeatable analysis that can be updated as new data arrives.
From there, you will use Excel to look forward, not just backward. By applying forecasting and regression analysis, you will learn how historical information can support better estimates and planning. You will work with tools that help model relationships between variables, evaluate how well a trend fits the data, and generate forecasts that you can explain to stakeholders rather than simply accept.
The course also strengthens your financial decision-making skills by showing how to evaluate projects and investments in Excel. You will compute net present value and understand why the timing of the initial cash outflow is treated differently than later cash flows. With this foundation, you will see how small assumption changes can significantly alter conclusions and how to build models that are easier to audit and defend.
To handle real-world constraints, you will explore optimization with Solver, learning how to choose among competing projects when capital is limited. You will also calculate internal rates of return, including scenarios with irregular cash flows, and use goal seek to reverse engineer a company’s share price assumptions. Finally, you will connect these skills to dividend-based valuation thinking, building intuition for how markets price stable, dividend-paying businesses.
By the end, you will be able to build cleaner analyses, communicate results with confidence, and use Excel as a toolkit for business applications across reporting, forecasting, and valuation.
46 minutes of online video course
Digital certificate of course completion (Free)
Exercises to train your knowledge
100% free, from content to certificate
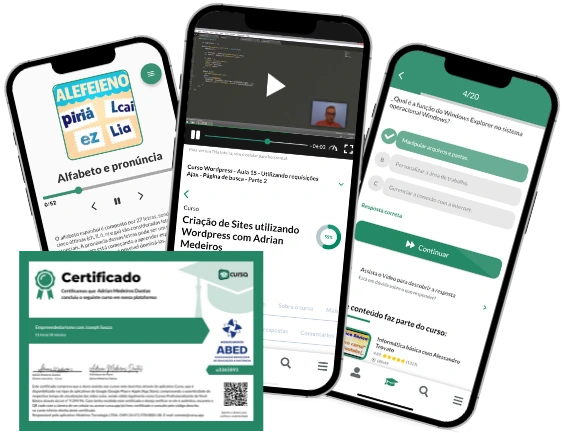
Ready to get started?Download the app and get started today.
Install the app now
to access the courseOver 5,000 free courses
Programming, English, Digital Marketing and much more! Learn whatever you want, for free.
Study plan with AI
Our app's Artificial Intelligence can create a study schedule for the course you choose.
From zero to professional success
Improve your resume with our free Certificate and then use our Artificial Intelligence to find your dream job.
You can also use the QR Code or the links below.


Free CourseExcel for Beginners: 2-Hour Crash Course in Formulas, Charts and Pivot Tables
5

(8)

2h09m

30 exercises

Free CourseExcel Intermediate to Advanced: Formulas, PivotTables, Power Query, Dashboards and VBA
5
(2)
18h53m
28 exercises

Free CourseMS Excel Beginner to Advanced: Formulas, Charts, Pivot Tables and Shortcuts
5
(3)
10h08m
26 exercises

Free CourseMicrosoft 365 Fundamentals MS-900 Certification Prep Course
5
(2)
3h16m
14 exercises

Free CourseGoogle data studio
5
(1)
3h42m
11 exercises

Free CourseExcel Basics: Formulas, Functions, PivotTables and Power Query for Work
5
(1)
12h14m
22 exercises

Free CourseWord for beginners
4.89
(9)
43m
8 exercises

Free CourseWord
4.87
(100)
1h46m
25 exercises

Free CoursePowerPoint
4.81
(80)
2h15m
22 exercises

Free CourseExcel basic to advanced
4.8
(234)
12h34m
19 exercises
Thousands of online courses in video, ebooks and audiobooks.
To test your knowledge during online courses
Generated directly from your cell phone's photo gallery and sent to your email
Download our app via QR Code or the links below::.
Carry knowledge in your pocket.
Download the Cursa app.
There are hundreds of free courses available, with a free certificate of completion that is saved in your mobile image gallery.
Download the app to access the Course Completion Certificate for Free.

+ 10 million
students
Free and Valid
Certificate
60 thousand free
exercises
4.8/5 rating in
app stores
Free courses in
video and ebooks