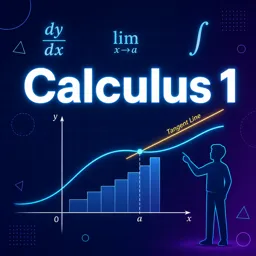
Calculus is often introduced as a set of techniques—differentiate this, integrate that—but its real power is conceptual: it trains you to interpret change. Whether you’re tracking how a quantity evolves, comparing competing growth patterns, or deciding what “smooth” behavior means in a model, calculus provides a language for rates, accumulation, and approximation.
This article focuses on building intuition around continuity, rates, and accumulation without rehashing a standard “limits–derivatives–integrals toolkit.” Instead, you’ll see how calculus helps you think clearly about processes that change continuously, and how that mindset carries across physics, economics, and applied math.
1) Continuity: the hidden assumption behind many models
Many real systems are treated as continuous even when the underlying world is granular. Time, space, temperature, and price are modeled as if they vary smoothly, allowing you to use calculus to reason about “in-between” behavior. This assumption is not just mathematical convenience—it’s a modeling choice. Recognizing when continuity is reasonable (and when it isn’t) is a core skill for applied calculus.
For example, a car’s position over time is commonly modeled as a smooth function. Even though measurements are discrete (recorded at time intervals), the continuity assumption lets you define instantaneous velocity and acceleration—concepts that would be awkward to express using only point-by-point differences.
2) Rates are not just slopes—they’re local stories
In a graph, the derivative is a slope. In context, it’s a local story about sensitivity: how strongly an output responds to a small change in input right now. This “local” viewpoint is why derivatives show up in so many places:
- Physics: velocity is the local rate of change of position; acceleration is the local rate of change of velocity.
- Economics: marginal cost and marginal revenue measure local changes per additional unit.
- Biology and social science: growth rates describe how quickly a population changes near the present state.
The key intuition is that a derivative answers: “If I nudge the input a tiny bit, how big is the immediate effect?” Once you think this way, you can interpret results without getting lost in algebra.

3) Accumulation: integrals as organized adding
If derivatives tell you about instantaneous change, integrals tell you about total accumulation over an interval. Conceptually, an integral is “adding up infinitely many tiny contributions.” That’s why integrals naturally model totals:
- Total distance from velocity over time
- Total work from force over displacement
- Total cost from marginal cost across production
- Total probability mass under a density curve
The crucial mindset: you’re not just computing an area—you’re translating a rate into a total. If you can identify what each “tiny piece” represents (a slice of time, a small quantity, a bit of distance), the integral becomes intuitive.
4) Approximation: why calculus is a practical engine
One of the most useful habits calculus teaches is approximating complex behavior using simple local models. Near a point, many functions can be approximated by straight lines. This is the idea behind linearization—using the tangent line as a “good enough” approximation for small changes.
Why this matters: real-world decisions often involve small variations—slight changes in cost, small measurement errors, or minor shifts in conditions. Calculus lets you estimate impact quickly without solving the entire system again.
5) Units and meaning: a simple check that prevents big mistakes
Calculus becomes much clearer when you track units:
- Derivatives → output units per input unit
- Integrals → output units × input units
Examples:
- Position (meters) → derivative → velocity (meters/second)
- Marginal cost (dollars/unit) → integral → total cost (dollars)
Unit-checking forces interpretation. If your units don’t make sense, your setup probably doesn’t either.
6) When discreteness matters (and how to bridge it)
Not everything is best modeled continuously. Some systems are inherently discrete: network flows, algorithms, or counting problems. In these cases, discrete mathematics is more appropriate.
However, calculus and discrete math often complement each other:
- Sums can approximate integrals
- Integrals can approximate sums
Knowing when to switch between these perspectives is a key step toward advanced mathematical thinking.

Learning path: where to go next
If you’re building a foundation, follow a structured progression:
- Strengthen fundamentals with https://cursa.app/free-online-basic-studies-courses
- Develop calculus fluency with https://cursa.app/free-courses-basic-studies-online
As you study, prioritize interpretation as much as computation. For every derivative or integral you compute, write one sentence explaining what it means. This habit transforms calculus from a technical subject into a practical reasoning tool.