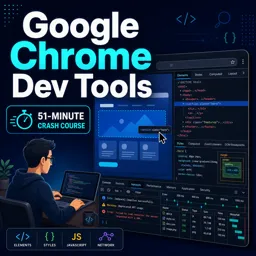


Every modern web browser includes a hidden toolbox that lets you look behind the scenes of any web page. These are the developer tools, often called DevTools, and they are one of the best learning resources available to anyone interested in web development, design or IT. You do not need to be an expert to benefit from them. With a few simple steps, you can see how a page is built, test changes instantly and find out why something is not working. This guide introduces the main panels and shows how to start using them with confidence.
How to open developer tools
The exact steps are almost the same across popular browsers such as Chrome, Edge, Firefox and Safari. You can right-click any element on a page and choose “Inspect”, or use the keyboard shortcut. On most Windows and Linux systems, F12 or Ctrl+Shift+I opens the tools. On a Mac, Cmd+Option+I usually does the job. Safari may require you to enable the developer menu in its settings first.
Once opened, the tools appear as a panel, either docked at the bottom or on the side of the browser window. Do not worry if the interface looks busy at first. You will only need a few tabs for everyday tasks.
The main panels at a glance
| Panel | What it shows | Typical use |
|---|---|---|
| Elements | The page’s HTML structure and CSS styles | Inspect layout, test style changes |
| Console | Messages, warnings and errors from JavaScript | Find script errors, run small commands |
| Network | Every file and request loaded by the page | Check loading speed and failed requests |
| Sources | The page’s scripts and files | Debug JavaScript step by step |
| Application | Cookies, local storage and cached data | See what the site stores in the browser |
The Elements panel: see how a page is built
The Elements panel shows the HTML of the page as a tree. When you hover over a line, the browser highlights the matching part of the page. When you click an element, the panel on the side shows the CSS rules applied to it, including colors, margins, fonts and sizes.
The best part is that you can edit everything live. Double-click a piece of text and change it. Disable a CSS rule using the checkbox. Type a new color value and watch the page update immediately. These changes are temporary and only exist in your browser, so you can experiment freely without breaking the real website. Refresh the page, and everything goes back to normal.
This is extremely useful for learning. If you see a layout that you like, you can inspect it to understand which properties create the effect. It is also helpful for diagnosing common problems, such as text that overflows its container or an element that does not align as expected.
The Console: where errors and messages appear
The Console is where the page and the browser communicate problems. Red messages indicate errors, yellow ones are warnings, and blue or gray ones are information. If a button on a page does not respond, the Console often explains why, for example by showing that a script failed to load or that a variable is undefined.
You can also type commands directly into the Console. For instance, typing a simple expression such as 2 + 2 returns the answer, and typing document.title shows the title of the current page. Developers use the Console to test small pieces of code quickly before adding them to a project. As a beginner, you can use it to explore how JavaScript interacts with a page.
The Network panel: understand loading and requests
Every image, stylesheet, script and data request that a page loads appears in the Network panel. You can see how large each file is, how long it takes to load and whether the request succeeded. Status codes are listed too: a 200 means success, while 404 means the resource was not found and 500 indicates a server problem.
This panel is especially valuable for performance. If a page feels slow, you can sort the list by size or time and discover which files are the heaviest. A very large image, for example, may be responsible for most of the loading delay. It is also a good way to confirm whether a form or an API request is actually being sent.
Testing how a page looks on a phone
Most browsers include a device mode that simulates smaller screens. By clicking the device icon in the toolbar, you can choose a phone or tablet size and see how the layout responds. This helps you check responsive design without owning many devices. It is not a perfect replacement for real-device testing, but it is a fast first check.
A first exercise to practice
- Open any simple web page and press F12, or use the right-click menu to inspect an element.
- In the Elements panel, find the main heading and change its text.
- Change its color or font size through the Styles pane.
- Open the Console and look for any warnings or errors.
- Switch to the Network panel, reload the page and find the largest file.
- Turn on device mode and compare the layout at phone and desktop sizes.
Good habits and safety tips
- Remember that changes in DevTools are temporary. To keep a fix, edit the actual source files.
- Do not paste code into the Console if someone you do not trust asks you to. This can be used in scams to steal account access.
- Be careful when looking at cookies or storage on sites that contain sensitive data.
- Use the search function inside the panels to find specific text, classes or requests quickly.
- Explore one panel at a time, instead of trying to learn everything at once.
Conclusion
Developer tools turn the browser into a learning lab. By inspecting elements, reading console messages and checking network requests, you gain a practical understanding of how websites work and how problems are solved. As you grow more comfortable, you can move on to deeper debugging and performance analysis. If you want a structured path into this field, the information technology and web development courses on Cursa are a good place to continue your learning.