
Exercises
Explore how statisticians select representative samples and recognize threats to survey accuracy. This quiz covers simple random, stratified, cluster, systematic, multistage, and probability-proportional-to-size sampling. You will also examine undercoverage, nonresponse, response bias, survey weights, design effects, and finite population corrections through practical scenarios and visual interpretations.
Answer the questions below and check the explanation for each answer.
0/13 answered
Auto audio on: the next questions will be read aloud when you click Continue.
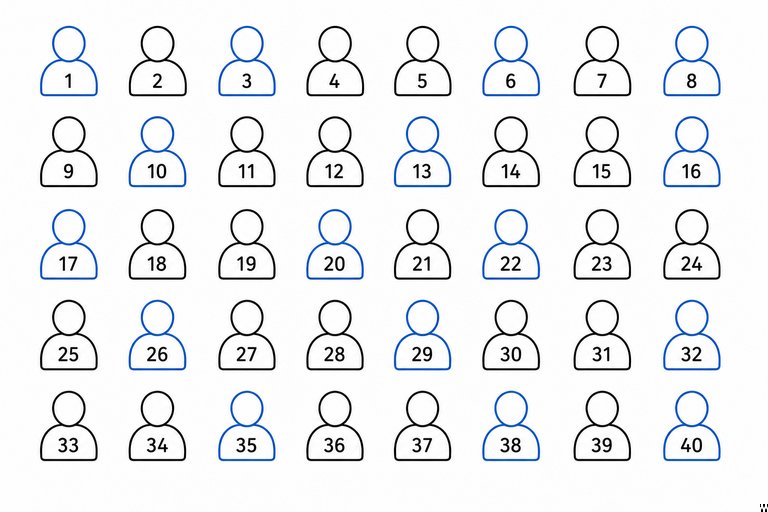
In a simple random sample, units are selected directly through a random process, giving every possible sample of the specified size an equal chance of selection.
Stratified sampling divides the population into meaningful subgroups and randomly samples within every stratum. This ensures that each year level is represented.
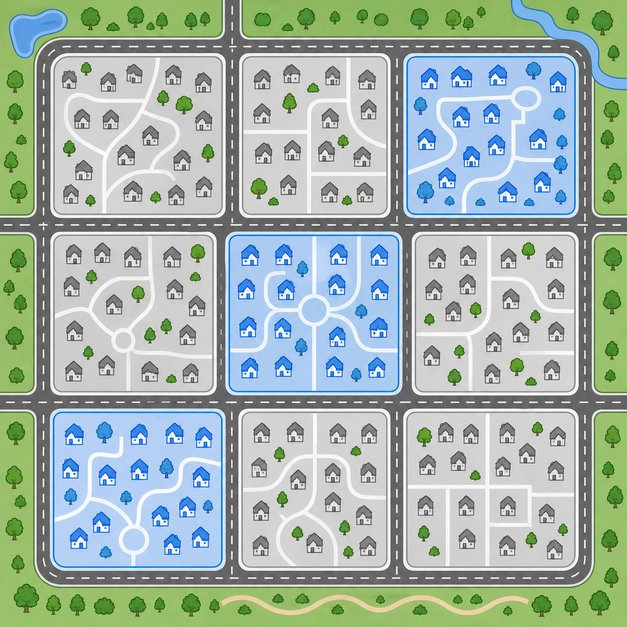
This is one-stage cluster sampling because entire naturally occurring groups are selected, and all households in the chosen groups are surveyed.
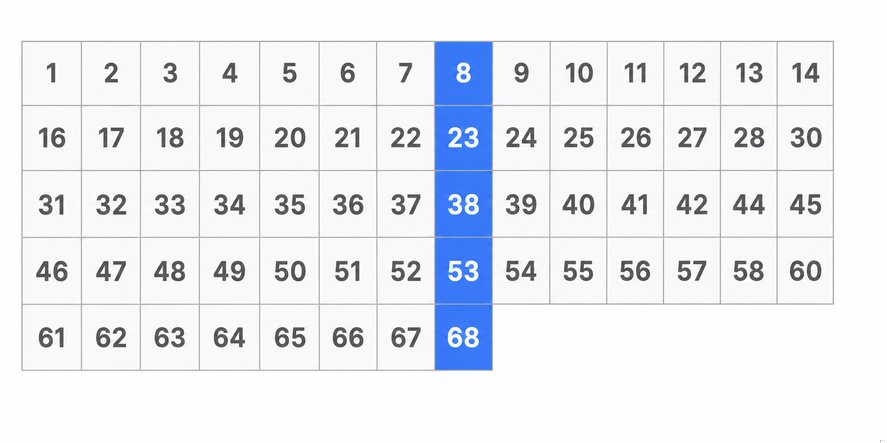
The sampling interval is the difference between consecutive selections. Here, 23 − 8 and 38 − 23 both equal 15.
If periodicity in the list aligns with the sampling interval, the sample may repeatedly select the same type of unit and systematically miss others.
Multistage sampling selects units through successive levels. Here, selection proceeds from counties to schools and then to individual students.
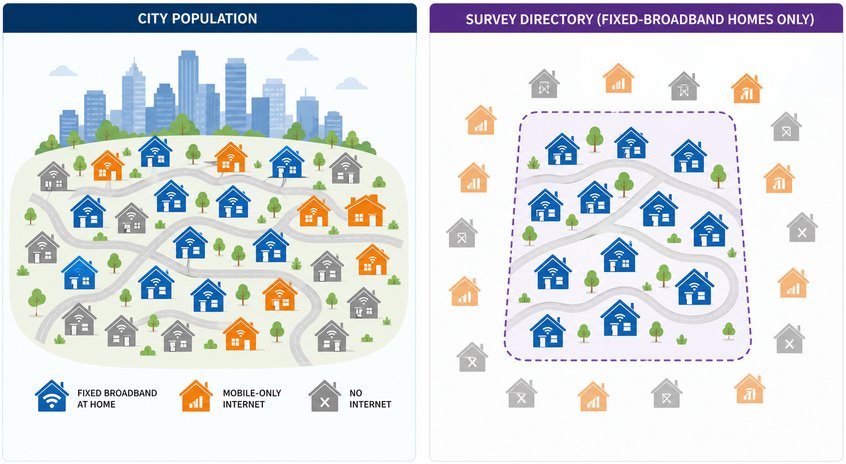
The sampling frame excludes households without fixed broadband service. This creates undercoverage because part of the target population cannot be selected.
Nonresponse bias occurs when response is related to the survey variables. It is not merely a low response rate; respondents and nonrespondents must differ in a relevant way.
Words such as responsible and protect encourage a favorable response. This can create response or measurement bias even when the sample was properly selected.
A basic survey weight is usually 1 divided by the inclusion probability. Units with lower selection probabilities receive larger weights because they represent more population units.
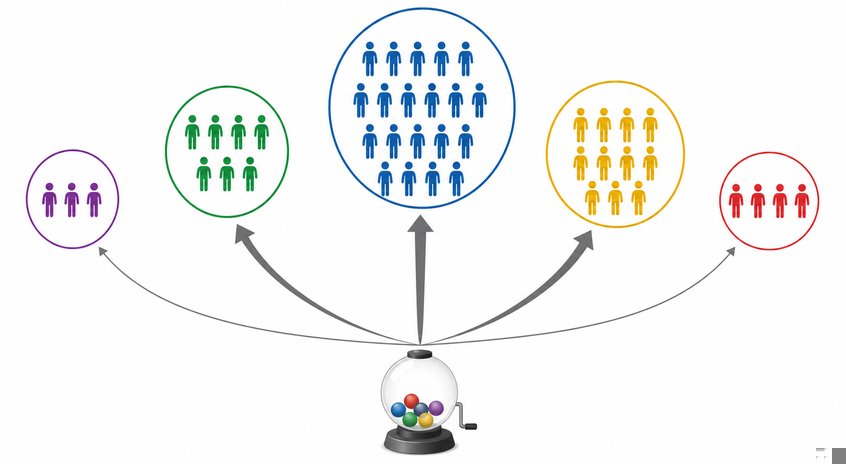
Probability-proportional-to-size sampling gives larger clusters proportionally greater selection chances. Under suitable later-stage sampling, it can help produce approximately equal person-level probabilities.
The design effect is the ratio of the actual design-based variance to the variance under simple random sampling. A value of 1.8 therefore means 1.8 times the variance, not the standard error.
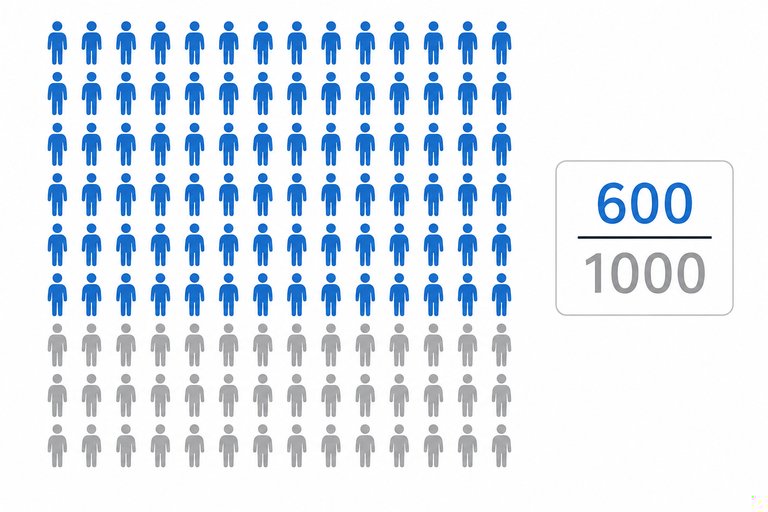
Sampling 60% of a finite population without replacement provides more information than sampling the same number from a very large population. The finite population correction accounts for this and reduces the standard error.

Free CourseStatics course
5

(2)

21h45m

35 exercises

Free CourseStatistics Course for Beginners
5
(2)
9h48m
36 exercises

Free CourseProbability and Distributions Crash Course
5
(1)
10h37m
43 exercises

Free CourseStatistics full course
5
(2)
8h15m

Free CourseStatistics
4.8
(31)
12h44m
32 exercises

Free CourseStatistics
4.8
(33)
31h55m
25 exercises

Free CourseStatistics for Data Science
4.5

(2)
8h15m

Free CourseStatistics for Applications
New
28h00m
22 exercises
Thousands of online courses in video, ebooks and audiobooks.
To test your knowledge during online courses
Generated directly from your cell phone's photo gallery and sent to your email

Download our app via QR Code or the links below:.



Carry knowledge in your pocket.
Download the Cursa app.
There are hundreds of free courses available, with a free certificate of completion that is saved in your mobile image gallery.
Download the app to access the Course Completion Certificate for Free.


+ 10 million
students

Free and Valid
Certificate

60 thousand free
exercises

4.8/5 rating in
app stores

Free courses in
video and ebooks