
Exercises
This quiz examines practical web performance testing with Apache JMeter. It covers test plan components, virtual-user workloads, ramp-up behavior, timers, assertions, parameterization, correlation, command-line execution, distributed testing, and key performance metrics. You will also interpret workload diagrams, response-time curves, spike patterns, and test-result dashboards to identify bottlenecks and evaluate system behavior under load.
Answer the questions below and check the explanation for each answer.
0/20 answered
Auto audio on: the next questions will be read aloud when you click Continue.
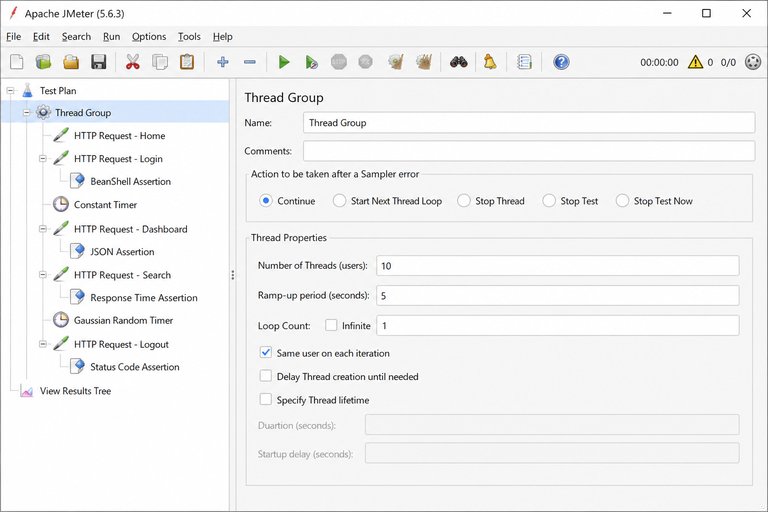
A Thread Group controls virtual users, how quickly they start, and how many times they execute the test scenario.
An HTTP Request sampler sends an HTTP or HTTPS request and records the resulting sample data, including timing and status.
A Timer introduces a delay before sampler execution, helping model realistic think time between user actions.
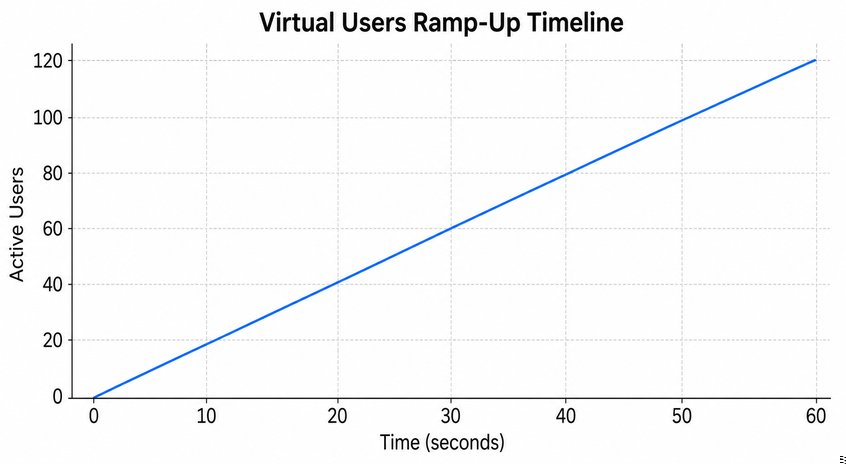
Divide 120 users by 60 seconds. The average start rate is 2 users per second, although actual scheduling can vary slightly.
The 95th percentile is the value at or below which 95% of measured response times fall. It is not an average.
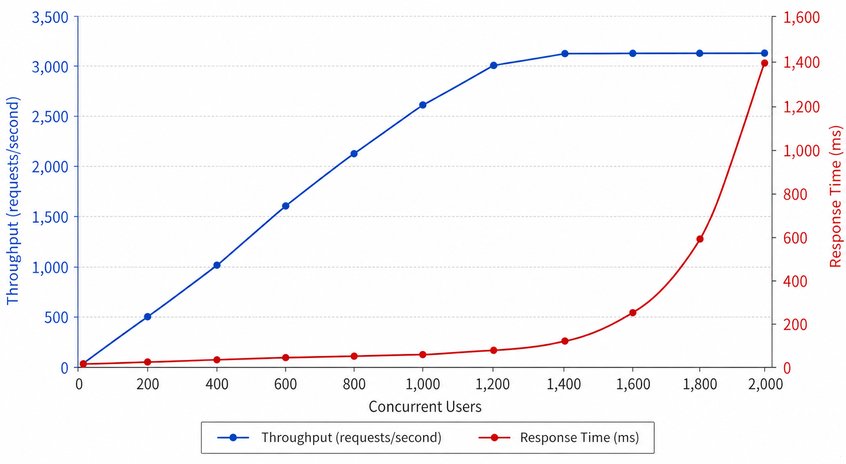
When throughput stops increasing but response time continues rising, a constrained resource has likely reached saturation.
JMeter latency measures the interval from starting a request until the first response data is received. Total elapsed time continues until the response is complete.
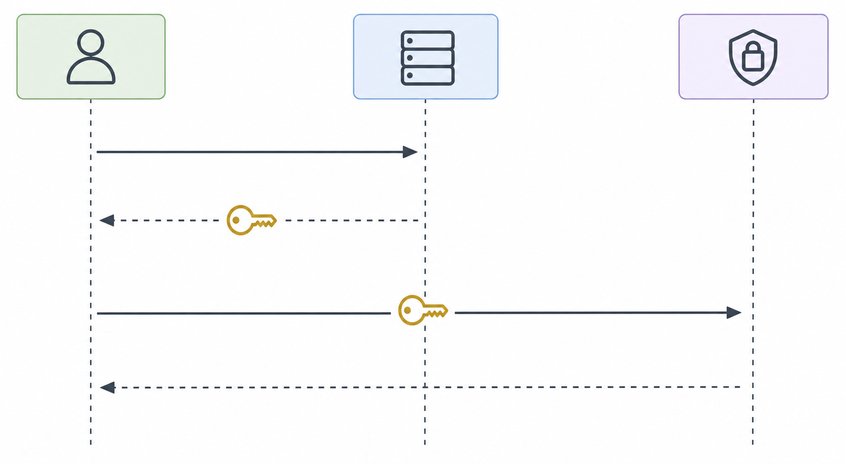
This is correlation: a post-processor extracts the dynamic value, and a JMeter variable supplies it to a later request.
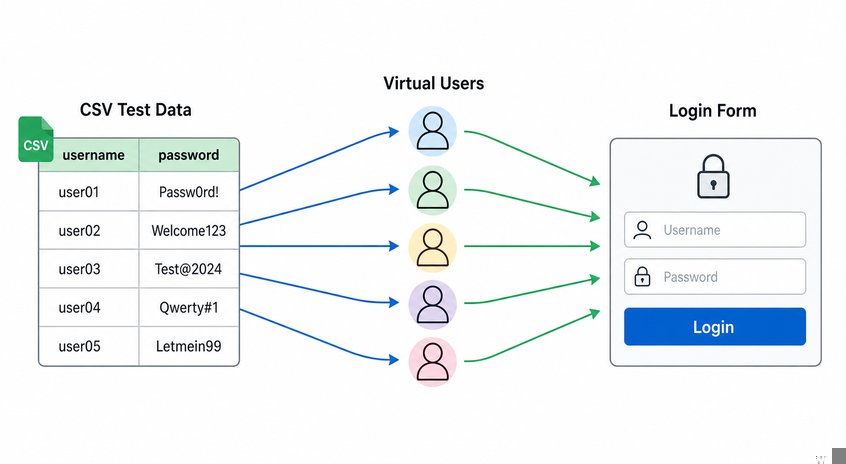
CSV Data Set Config reads rows from a delimited file into variables, enabling data-driven requests for multiple users.
A Response Assertion validates properties such as response text, status codes, headers, or other expected patterns.
Listeners that retain or render detailed samples add overhead. During heavy tests, this can distort results or exhaust the load generator's resources.
-n selects non-GUI mode, -t specifies the test plan, and -l specifies the results file.
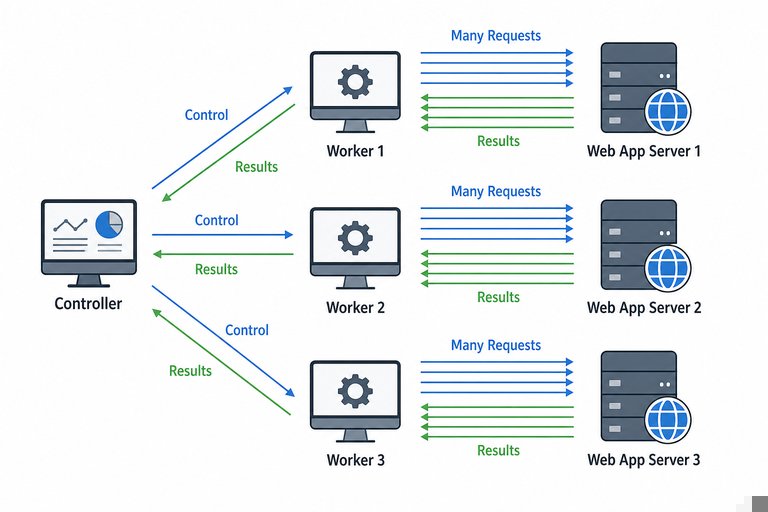
The controller initiates and coordinates tests on remote JMeter workers. The workers generate load against the target system.
Little's Law gives concurrency as throughput multiplied by response time: 40 × 0.5 = 20 requests in progress.
The Constant Throughput Timer schedules delays to approximate a target sample rate. Sufficient threads are still needed to reach that rate.
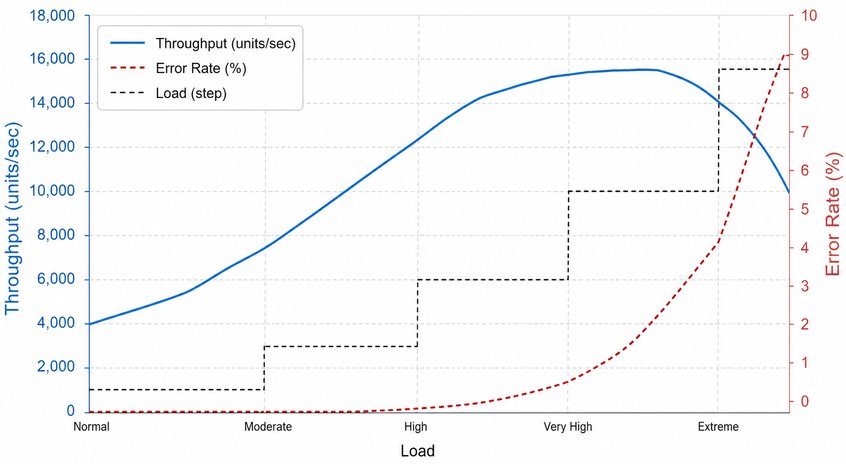
A stress test pushes a system beyond normal or expected capacity to reveal its breaking point, failure behavior, and recovery characteristics.
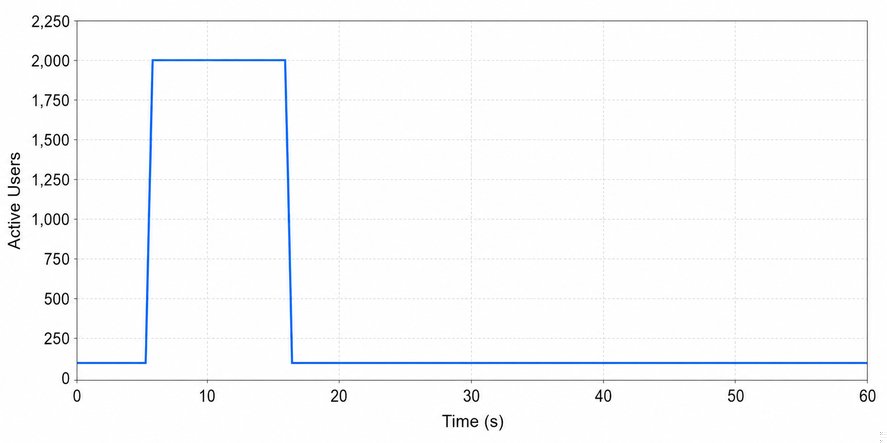
A spike test evaluates system behavior during a sudden, extreme increase or decrease in demand.
A Timer represents think time. Connection timeout settings instead control how long JMeter waits for network operations.
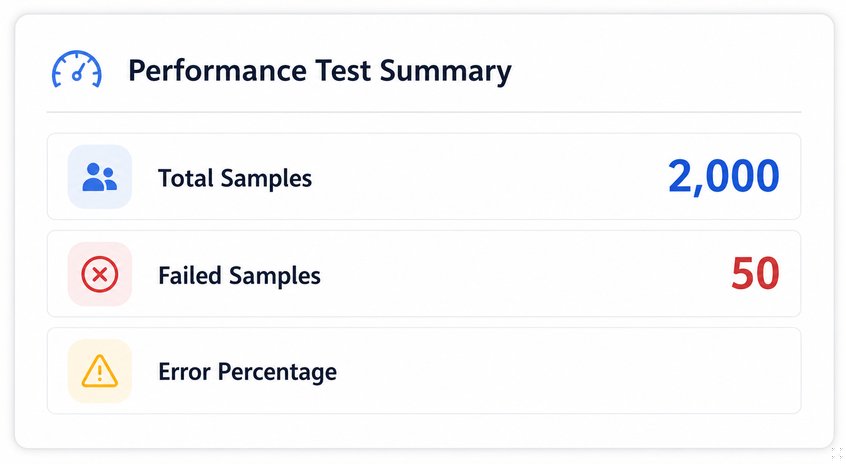
Error percentage equals failed samples divided by total samples, multiplied by 100: 50 ÷ 2,000 × 100 = 2.5%.
Early traffic may include initialization effects such as cold caches, pool creation, and runtime compilation. Warm-up helps measurements reflect stable operation.

Free CourseSoftware Testing course
5

(1)

10h18m

Free CourseIT Automation
5
(4)
6h20m

9 exercises

Free CourseSoftware Testing full course
5
(2)
4h55m
6 exercises

Free CourseJavaScript Testing
5
(1)
1h00m
6 exercises

Free CourseSoftware testing for begginers
4.7

(214)
1h01m
21 exercises

Free CourseManual Testing in softwares
4.6
(5)
19h40m
4 exercises

Free CourseSoftware testing tutorials
4.4
(44)
8h02m
27 exercises

Free CourseSoftware testing complete
4.2
(9)
10h41m
33 exercises
Thousands of online courses in video, ebooks and audiobooks.
To test your knowledge during online courses
Generated directly from your cell phone's photo gallery and sent to your email

Download our app via QR Code or the links below:.



Carry knowledge in your pocket.
Download the Cursa app.
There are hundreds of free courses available, with a free certificate of completion that is saved in your mobile image gallery.
Download the app to access the Course Completion Certificate for Free.


+ 10 million
students

Free and Valid
Certificate

60 thousand free
exercises

4.8/5 rating in
app stores

Free courses in
video and ebooks