
Exercises
Put your Excel PivotTable knowledge to the test. This quiz covers the essential tools used to turn raw data into clear, flexible summaries, including creating a PivotTable, placing fields in filter areas, changing value calculations from counts to sums, and refreshing data. You will also explore report layouts, date grouping, expanding and collapsing row fields, calculated fields, drill-down behavior, and displaying values as percentages of column totals. Ideal for students, office professionals, analysts, and anyone building confidence with Excel data analysis.
Answer the questions below and check the explanation for each answer.
0/10 answered
Auto audio on: the next questions will be read aloud when you click Continue.
The first step to creating a PivotTable in Excel is to Select the cells containing the data you want to use. This step is crucial because the PivotTable will be based on the selected dataset, allowing you to analyze and summarize the data effectively. Once the selection is made, you can proceed with other steps such as going to the 'Insert' tab and selecting 'PivotTable'.
In a PivotTable, the Filters Area is specifically used to filter out data based on the criteria you set. Placing a field here allows you to filter the entire PivotTable by selecting specific values for that field, thus affecting what data is visible without altering the underlying data structure.
To display the sum of sales rather than the count in a PivotTable, you should choose Summarize Values By and then Sum. This can be done by right-clicking a sales record cell in the PivotTable, selecting Summarize Values By, and opting for the Sum function. This method effectively changes the calculation from a count to a sum.
The Refresh action in a PivotTable updates it to reflect changes in the underlying data source. When data in the source changes, you need to refresh the PivotTable to ensure it displays the latest information. It does not change style or sorting options.
To adjust the layout and show field names in different rows, you can use the PivotTable Tools.
Go to Design > Layout Group > Report Layout, and select your desired layout format. This option allows you to customize the display of your PivotTable fields.
You can use the 'Group' option when right-clicking a date in the PivotTable to group dates. This feature allows you to organize data into temporal categories such as months, quarters, or years, enhancing data analysis capabilities in Excel's PivotTables.
When you click Collapse Field in a PivotTable with multiple row fields, the PivotTable hides all data outside the first row field. This action simplifies the view by focusing on the top-level summary data, collapsing the details of lower hierarchy row fields.
Adding a Calculated Field in a PivotTable allows you to create a new data field based on formulas that use existing fields. This is useful for performing custom calculations that are not directly available from the existing fields.
When you double-click on a value cell in a PivotTable in Excel, the default action is to create a new worksheet containing the detailed source data that makes up that value. This feature allows users to explore and analyze the underlying data for the specific summary value they clicked on.
To change a PivotTable value from 'Count' to 'Percentage of Column Total', you need to right-click on the value cell, choose 'Show Values As', then select 'Percentage of Column Total'. This option changes how the values are displayed and correctly reflects the percentage of the column total, not just changes the format.
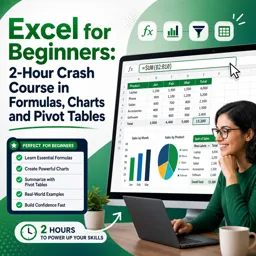
Free CourseExcel for Beginners: 2-Hour Crash Course in Formulas, Charts and Pivot Tables
5

(10)

2h09m

30 exercises
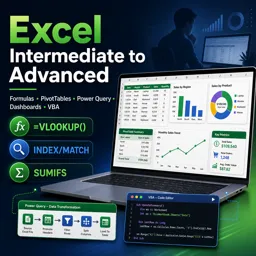
Free CourseExcel Intermediate to Advanced: Formulas, PivotTables, Power Query, Dashboards and VBA
5
(4)
18h53m
28 exercises

Free CourseMS Excel Beginner to Advanced: Formulas, Charts, Pivot Tables and Shortcuts
5
(4)
10h08m
26 exercises

Free CourseMicrosoft 365 Fundamentals MS-900 Certification Prep Course
5
(3)
3h16m
14 exercises

Free CourseGoogle data studio
5
(1)
3h42m
11 exercises

Free CourseMS Word Complete Course: Basics to Advanced Features
5
(1)
2h47m
20 exercises
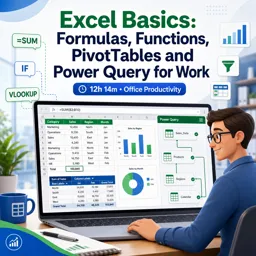
Free CourseExcel Basics: Formulas, Functions, PivotTables and Power Query for Work
5
(3)
12h14m
22 exercises
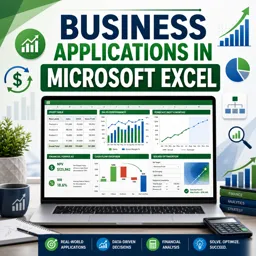
Free CourseBusiness Applications in Microsoft Excel
5
(1)
46m
7 exercises
Thousands of online courses in video, ebooks and audiobooks.
To test your knowledge during online courses
Generated directly from your cell phone's photo gallery and sent to your email

Download our app via QR Code or the links below:.



Carry knowledge in your pocket.
Download the Cursa app.
There are hundreds of free courses available, with a free certificate of completion that is saved in your mobile image gallery.
Download the app to access the Course Completion Certificate for Free.


+ 10 million
students

Free and Valid
Certificate

60 thousand free
exercises

4.8/5 rating in
app stores

Free courses in
video and ebooks