Introduction
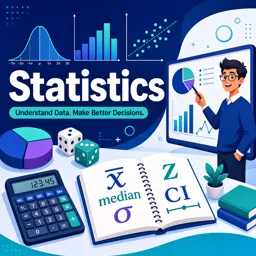
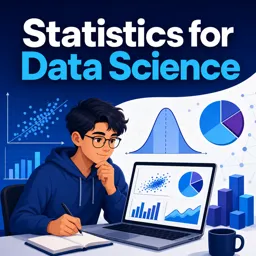
Statistics is the backbone of data science, offering tools and methods to analyze, interpret, and draw conclusions from data. At the heart of statistics are two major branches: descriptive and inferential statistics. Understanding these branches is crucial for anyone starting out in data science.
What are Descriptive Statistics?
Descriptive statistics are used to summarize and describe the main features of a dataset. They provide simple summaries about the sample and the measures.
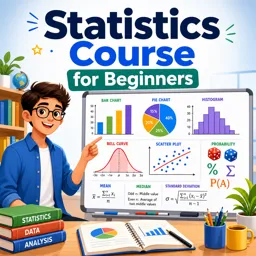
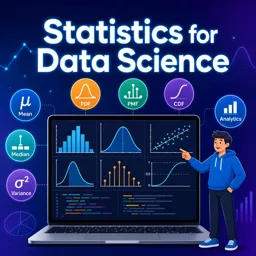
- Measures of Central Tendency: Mean, median, and mode help identify the center of the data distribution.
- Measures of Dispersion: Range, variance, and standard deviation describe how spread out the values are in the dataset.
- Visualization: Tables, graphs, and charts, such as histograms and box plots, help to visualize data distributions effectively.
Introduction to Inferential Statistics
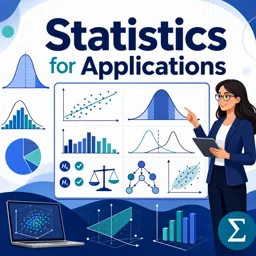
While descriptive statistics describe observed data, inferential statistics allow data scientists to make predictions or generalizations about a population based on a sample.
- Estimation: Using sample data to estimate population parameters.
- Hypothesis Testing: Making decisions about data by testing assumptions.
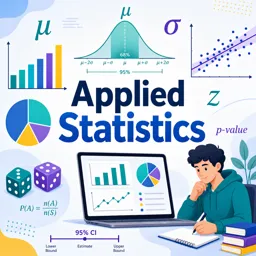
- Confidence Intervals: Indicating the reliability of an estimate.
Why Both Are Important in Data Science
Descriptive and inferential statistics work together. Descriptive statistics provide the groundwork for understanding your data, while inferential statistics help you draw conclusions and make predictions. For example, a data scientist may use descriptive statistics to summarize customer feedback, then employ inferential statistics to determine if feedback patterns observed in a sample represent the entire customer base.
Common Statistical Pitfalls to Avoid
- Ignoring outliers: Outliers can heavily influence mean and standard deviation.
- Poor sampling: Not using a representative sample can skew inferential results.
- Overgeneralization: Drawing strong conclusions from insufficient or biased data.
Conclusion
Core statistical concepts empower data scientists to make sound decisions and communicate findings effectively. By building a solid foundation in both descriptive and inferential statistics, you’ll be well-equipped to navigate the data-driven world of data science.