Introduction to Statistics for Data Science
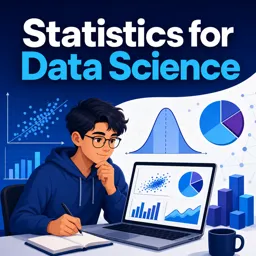
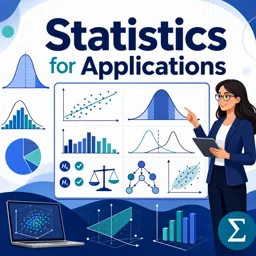
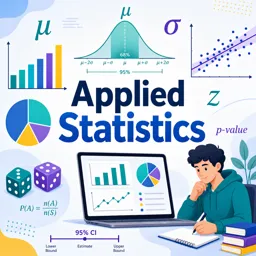
Statistics is a cornerstone of data science, providing the tools and methodologies to analyze, interpret, and extract insights from data. Mastering statistical concepts is essential for anyone aspiring to work in data science or related fields, as it enables making informed decisions based on data-driven evidence.
Why Do Data Scientists Need Statistics?
Data science involves handling large amounts of information, looking for meaningful patterns, testing hypotheses, and building predictive models. Statistics empowers data scientists to:
- Summarize and describe complex datasets concisely.
- Draw inferences about a population based on a sample.
- Measure uncertainty and variation in data.
- Identify significant relationships and correlations between variables.
- Validate the results of data models and experiments.
Key Statistical Concepts in Data Science
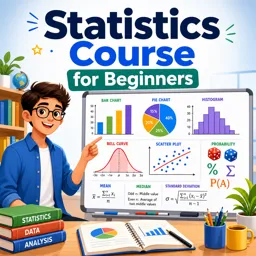
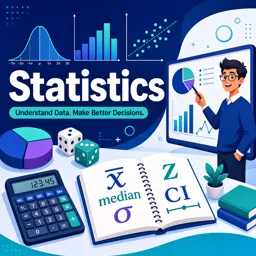
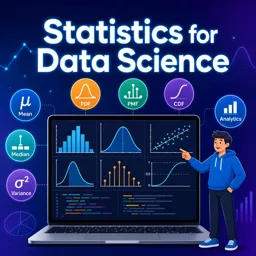
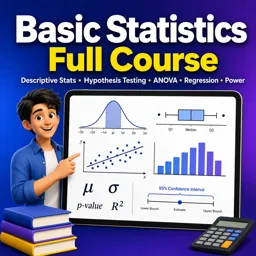
- Descriptive Statistics: Techniques such as mean, median, mode, variance, and standard deviation help summarize and visualize data distributions.
- Inferential Statistics: Includes estimation, hypothesis testing, and confidence intervals, enabling conclusions to be drawn about larger populations from samples.
- Probability: The foundation of statistical inference, probability helps quantify uncertainty and model random events.
- Correlation and Causation: Correlation measures how variables move together, but understanding when one causes the other is crucial in data-driven decision making.
- Regression Analysis: A powerful tool for modeling the relationship between dependent and independent variables, used extensively for prediction.
Common Statistical Methods in Data Science
In practice, data scientists employ various statistical methods such as:
- Sampling techniques to ensure representative data.
- ANOVA and t-tests to compare groups and test hypotheses.
- Chi-square tests to examine categorical data relationships.
- Bootstrapping and resampling methods to estimate variability.
Conclusion
Statistics forms the bedrock of data science, arming practitioners with vital tools to dissect data, understand patterns, and drive actionable insights. Building a solid statistical foundation enables more effective analyses, accurate predictions, and robust data-driven decisions in today’s information-rich world.