Introduction to Statistics
Statistics is the science of collecting, analyzing, interpreting, and presenting data. It helps us make sense of the world by providing a systematic approach to studying numerical information. Whether you are a student, researcher, or simply someone curious about data, understanding the key concepts in statistics is crucial for making informed decisions.
Types of Data
- Qualitative Data: Also called categorical data, this type represents characteristics or qualities, such as colors, labels, or names.
- Quantitative Data: This type consists of numerical values, allowing for mathematical operations. Quantitative data is further divided into discrete (countable items) and continuous (measurable quantities).
Descriptive vs. Inferential Statistics
- Descriptive Statistics: These methods summarize or describe the essential features of a data set. Examples include calculating averages, medians, modes, ranges, and using charts or graphs to visually represent data.
- Inferential Statistics: These techniques involve making predictions or inferences about a population based on a sample. Inferential statistics uses probability theory to estimate and test hypotheses.
Measures of Central Tendency
Central tendency refers to the center point or typical value of a dataset. The three main measures are:
- Mean: The average of all data points.
- Median: The middle value when data is ordered from smallest to largest.
- Mode: The value that appears most frequently in the dataset.
Measures of Spread
Understanding how data is dispersed provides insights into variability:
- Range: The difference between the highest and lowest values.
- Variance: The average of squared differences from the mean.
- Standard Deviation: The square root of the variance, expressing spread in the same units as the data.
Visualizing Data
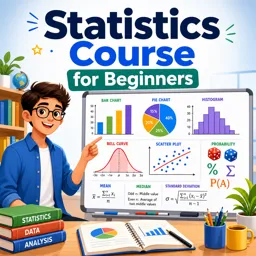
Visual representation helps make data comprehensible and reveals patterns. Common visualization tools include:
- Bar charts
- Histograms
- Pie charts
- Box plots
Conclusion
By understanding statistical basics like types of data, descriptive and inferential techniques, and how to measure central tendency and dispersion, you lay a strong foundation for further study. Mastery of these concepts will empower you to analyze data effectively and draw meaningful conclusions in any field.