What is Statistics?
Statistics is a branch of mathematics that deals with collecting, organizing, analyzing, interpreting, and presenting data. It helps us make sense of large amounts of information and draw meaningful conclusions from it. Whether in science, business, or everyday life, statistical thinking enables us to make informed decisions based on data.
Types of Statistics: Descriptive vs. Inferential
- Descriptive Statistics: These are methods for summarizing and organizing data. Common tools include mean, median, mode, standard deviation, and graphical representations like charts and histograms.
- Inferential Statistics: These techniques allow us to make predictions or inferences about a population based on a sample of data. Examples include hypothesis testing, confidence intervals, and regression analysis.
Types of Data
Understanding the nature of your data is vital in statistics. Data can be classified in different ways:
- Qualitative (Categorical) Data: This is data that can be grouped into categories, such as colors, brands, or types.
- Quantitative (Numerical) Data: Data that can be measured and counted, such as height, age, or weight. Quantitative data can further be divided into discrete (countable items) and continuous (measured on a scale).
Key Measures in Statistics
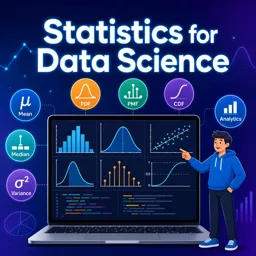
- Mean (Average): Add up all values and divide by the number of values.
- Median: The middle value when data is ordered from smallest to largest.
- Mode: The value that appears most frequently in your data set.
- Range: The difference between the highest and lowest values.
- Variance and Standard Deviation: These measure how spread out values are from the mean.
Importance and Applications of Statistics
Statistics plays a crucial role in many fields such as health, finance, education, sports, marketing, and more. Statistical analysis helps in:
- Identifying patterns and trends
- Testing hypotheses
- Making predictions
- Evaluating probabilities and risks
- Improving decision-making processes
Summary
In summary, statistics gives us the tools to interpret data and make reasoned judgments in a world filled with information. Knowing the types of statistics, types of data, and key measures is the first step in navigating more advanced statistical concepts and applications.