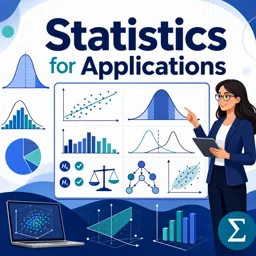
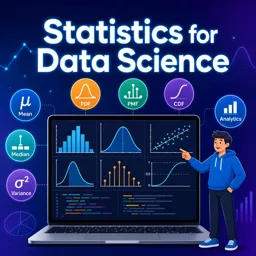
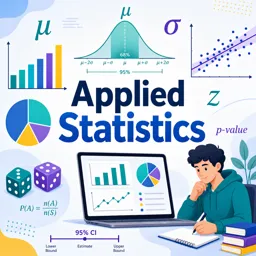
Statistics play a crucial role in business and economics, providing the tools needed to analyze data, make informed decisions, and forecast future trends. From market analysis and financial forecasting to quality control and decision-making, statistical methods are essential for success in these fields. This article explores various applications of statistics in business and economics and highlights their importance in data-driven decision-making.
Market Analysis
- Consumer Behavior
- Understanding consumer behavior is vital for businesses to develop effective marketing strategies. Statistical techniques such as surveys, data mining, and cluster analysis help identify consumer preferences, buying patterns, and market segments.
- Market Trends
- Analyzing market trends allows businesses to stay ahead of competitors and adapt to changing market conditions. Time series analysis and regression models are used to identify patterns and forecast future trends.
- Product Development
- Statistics guide product development by analyzing customer feedback, market needs, and potential demand. Conjoint analysis and other multivariate techniques help determine the optimal features and pricing for new products.
Financial Forecasting
- Risk Assessment
- Assessing financial risks is critical for making investment decisions and managing portfolios. Statistical methods such as value at risk (VaR), Monte Carlo simulations, and scenario analysis are used to evaluate potential risks and returns.
- Forecasting Revenue and Sales
- Accurate revenue and sales forecasts enable businesses to plan for future growth and allocate resources effectively. Time series analysis, exponential smoothing, and regression models are commonly used for financial forecasting.
- Investment Analysis
- Statistical techniques are employed to analyze investment performance, evaluate stock market trends, and optimize investment portfolios. Techniques such as CAPM (Capital Asset Pricing Model) and factor analysis are essential in finance.
Quality Control
- Process Improvement
- Quality control relies on statistical methods to monitor and improve production processes. Control charts, process capability analysis, and Six Sigma techniques help identify and reduce variability in manufacturing.
- Product Quality
- Ensuring product quality is crucial for customer satisfaction and brand reputation. Statistical sampling, hypothesis testing, and design of experiments (DOE) are used to test product quality and identify areas for improvement.
- Customer Satisfaction
- Measuring and analyzing customer satisfaction provides insights into product and service quality. Surveys, net promoter scores (NPS), and sentiment analysis are statistical methods used to gauge customer satisfaction.
Decision-Making
- Data-Driven Strategies
- Informed decision-making relies on accurate data analysis. Statistical tools such as decision trees, linear programming, and predictive analytics help businesses make data-driven strategic decisions.
- Resource Allocation
- Efficient resource allocation is essential for maximizing profits and minimizing costs. Operations research techniques, including optimization models and simulation, are used to allocate resources effectively.
- Performance Measurement
- Measuring business performance involves analyzing key performance indicators (KPIs) and metrics. Descriptive statistics, dashboards, and benchmarking are used to monitor and evaluate business performance.
Conclusion
The applications of statistics in business and economics are vast and varied, providing essential tools for analyzing data, making informed decisions, and forecasting future trends. From market analysis and financial forecasting to quality control and decision-making, statistical methods enable businesses and economists to navigate complex environments and achieve success. By leveraging the power of statistics, businesses can optimize their operations, improve product quality, and enhance customer satisfaction, ultimately driving growth and profitability.