Free Course Image Data Science

Free online courseData Science

Duration of the online course: 5 hours and 58 minutes

5

StarStarStarStarStar

(3)

Learn Data Science with R programming. This free online course by MarinStatsLectures covers RStudio basics, data importing/exporting, statistical analysis, and advanced regression.

In this free course, learn about

  • Getting Started with R and RStudio
  • Importing and Exporting Data
  • Working with Data Structures and Subsetting
  • R Project Organization, Scripts, and Packages
  • Apply Family Functions and Data Aggregation
  • Basic Data Visualization in R
  • Probability Distributions in R
  • Classical Hypothesis Testing in R
  • Resampling and Permutation Methods
  • Categorical Data Analysis in R
  • Linear Regression Modeling in R
  • Working with Categorical Predictors in Regression
  • Advanced Multiple Regression, Interactions, and Model Selection

Course Description

The course "Data Science with R programming" offers a comprehensive introduction to mastering data science using the R programming language. With a total duration of 5 hours and 58 minutes, this extensive course delves into numerous facets of R programming, making it an excellent resource for aspiring data scientists and professionals in the field of Information Technology, specifically within the subcategory of Artificial Intelligence.

Starting from the basics, the course introduces participants to RStudio, illustrating its significance and encouraging them to download and set up the environment. Participants will then be guided through basic arithmetic operations and coding in R, building a solid foundation for more complex topics.

One of the critical aspects emphasized in the course is working with data structures in R. From creating and manipulating vectors and matrices to importing data from various formats such as Excel, CSV, and text files, the course ensures that participants gain hands-on experience with practical data handling techniques. Participants will also learn to export data from R, ensuring they can seamlessly transition between different software environments.

The course places a strong emphasis on data manipulation and transformation, illustrating how to work with variables, subset data, and utilize logic statements. R's powerful functions, such as cbind and rbind for combining data, are also covered in detail. Additionally, participants will learn to set up their working directory in R and develop their coding practices by writing scripts and installing packages.

Visualization is another essential component of data science, and this course does not disappoint. From bar charts and pie charts to box plots, histograms, and scatterplots, participants will gain the skills to create a wide range of visual data representations. The course also covers how to customize plots, allowing participants to modify and enhance the appearance of their visualizations with text and legends.

Understanding data distributions is pivotal in data science, and the course delves into various distributions such as binomial, Poisson, and normal distributions, along with concepts like Z scores and t scores. This foundational knowledge prepares participants for more advanced statistical tests and methods.

Participants will explore a variety of hypothesis testing techniques, including one-sample and two-sample t-tests, Mann-Whitney U tests, bootstrapping, permutation tests, and more. These topics are essential for making data-driven decisions and validating findings in real-world scenarios.

Advanced topics, such as ANOVA, chi-square tests, Fisher's exact tests, and regression analysis, are also thoroughly covered. The course guides participants through simple linear regression, multiple linear regression, and polynomial regression. It also explains how to check regression assumptions, handle dummy variables, and interpret interactions in linear regression models.

Overall, "Data Science with R programming" provides a thorough and practical guide to data science using R, enabling participants to confidently tackle data analysis and visualization tasks in their professional endeavors. Whether you are a novice or looking to enhance your existing skills, this course serves as a valuable resource in the realm of data science and artificial intelligence.

Course content

  • Video class: What is RStudio and Why Should You Download It? | R Tutorial 1.1 | MarinStatsLectures 05m
  • Exercise: Which of the following statements is NOT true about R and RStudio according to the text provided?
  • Video class: Getting started with R: Basic Arithmetic and Coding in R | R Tutorial 1.3 | MarinStatsLectures 07m
  • Exercise: In R, how can you comment on code for future reference?
  • Video class: Create and Work with Vectors and Matrices in R | R Tutorial 1.4 | MarinStatslectures 08m
  • Exercise: Which R command is used to generate a sequence of numbers with non-integer increments?
  • Video class: Import Data, Copy Data from Excel to R CSV 06m
  • Exercise: How can data be imported into R from Excel?
  • Video class: Importing/Reading Excel data into R using RStudio (readxl) | R Tutorial 1.5b | MarinStatsLectures 08m
  • Exercise: Which R package is used specifically for importing Excel formatted data into R as described in the tutorial?
  • Video class: Export Data from R (csv , txt and other formats) | R Tutorial 1.6 | MarinStatsLectures 05m
  • Exercise: Which R command does not require specifying a separator for CSV files?
  • Video class: Importing , Checking and Working with Data in R | R Tutorial 1.7 | MarinStatsLectures 08m
  • Exercise: Which command in R allows you to import a text dataset without needing to specify the path to the file?
  • Video class: Working with Variables and Data in R | R Tutorial 1.8 | MarinStatslectures 08m
  • Exercise: How can variables be extracted from an object in R?
  • Video class: Subsetting (Sort/Select) Data in R with Square Brackets | R Tutorial 1.9| MarinStatsLectures 04m
  • Exercise: In the R programming language, when subsetting data frames, what does a pair of square brackets with a blank after a comma indicate?
  • Video class: Logic Statements (TRUE/FALSE), cbind and rbind Functions in R | R Tutorial 1.10| MarinStatsLectures 04m
  • Exercise: What does the "as.numeric" command do in R based on the video context?
  • Video class: Setting Up Working Directory in R | R Tutorial 1.11 | MarinStatsLectures 08m
  • Exercise: Which R command can be used to save the current workspace image with a specified filename?
  • Video class: Writing Scripts in R | R Tutorial 1.12 | MarinStatsLectures 06m
  • Exercise: What is an R script and its significance in RStudio?
  • Video class: How to Install Packages in R | R Tutorial 1.13 | MarinStatsLectures 06m
  • Exercise: What command is used to install a new package in R?
  • Video class: Customizing The Look of R Studio | R Tutorial 1.14 | MarinStatsLectures 03m
  • Exercise: What menu in RStudio allows you to set the default mirror for installing packages?
  • Video class: Apply Function in R | R Tutorial 1.15 | MarinStatsLectures 06m
  • Exercise: What is the purpose of the 'na.rm' argument in the context of the apply function in R?
  • Video class: tApply Function in R | R Tutorial 1.16 | MarinStatsLectures 04m
  • Exercise: What does the 'tapply' function in R primarily do?
  • Video class: Bar Charts and Pie Charts in R | R Tutorial 2.1 | MarinStatsLectures 04m
  • Exercise: Which command in R is used to create a bar chart?
  • Video class: Boxplots and Grouped Boxplots in R | R Tutorial 2.2 | MarinStatsLectures 04m
  • Exercise: What is the primary use of a box plot in statistical analysis?
  • Video class: Box Plots with Two Factors (Stratified Boxplots) in R | R Tutorial 2.3 | MarinStatsLectures 07m
  • Exercise: In the context of stratified boxplots in R, which command is used to cross two categorical variables to produce separate plots for each combination of their categories?
  • Video class: Histograms in R | R Tutorial 2.4 | MarinStatsLectures 04m
  • Exercise: What R argument can be used to display a histogram with probability density on the y-axis?
  • Video class: Stem and Leaf Plots in R | R Tutorial 2.5 | MarinStatsLectures 02m
  • Exercise: In R, how can the scale of a stem and leaf plot be adjusted to have ranges like 1.0 to 1.4 on one stem and 1.5 to 1.9 on a separate stem?
  • Video class: Stacked and Grouped Bar Charts and Mosaic Plots in R |R Tutorial 2.6| MarinStatsLectures 03m
  • Video class: Scatterplots in R | R Tutorial 2.7 | MarinStatsLectures 04m
  • Exercise: In R, which command is used to add a nonparametric smoother like a 'smooth.spline' to a scatterplot?
  • Video class: Calculating Mean, Standard Deviation, Frequencies and More in R | R Tutorial 2.8| MarinStatsLectures 06m
  • Video class: How to Modify and Customize Plots in R | R Tutorial 2.9 | MarinStatsLectures 15m
  • Exercise: What R argument would you use to change the size of the plotting characters in a scatterplot?
  • Video class: Add and Customize Text in Plots with R | R Tutorial 2.10 | MarinStatsLectures 07m
  • Video class: Add and Customize Legends to Plots in R | R Tutorial 2.11| MarinStatsLectures 08m
  • Exercise: In R, how can you add a legend to a plot without a box around it?
  • Video class: Binomial Distribution in R | R Tutorial 3.1| MarinStatsLectures 03m
  • Video class: Poisson Distribution in R | R Tutorial 3.2 | MarinStatsLectures 04m
  • Exercise: In R, if you want to calculate the probability of a poisson random variable being exactly equal to a certain number, which command should you use?
  • Video class: Normal Distribution, Z Scores, and Normal Probabilities in R | R Tutorial 3.3| MarinStatslectures 06m
  • Video class: t Distribution and t Scores in R | R Tutorial 3.4 | MarinStatsLectures 04m
  • Exercise: Which command would you use in R to calculate the probability associated with a t value greater than 2.3 with 25 degrees of freedom?
  • Video class: One-Sample t Test 04m
  • Video class: Two-Sample t Test in R (Independent Groups) with Example | R Tutorial 4.2 | MarinStatsLectures 06m
  • Exercise: In the context of assessing the relationship between smoking and lung capacity using R, which command allows you to test the hypothesis that the means of two unpaired groups are different, assuming non-equal variances?
  • Video class: Mann Whitney U / Wilcoxon Rank-Sum Test in R | R Tutorial 4.3 | MarinStatsLectures 04m
  • Video class: Paired t-Test in R with Examples | R Tutorial 4.7 | MarinStatsLectures 04m
  • Video class: Wilcoxon Signed Rank Test in R with Example | R Tutorial 4.8 | MarinStatsLectures 03m
  • Exercise: In R, if a researcher wants to conduct a non-parametric test to assess the median difference between paired observations, such as comparing systolic blood pressure before and after treatment, which command should they use?
  • Video class: Bootstrap Hypothesis Testing in R with Example | R Video Tutorial 4.4 | MarinStatsLecutres 14m
  • Exercise: Which R function would you use to set the random seed for reproducibility when implementing a bootstrap approach to hypothesis testing?
  • Video class: Bootstrap Confidence Interval with R | R Video Tutorial 4.5 | MarinStatsLectures 11m
  • Video class: Permutation Hypothesis Test in R with Examples | R Tutorial 4.6 | MarinStatsLectures 14m
  • Exercise: Which of the following statements correctly describes the handling of data during a permutation test, as described in the text provided?
  • Video class: ANOVA, ANOVA Multiple Comparisons 04m
  • Video class: Chi-Square Test, Fisher’s Exact Test 03m
  • Exercise: In R, what is the purpose of setting the 'correct' argument to True when using the 'CHISQ.Test' function?
  • Video class: Odds Ratio, Relative Risk 06m
  • Video class: Correlations and Covariance in R with Example | R Tutorial 4.12 | MarinStatsLectures 06m
  • Exercise: Which statement is accurate about the computation of correlation in R?
  • Video class: Simple Linear Regression in R | R Tutorial 5.1 | MarinStatsLectures 05m
  • Video class: Checking Linear Regression Assumptions in R | R Tutorial 5.2 | MarinStatsLectures 07m
  • Exercise: Which of the following R commands is used to add a regression line to an existing plot in a linear regression analysis?
  • Video class: Multiple Linear Regression in R | R Tutorial 5.3 | MarinStatsLectures 05m
  • Video class: Changing Numeric Variable to Categorical in R | R Tutorial 5.4 | MarinStatsLectures 05m
  • Exercise: In the context of converting a numeric variable into a categorical variable in R, what does setting the 'right' argument to FALSE in the 'cut' command do to the intervals?
  • Video class: Dummy Variables or Indicator Variables in R | R Tutorial 5.5 | MarinStatsLectures 06m
  • Video class: Change Reference (Baseline) Category in Regression with R | R Tutorial 5.6 | MarinStatsLectures 04m
  • Exercise: What purpose does the 'relevel' command serve in adjusting categorical variables in a linear regression model in R?
  • Video class: Including Variables/ Factors in Regression with R, Part I | R Tutorial 5.7 | MarinStatsLectures 05m
  • Video class: Including Variables/ Factors in Regression with R, Part II | R Tutorial 5.8 | MarinStatsLectures 06m
  • Exercise: When constructing a multiple linear regression model in R with 'lung capacity' as the dependent variable, which of the following variables is NOT included as an independent explanatory variable?
  • Video class: Multiple Linear Regression with Interaction in R | R Tutorial 5.9 | MarinStatsLectures 07m
  • Exercise: Which R syntax correctly includes an interaction term between smoking status and age in a linear regression model?
  • Video class: Interpreting Interaction in Linear Regression with R | R Tutorial 5.10 | MarinStatsLectures 06m
  • Video class: Partial F-Test for Variable Selection in Linear Regression | R Tutorial 5.11| MarinStatsLectures 09m
  • Video class: Polynomial Regression in R | R Tutorial 5.12 | MarinStatsLectures 06m
  • Exercise: In the context of polynomial regression as described in the video, why can't height squared be directly included in a model call in R?

This free course includes:

5 hours and 58 minutes of online video course

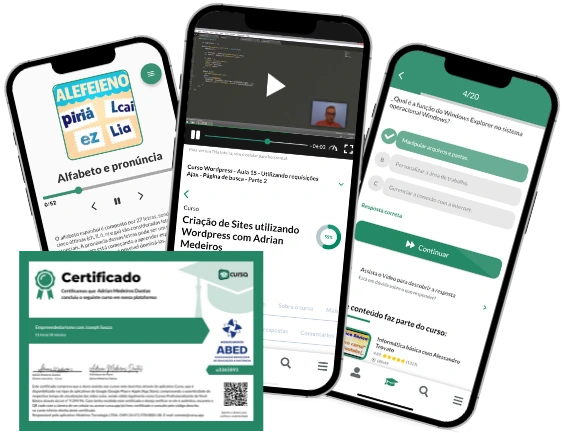
Digital certificate of course completion (Free)

Exercises to train your knowledge

100% free, from content to certificate

Ready to get started?Download the app and get started today.

Install the app now

to access the course
Icon representing technology and business courses

Over 5,000 free courses

Programming, English, Digital Marketing and much more! Learn whatever you want, for free.

Calendar icon with target representing study planning

Study plan with AI

Our app's Artificial Intelligence can create a study schedule for the course you choose.

Professional icon representing career and business

From zero to professional success

Improve your resume with our free Certificate and then use our Artificial Intelligence to find your dream job.

You can also use the QR Code or the links below.

QR Code - Download Cursa - Online Courses

Course comments: Data Science

Jacopo Ferretti

This is a really good course, especially the second part. I have learned some interesting things from it

More free courses at Artificial Intelligence

Download the App now to have access to + 3300 free courses, exercises, certificates and lots of content without paying anything!

  • 100% free online courses from start to finish

    Thousands of online courses in video, ebooks and audiobooks.

  • More than 48 thousand free exercises

    To test your knowledge during online courses

  • Valid free Digital Certificate with QR Code

    Generated directly from your cell phone's photo gallery and sent to your email

Cursa app on the ebook screen, the video course screen and the course exercises screen, plus the course completion certificate

+ 9 million
students

Free and Valid
Certificate

60 thousand free
exercises

4.8/5 rating in
app stores

Free courses in
video and ebooks