What “Triage” and “Full Forensics” Mean in Incident Response
Definition and intent: In incident response (IR), triage is a rapid, decision-oriented examination designed to answer urgent questions: “What is affected?”, “Is the threat still active?”, “What should we contain first?”, and “What business services are at risk?” Triage prioritizes speed and operational impact, often using targeted data collection and live system interrogation to guide containment and scoping.
Definition and intent: Full forensics is a comprehensive, methodical examination intended to reconstruct events in detail, validate hypotheses, attribute actions to accounts or processes, and produce defensible findings. Full forensics typically involves deeper artifact coverage, broader time ranges, and more extensive correlation across hosts, users, and cloud/mobile sources.
How they relate: Triage and full forensics are not competing approaches; they are phases or modes that can overlap. Triage frequently triggers containment actions and identifies which systems deserve deeper examination. Full forensics often starts after immediate risk is reduced, but it can also run in parallel on a subset of high-value systems while triage continues elsewhere.
When to Choose Triage, Full Forensics, or Both
Decision drivers: Choose triage when time-to-containment matters more than completeness, when the environment is large, or when you have limited staff. Choose full forensics when you need detailed reconstruction, when the incident has legal/regulatory implications, when you suspect insider activity, or when you must validate exactly what data was accessed or exfiltrated.
Common triage triggers: ransomware spreading, active command-and-control, suspected credential theft, widespread phishing with unknown click rate, or a cloud key leak that may be actively exploited. In these cases, you need fast scoping and containment guidance.
- Listen to the audio with the screen off.
- Earn a certificate upon completion.
- Over 5000 courses for you to explore!
Download the app
Common full forensics triggers: confirmed data breach, suspected long-term persistence, executive or privileged account compromise, repeated reinfection, or a dispute where you must explain “who did what, when, and how” with high confidence.
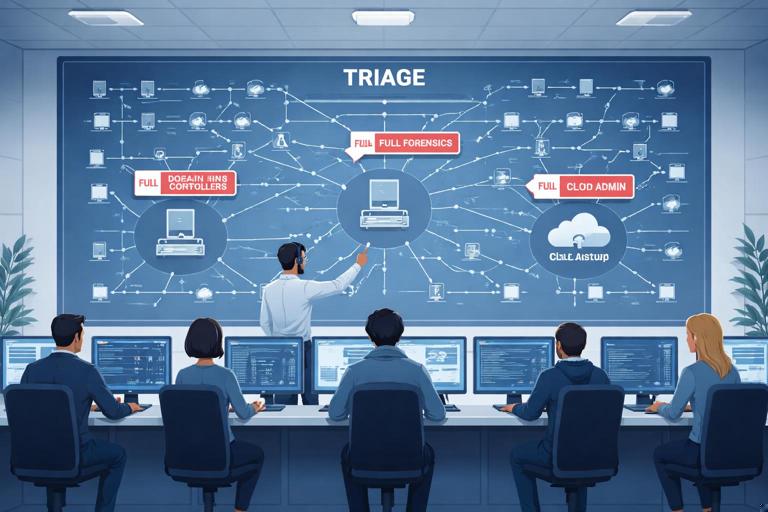
Hybrid approach: A practical pattern is “triage everywhere, full forensics somewhere.” You triage many endpoints to find the blast radius and pick a small set of representative or high-value systems for full forensic work (patient zero, domain controllers, key servers, the CFO laptop, the jump box, the cloud admin account).

Key Differences: Scope, Depth, Time, and Risk
Scope: Triage is selective: a few directories, a few logs, a few process and network snapshots, and a limited time window. Full forensics is expansive: multiple artifact categories, longer time windows, and cross-system correlation.
Depth: Triage aims for “good enough to act.” Full forensics aims for “complete enough to explain.” For example, triage might identify a suspicious scheduled task and its binary; full forensics will determine when it was created, by which account, what it executed over time, and what other changes it made.
Time and compute: Triage is minutes to hours per host; full forensics can be days per host depending on data volume and complexity. Triage often uses lightweight collection and quick parsing; full forensics may involve deeper timeline building and broader artifact extraction.
Operational risk: Triage is frequently performed on live systems and can change system state (opening tools, querying logs, collecting volatile data). Full forensics often prefers controlled analysis environments and repeatable processing, but may still require live acquisition for volatile artifacts. The trade-off is that triage can be more disruptive if not planned carefully, while full forensics can delay containment if started too broadly too early.
Triage Goals and Questions to Answer
Containment-oriented questions: Is the attacker still present? Is lateral movement ongoing? Are privileged credentials compromised? Are backups reachable? Which hosts show the same indicators? Which user accounts are involved? What is the earliest known compromise time?
Scoping questions: How many endpoints show the suspicious process, persistence mechanism, or network destination? Which servers have unusual authentication patterns? Which cloud resources show anomalous API calls? Which mobile devices have risky profiles or suspicious app installs?
Prioritization questions: Which systems are critical to business operations? Which systems store sensitive data? Which systems have privileged access paths (domain admin workstations, jump servers, CI/CD runners, cloud admin consoles)? Triage should produce a ranked list of systems for immediate containment and deeper follow-up.
Full Forensics Goals and Questions to Answer
Reconstruction questions: What was the initial access vector (phishing, exposed service, stolen token)? What persistence was established? What tools were executed and from where? What data was accessed, staged, compressed, or transmitted? What accounts were used and how were they authenticated?
Validation questions: Can we confirm or refute exfiltration? Can we prove the timeline of key actions? Can we identify all affected identities and endpoints? Can we distinguish attacker activity from admin activity?
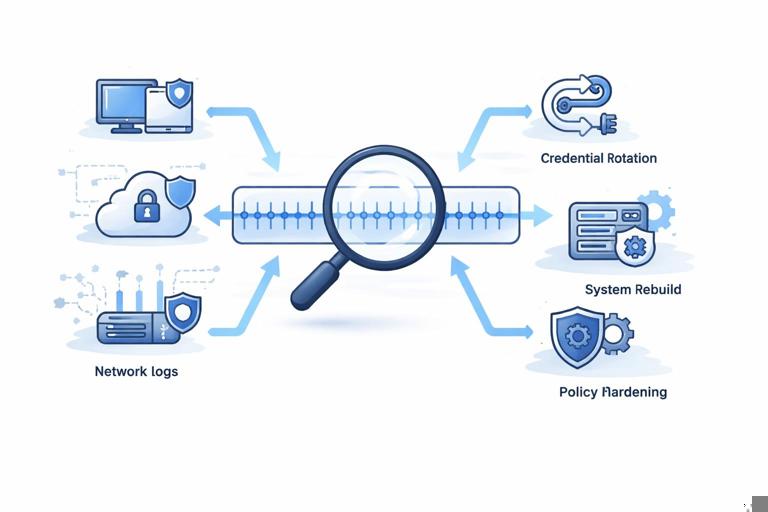
Remediation support: Full forensics should inform durable fixes: which controls failed, which detections were missing, which credentials must be rotated, which systems require rebuild, and which cloud policies must be tightened.

Practical Triage Workflow (Step-by-Step)
Step 1: Define the triage objective and time window
Set a narrow goal: Examples include “Stop ransomware propagation,” “Identify compromised accounts,” or “Find patient zero.” Define an initial time window (e.g., last 24–72 hours) and expand only if needed. This prevents drowning in data and keeps the team aligned.
Step 2: Identify and rank targets
Start with high-signal systems: endpoints that alerted, systems with unusual outbound traffic, servers with exposed services, identity providers, and admin workstations. Rank by business criticality and likelihood of compromise. A simple prioritization list might be: (1) identity systems, (2) admin endpoints, (3) file servers, (4) user endpoints.
Step 3: Collect volatile and high-value live data (where appropriate)
Volatile snapshot: Capture what disappears on reboot: running processes, active network connections, logged-on users, scheduled tasks currently running, and recently executed commands (where available). The goal is to spot active malware, remote shells, or suspicious parent-child process chains.
Example commands (Windows): Use built-in utilities for quick visibility. Keep output redirected to files in a designated collection folder.
tasklist /v > tasklist_v.txt
wmic process get ProcessId,ParentProcessId,Name,CommandLine > processes_cmdline.txt
netstat -ano > netstat_ano.txt
query user > logged_on_users.txt
schtasks /query /fo LIST /v > scheduled_tasks.txt
wevtutil qe Security /q:"*[System[(EventID=4624 or EventID=4625)]]" /f:text /c:200 > auth_recent.txt
What to look for: unusual command lines (encoded PowerShell, LOLBins), processes running from user-writable paths, network connections to rare external IPs, scheduled tasks with odd triggers, and bursts of failed logons followed by success.
Step 4: Pull targeted artifacts for quick analysis
Targeted collection: Instead of collecting everything, pull artifacts that answer your objective. Examples: Windows Event Logs relevant to logon and process creation, browser download history for suspected phishing, RDP logs for lateral movement, and persistence locations (Run keys, services, scheduled tasks).
Example triage checklist (Windows endpoint):
- Security log subset for logons and privilege use (recent)
- System log subset for service installs and shutdowns
- Task Scheduler operational log (if enabled) for task creation/execution
- Windows Defender/AV detections and exclusions
- Autoruns-style persistence locations (keys, startup folders, services)
- Recent file activity in user profile and temp directories
Step 5: Rapid indicator matching and clustering
Cluster by commonality: In triage, you often win by grouping. If five machines share the same suspicious domain, the same scheduled task name, or the same file hash, you can treat them as a cluster for containment and further collection. If only one machine shows the indicator, it may be patient zero or a false positive; either way, it becomes a priority for deeper review.
Practical approach: Build a simple table with columns: Host, User, Indicator type (process/domain/task/file), First seen, Last seen, Confidence, Action (isolate, reset creds, collect more). This becomes your triage map.
Step 6: Decide containment actions based on evidence strength
Evidence-based containment: If you see active C2 connections or credential dumping tools, isolate the host immediately. If you see only a suspicious email attachment but no execution evidence, you might prioritize credential resets and monitoring while you collect more. Triage should explicitly record “why” a containment action was taken (e.g., “host shows active beacon to X and suspicious service Y”).
Step 7: Promote selected systems to full forensics
Promotion criteria: Promote systems that are (a) likely patient zero, (b) show unique or high-impact attacker behavior, (c) contain sensitive data, or (d) are identity/administrative choke points. Also promote any system where triage findings are ambiguous but high risk.
Practical Full Forensics Workflow (Step-by-Step)
Step 1: Define hypotheses and required artifacts
Start with testable hypotheses: For example, “Initial access occurred via malicious LNK delivered by email,” or “Attacker used stolen refresh tokens to access cloud mailboxes.” For each hypothesis, list the artifacts you need (email gateway logs, endpoint execution traces, authentication logs, cloud audit logs, file access logs). This keeps full forensics focused and prevents endless artifact collection.
Step 2: Build a unified timeline across sources
Timeline-first thinking: Full forensics often succeeds by correlating multiple clocks and sources: endpoint logs, server logs, identity provider logs, VPN logs, EDR telemetry, and cloud audit trails. The goal is to place events in order: initial access → execution → persistence → privilege escalation → lateral movement → collection → exfiltration → cleanup.
Practical tip: Normalize timestamps to a single time zone early and record the chosen reference. Track clock drift if you suspect it. Even small inconsistencies can break correlation during detailed reconstruction.
Step 3: Deep-dive on execution and persistence
Execution analysis: Identify how code ran: interactive user execution, service, scheduled task, WMI, PowerShell, or a signed binary abused as a launcher. Extract command lines, parent-child relationships, and execution frequency.
Persistence analysis: Determine exactly what keeps the attacker coming back. For example, a scheduled task may run a script from a network share; a service may point to a renamed binary; a registry Run key may launch a loader. Full forensics should answer: when created, by which account, and what it executed over time.
Step 4: Account and authentication reconstruction
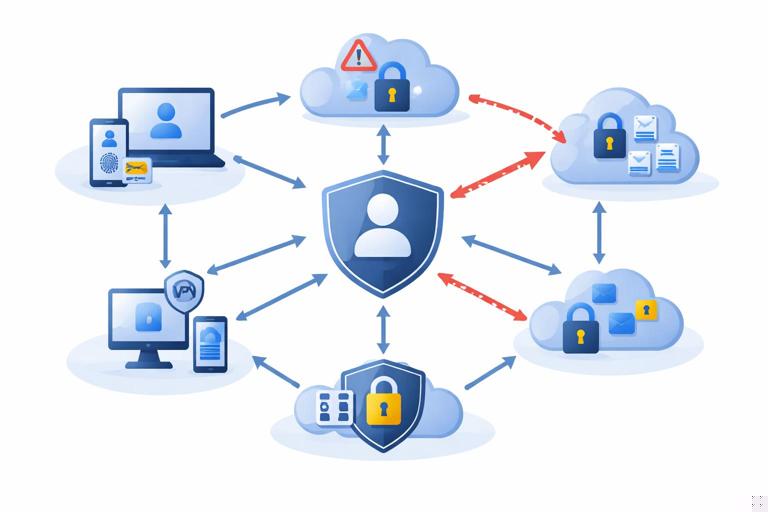
Identity is the backbone: Reconstruct which accounts were used, from where, and with what authentication method (interactive, remote, token-based, service principal). Correlate endpoint logons with identity provider events and VPN/RDP usage. Look for impossible travel, unusual device IDs, new MFA registrations, and suspicious consent grants in cloud apps.

Practical example questions:
- Did the attacker create new accounts or add accounts to privileged groups?
- Were there password resets followed by logons from new IP ranges?
- Were tokens issued to unfamiliar user agents or applications?
Step 5: Data access and exfiltration analysis
Differentiate access vs. exfiltration: Full forensics should separate “files were opened” from “files were copied out.” On endpoints, look for staging directories, archive creation, and large outbound transfers. In cloud, examine audit logs for bulk downloads, mailbox exports, shared link creation, or unusual API calls.
Practical indicators:
- Creation of large archives (ZIP/7z) in temp or user profile paths
- Use of command-line tools for transfer (curl, bitsadmin, rclone)
- Cloud storage share links created and accessed by external identities
- Spikes in egress traffic aligned with staging activity
Step 6: Malware/tooling identification and capability assessment
What the tooling can do matters: Determine whether the observed tools are commodity remote admin tools, credential dumpers, ransomware, or custom loaders. Capability assessment helps you decide remediation scope: a simple web shell may require targeted cleanup; a credential dumper implies broad credential rotation and re-imaging decisions.
Step 7: Validate completeness and identify gaps
Gap analysis: Full forensics should explicitly note what you could not observe (missing logs, retention limits, disabled auditing, overwritten artifacts). Then compensate by pulling alternate sources (EDR telemetry, firewall logs, cloud audit logs, backups of log collectors). This is where full forensics differs from triage: it documents uncertainty and works to reduce it.
Common Pitfalls and How to Avoid Them
Over-triaging: Teams sometimes keep triaging indefinitely, collecting small snapshots from many hosts without ever promoting key systems to deep analysis. Avoid this by setting promotion criteria and a deadline: “Within 8 hours, select 3 systems for full forensics.”
Starting full forensics too broadly: Imaging or deeply analyzing every endpoint immediately can delay containment and overwhelm analysts. Avoid this by using triage to narrow scope and by selecting representative systems.
Confusing alerts with ground truth: An EDR alert may be a symptom, not the cause. Triage should verify whether the alert corresponds to real execution and whether it is part of a larger chain. Full forensics should test alternative explanations (admin scripts, software updates, penetration tests).
Ignoring cloud and identity logs: Modern incidents often pivot through identity and cloud control planes. If you only look at endpoints, you may miss token abuse, mailbox rules, OAuth consent, or API-driven access. Make cloud audit and identity events first-class sources in both triage and full forensics.
Practical Scenario: Ransomware Suspected on a Windows File Server
Triage approach: Your objective is to stop encryption spread and identify the entry point. Start by checking for active encryption processes, unusual CPU/disk usage, and suspicious network connections. Pull recent authentication events to see which accounts accessed the server. Check scheduled tasks and services for newly created entries. Identify whether multiple servers show the same indicators.
Full forensics approach: After containment, reconstruct how the ransomware executed: which account launched it, from which host, and whether a management tool (PsExec, WMI, remote service creation) was used. Correlate file server events with domain authentication patterns and admin workstation activity. Determine whether data was staged or exfiltrated before encryption by looking for archive creation and outbound transfers.

Practical Scenario: Cloud Email Account Compromise (Business Email Compromise)
Triage approach: Your objective is to stop fraudulent activity and prevent further access. Quickly identify suspicious sign-ins, new inbox rules, forwarding addresses, and OAuth app consents. Reset credentials and revoke sessions/tokens as appropriate. Identify other accounts with similar sign-in patterns or shared indicators (IP ranges, user agents, impossible travel).
Full forensics approach: Reconstruct the attacker’s timeline: initial phishing email, credential capture, MFA bypass or token theft, mailbox access patterns, message searches, and outbound fraud communications. Determine whether the attacker accessed sensitive attachments or shared links. Correlate cloud audit events with endpoint activity on the user’s workstation to see whether compromise was purely cloud-based or involved local malware.
Deliverables: What Each Mode Should Produce
Triage deliverables: a prioritized affected-host list, a set of confirmed indicators (processes/domains/tasks/accounts), immediate containment recommendations, and a short incident timeline with “earliest known” and “latest observed” attacker activity. Triage output should be actionable and easy to brief to operations leadership.
Full forensics deliverables: a detailed event timeline, validated root cause and initial access vector (with supporting artifacts), a map of attacker actions and affected identities/systems, an assessment of data access/exfiltration likelihood, and remediation guidance tied to observed techniques (e.g., hardening, monitoring improvements, credential rotation scope).


