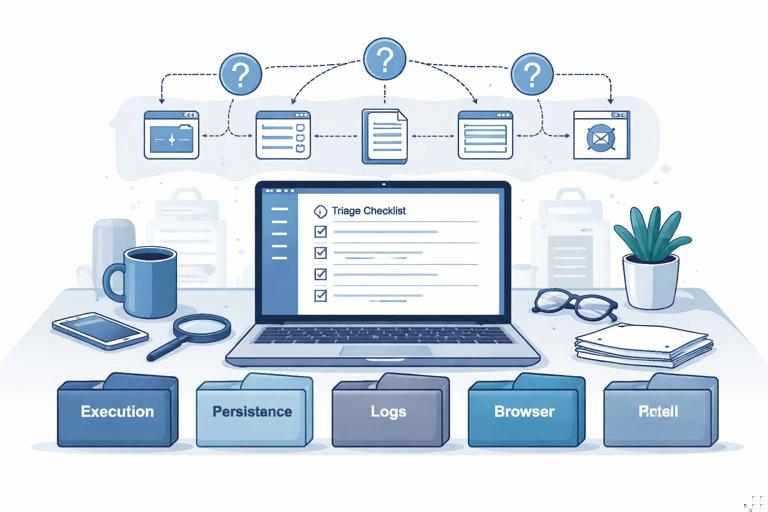
What “Rapid Collection” Means in Practice
Goal and scope: Rapid collection is the disciplined practice of collecting a focused set of high-value artifacts from an endpoint quickly, with minimal disruption, so you can answer time-sensitive questions (for example: “What executed?”, “What persistence exists?”, “What user activity occurred?”, “What network indicators are present?”) without waiting for full-disk acquisition and deep processing.
Why it matters: In many incidents you have limited access windows, remote users, unstable systems, or a need to prioritize containment. Rapid collection aims to capture volatile or easily-changed evidence (logs that roll over, temporary files, browser caches, event logs, registry hives) before it disappears, while still being structured and repeatable.
What it is not: It is not “grab everything.” It is also not a replacement for deeper examination when required. The key is selecting artifacts that are most likely to answer your investigative questions, then collecting them consistently across hosts.
Introducing KAPE: A Practical Rapid-Collection Framework
KAPE overview: KAPE (Kroll Artifact Parser and Extractor) is a Windows-focused triage and artifact collection tool that can (1) collect files and data sources from a system using predefined “Targets,” and (2) optionally run “Modules” to process or parse collected artifacts into analyst-friendly outputs. In many workflows, you use KAPE first to collect, then parse on a separate analysis workstation.
Core idea: KAPE separates “what to collect” (Targets) from “how to process it” (Modules). This separation is useful because you can standardize collection across endpoints while choosing different processing steps depending on the case.
- Listen to the audio with the screen off.
- Earn a certificate upon completion.
- Over 5000 courses for you to explore!

Download the app
Common deployment patterns: You can run KAPE locally on the endpoint (interactive), run it from a removable drive, or run it remotely via administrative tooling (for example, a remote shell or endpoint management platform). Your choice affects speed, permissions, and how you stage output.
Targets vs. Modules: Understanding the Building Blocks
Targets (Artifact Sets to Collect)
Targets define: file paths, glob patterns, and collection rules that tell KAPE what to copy off the system. Targets often include Windows Event Logs, registry hives, browser artifacts, scheduled task definitions, startup folders, prefetch files, and other high-signal sources.
Targeted artifact sets: Instead of running an “everything” target, you select a smaller set aligned to your investigative question. This reduces collection time, reduces storage, and reduces noise.
Modules (Optional Processing)
Modules define: commands or parsers to run against the collected artifacts (or sometimes live artifacts) to produce reports (CSV/JSON/HTML) or normalized outputs. Examples include parsing event logs, extracting browser history, or summarizing persistence locations.
Practical separation: Collect on the endpoint, parse on your workstation. This avoids heavy processing on a potentially fragile system and keeps your endpoint time short.
Planning a Targeted Collection: Start from Questions
Step 1 — Write the questions: Before selecting targets, write the questions you need to answer in the next 30–60 minutes. Examples: “Did a suspicious executable run?”, “Is there evidence of credential theft tooling?”, “What persistence mechanisms exist?”, “Which user account was active?”, “Was there lateral movement?”
Step 2 — Map questions to artifacts: Each question maps to a small set of artifacts. For example: execution evidence often points to Prefetch, Amcache, Shimcache, SRUM, and relevant event logs; persistence points to scheduled tasks, services, Run keys, startup folders, WMI subscriptions; user activity points to user profile artifacts, recent files, jump lists, browser history.
Step 3 — Decide collection depth: For rapid triage, you might collect only the last few days of event logs (if you have a method to filter) or collect the full log files but only parse a time window later. KAPE targets typically copy whole files; time scoping is often applied during parsing/analysis rather than collection.
Step 4 — Decide output structure: Use a consistent naming convention: case ID, host name, date/time, and collector initials. Consistency makes later correlation across multiple endpoints much easier.
Step-by-Step: Running KAPE for Rapid Collection
Scenario: You have a Windows workstation suspected of running a malicious payload. You need quick evidence of execution, persistence, and network-related activity. You will collect targeted artifacts to an external drive or network share.
Step 1 — Prepare a destination folder
Create a destination path that is unique per host. Example structure: \IRShare\KAPE\CASE-2026-001\HOSTNAME\ or E:\KAPE_OUT\CASE-2026-001\HOSTNAME\. Ensure you have enough free space and write permissions.
Step 2 — Launch KAPE with appropriate privileges
KAPE collection typically requires administrative privileges to access protected locations (for example, some registry hives, system logs, and certain directories). Run from an elevated command prompt or PowerShell session where permitted by your process.
Step 3 — Choose a minimal, question-driven Target set
Instead of selecting a broad “all artifacts” target, pick targets aligned to the incident. A common rapid set includes: event logs, registry hives, scheduled tasks, services configuration, prefetch, and key user profile artifacts. The exact target names depend on the KAPE target library you have installed.
Step 4 — Execute collection (example command pattern)
The exact switches can vary by KAPE version, but the typical pattern is: specify the source, the destination, and the target(s). Use a command similar to the following pattern and adapt it to your environment:
kape.exe --tsource C: --tdest E:\KAPE_OUT\CASE-2026-001\HOSTNAME\ --target EventLogs,RegistryHives,Prefetch,ScheduledTasks --vhdx falseNotes: Use --tsource for the system drive, --tdest for output, and --target (or equivalent) for the target list. If your KAPE build uses different parameter names, follow the included help output (kape.exe --help) and keep the same conceptual structure.
Step 5 — Verify output completeness quickly
After collection, do a quick sanity check: confirm that expected directories exist (for example, Windows\System32\winevt\Logs copies, registry hive files, task XML files). Also confirm timestamps and file sizes look plausible. This is not deep validation; it is a rapid “did we get what we intended?” check.
Step 6 — (Optional) Run Modules on a workstation
Copy the collected folder to your analysis machine and run modules there. This keeps endpoint time short and avoids heavy parsing on the suspect system. A typical pattern is to point modules at the collected directory rather than the live system.
kape.exe --msource E:\KAPE_OUT\CASE-2026-001\HOSTNAME\ --mdest E:\KAPE_PARSED\CASE-2026-001\HOSTNAME\ --module !EZParserNotes: Module names vary. The key idea is: --msource is the collected artifact folder, --mdest is where parsed results go, and --module selects parsers. Choose modules that match your questions (event log parsing, persistence summaries, browser parsing) rather than running everything.
Designing Targeted Artifact Sets (Practical Playbooks)
Below are practical “playbooks” you can use to choose targeted artifact sets. Treat them as starting points; adjust based on what you know about the incident and what access you have.
Playbook A — Suspected Malware Execution
Primary questions: What executed? When? Under which user context? From where on disk?
- Prefetch: Helps identify executed binaries and last run times (when enabled).
- Amcache / Shimcache-related artifacts: Useful for program execution traces and file metadata.
- Windows Event Logs: Security, System, Application, and PowerShell logs (if present) for execution and script activity.
- User profile artifacts: Recent files, jump lists, downloads folder metadata, and relevant application logs.
Targeting tip: If time is extremely limited, prioritize event logs + prefetch + key registry hives. You can often answer “what ran” and “what persisted” from those quickly.
Playbook B — Persistence and Autostart Locations
Primary questions: How does it survive reboot? What will re-run?
- Scheduled tasks: Task XML definitions and related logs.
- Services: Service configuration and related registry keys.
- Run keys / startup folders: Common autostart points in registry and file system.
- WMI persistence artifacts: If your target set includes WMI repository or related logs, include them when persistence is suspected.
Targeting tip: Persistence artifacts are relatively small and fast to collect. This is a good “high ROI” set when you need quick containment guidance.
Playbook C — Suspicious PowerShell or Script Activity
Primary questions: Were scripts executed? What commands? Were there downloads or encoded commands?
- PowerShell logs: Operational logs and script block logging (if enabled).
- Windows Event Logs: Security and relevant application logs for process creation events (depending on logging configuration).
- Console history artifacts: If present, collect user console history files.
- Browser and download artifacts: If scripts were fetched from the internet.
Targeting tip: Script evidence can be fragmented. Collect both logs and user artifacts to correlate “command executed” with “file obtained.”
Playbook D — Credential Access and LSASS-Related Suspicion
Primary questions: Is there evidence of credential dumping attempts or suspicious access to authentication components?
- Security event logs: Authentication events, privilege use, and process creation events (if available).
- System event logs: Service installs, driver loads, and system changes.
- Persistence artifacts: Attackers often pair credential access with persistence.
- Relevant application logs: EDR/AV logs if accessible and within scope.
Targeting tip: In rapid collection, you may not capture memory. Focus on logs and persistence indicators that support or refute the suspicion quickly.
How to Customize KAPE Targets Safely (Without Over-Collecting)
Why customize: Default targets can be broad. Custom targets let you collect only what you need (for example, only specific event log channels, only certain user profiles, or only a specific application’s logs).
Approach: Create a case-specific target that includes explicit paths and patterns. Keep it readable and version it with your case notes so you can reproduce the same collection later on another host.
Practical example concept: Suppose you only need Windows Event Logs and scheduled tasks. A custom target might include:
C:\Windows\System32\winevt\Logs\*.evtxC:\Windows\System32\Tasks\*C:\Windows\Tasks\*(legacy)
Common mistake: Adding entire user profile directories. That can explode collection size and time. Instead, target specific sub-artifacts (jump lists, browser history databases, specific app log folders) that answer your question.
Operational Tips for Speed and Consistency

Use a consistent directory layout
Standardize output folders so downstream parsing scripts and analysts can find artifacts quickly. Example: CASE\HOST\COLLECTED\ and CASE\HOST\PARSED\.
Prefer fewer targets over “kitchen sink”
When you collect everything, you slow down the endpoint time and increase analysis backlog. Start small, then expand if the first pass indicates you need more.
Collect from multiple hosts with the same target set
Rapid collection becomes powerful when you can compare across endpoints: same artifacts, same structure, same parsing modules. This supports quick scoping (for example, which hosts show the same scheduled task name or the same suspicious binary in prefetch).
Be mindful of log rollover and retention
Event logs can roll over quickly on busy systems. If you suspect the incident is recent and logs are high volume, prioritize event log collection early in your rapid workflow.
Record environment details that affect interpretation
Some artifacts depend on system settings (for example, Prefetch can be disabled, PowerShell logging may not be enabled). When reviewing results, note whether an artifact is absent because it was not collected, because it does not exist, or because the feature is disabled.
Example Workflow: From Collection to First Findings
Step 1 — Collect targeted artifacts with KAPE: Use a playbook-aligned target set (execution + persistence + logs) and store output per host.
Step 2 — Parse on your workstation: Run modules that generate quick timelines and summaries (event log extraction, persistence enumeration, browser summary if relevant).
Step 3 — Triage the parsed outputs: Look for: unusual scheduled tasks, services with odd binary paths, suspicious parent-child process chains, encoded PowerShell, binaries running from user-writable directories, and repeated authentication failures or new logons.
Step 4 — Decide next collection: If you find a suspicious executable path, run a second targeted collection focused on that directory, related logs, and the specific user profile involved. If you find a persistence mechanism, collect additional artifacts that support attribution of creation time and responsible process (for example, relevant event logs and registry keys).
Troubleshooting Common KAPE Collection Issues
Access denied or missing artifacts
Cause: Insufficient privileges, locked files, or security controls blocking access.
What to do: Re-run with appropriate elevation where permitted, verify the destination is writable, and confirm that security tooling is not quarantining the collector. If certain artifacts remain inaccessible, document which ones and proceed with what you can collect.
Output is unexpectedly large
Cause: Overly broad targets (for example, entire user directories) or collecting large application caches.
What to do: Replace broad targets with narrower ones. Focus on specific databases and log files rather than whole folders.
Collection is slow
Cause: Network destination latency, endpoint disk performance, or too many targets.
What to do: If allowed, collect to a local external drive first, then transfer. Reduce targets to the minimum needed for your current questions.
Parsed results are empty or confusing
Cause: Modules not aligned to collected artifacts, logs not enabled, or time window mismatch.
What to do: Confirm the module expects the artifact type you collected, verify the artifact exists in the collected folder, and adjust your parsing filters/time ranges during analysis.