What “Network Traffic Review” Means in a Beginner Forensics Workflow
Network traffic review is the process of examining communications between systems to understand what happened, when it happened, and which hosts, users, or applications were involved. In practical investigations, you rarely “read every packet.” Instead, you use tools like Wireshark to quickly answer focused questions: Which endpoints talked to each other? What protocols were used? Was there suspicious DNS activity? Did a host connect to an unusual IP or domain? Was data exfiltration likely (large outbound transfers)?
Traffic review can be done on packet captures (PCAP/PCAPNG files) collected from a span port, a network tap, an endpoint capture tool, or a cloud workload capture. It can also be done indirectly using logs (firewall, proxy, DNS resolver logs, VPN logs, web server logs). Packet data is the most detailed view, while logs are typically higher-level summaries. A practical approach is to use both: use logs to identify “where to look,” then use packet captures to validate and deepen the story.
Wireshark Essentials: What You Need to Know Before You Click
Packets, Frames, Streams, and Conversations
Wireshark displays captured frames (Layer 2) that contain packets (Layer 3) and segments (Layer 4). For investigations, you often care about “conversations” (who talked to whom) and “streams” (a reconstructed TCP session). A single user action (opening a website) can generate many connections: DNS queries, TLS handshakes, HTTP requests, and background calls to analytics or CDNs.
Capture Filters vs Display Filters
Wireshark has two filtering concepts. Capture filters (based on libpcap syntax) reduce what gets recorded, for example capturing only traffic to a suspect host. Display filters (Wireshark syntax) filter what you see after capture, for example showing only DNS or only traffic from a specific IP. In forensics, you often receive an existing PCAP, so display filters are used heavily.
- Capture filter example (record only traffic to/from 10.0.0.25):
host 10.0.0.25 - Display filter example (show only DNS):
dns - Display filter example (show only traffic involving 10.0.0.25):
ip.addr == 10.0.0.25
Time: Relative, Absolute, and “What Did the User Do First?”
Time interpretation is central to traffic review. Wireshark can show absolute timestamps (as captured) or relative time (time since the beginning of the capture). Relative time is useful for reconstructing sequences: DNS query, TCP handshake, TLS handshake, application request. Absolute time is useful for correlating with other sources like firewall logs or endpoint timestamps. In Wireshark, you can change time display format and set a reference packet to measure deltas from a key event.
- Listen to the audio with the screen off.
- Earn a certificate upon completion.
- Over 5000 courses for you to explore!

Download the app
Step-by-Step: A Practical Wireshark Triage Workflow
Step 1: Open the Capture and Get Oriented
Open the PCAP/PCAPNG in Wireshark and immediately check basic context: capture duration, number of packets, and which protocols are present. Use Statistics menus to avoid manual scrolling. Start with Statistics → Protocol Hierarchy to see the protocol breakdown (DNS, HTTP, TLS, SMB, RDP, etc.). If you see unexpected protocols for the environment (for example, SMB over the internet, or lots of ICMP), that is a clue to investigate.
Step 2: Identify the Key Hosts (Top Talkers)
Use Statistics → Conversations and Statistics → Endpoints. Sort by bytes to find large transfers and by packets to find chatty hosts. In many incidents, one internal host stands out by contacting many external IPs or sending unusually high outbound bytes.
Practical questions to answer here: Which internal IPs are most active? Which external IPs are contacted? Are there repeated connections to a small set of external addresses (possible command-and-control)? Is there a single large outbound transfer (possible exfiltration)?
Step 3: Narrow the View with Display Filters
Once you have a suspect internal IP (example: 10.0.0.25), filter on it and then pivot by protocol. Common starter filters include:
- All traffic involving a host:
ip.addr == 10.0.0.25 - Outbound connections from a host:
ip.src == 10.0.0.25 - DNS queries from a host:
dns && ip.src == 10.0.0.25 - HTTP only:
http - TLS only (common for HTTPS):
tls - Filter by TCP port (example 443):
tcp.port == 443 - Filter by SNI (Server Name Indication) in TLS ClientHello:
tls.handshake.extensions_server_name contains "example"
Filtering is iterative. You start broad (host), then narrow (protocol), then narrow again (domain, IP, port, method, URI, or certificate fields).
Step 4: Review DNS to Build a Domain Timeline
DNS is often the best “index” of what a host attempted to reach. Filter on DNS and inspect queries and responses. Look for unusual domains, high volumes of random-looking subdomains (possible DNS tunneling), and short TTL values. In Wireshark, you can right-click a DNS query and follow related packets, or export DNS information using built-in statistics.
Useful DNS display filters:
- All DNS queries:
dns.flags.response == 0 - All DNS responses:
dns.flags.response == 1 - Queries for a specific name:
dns.qry.name == "suspicious.example" - Show only NXDOMAIN (failed lookups):
dns.flags.rcode == 3
Practical interpretation example: If you see a burst of NXDOMAIN responses for many similar-looking subdomains, it can indicate a domain generation algorithm or misconfigured malware beaconing. If you see a single domain resolved to many IPs, it may be a CDN, but it can also be fast-flux behavior depending on patterns and context.
Step 5: Inspect HTTP When It Exists (Cleartext or Decrypted)
If the capture includes HTTP (not HTTPS), you can often see full URLs, headers, and sometimes payloads. Use Follow → HTTP Stream to reconstruct a request/response conversation. Look for suspicious user agents, unusual POST destinations, or downloads of executables and scripts.
Helpful HTTP filters:
- Requests only:
http.request - POST requests:
http.request.method == "POST" - Specific host header:
http.host contains "example" - Potential file download extensions in URI:
http.request.uri contains ".exe" || http.request.uri contains ".ps1" || http.request.uri contains ".zip"
Even when traffic is encrypted (HTTPS), you may still get value from metadata: destination IP, port, timing, and TLS handshake fields like SNI and certificate subject/issuer. If you have lawful access to session keys (for example, from a test environment or a controlled endpoint), Wireshark can decrypt TLS, but in many real investigations you will not have that.
Step 6: Use TLS Handshake Metadata for Encrypted Traffic
For HTTPS-heavy environments, focus on TLS handshake artifacts: SNI (requested hostname), ALPN (negotiated application protocol like h2), certificate details, and JA3/JA4-style fingerprinting concepts (Wireshark can show handshake parameters even if it doesn’t compute all fingerprints by default). A common workflow is: identify suspicious external IPs from conversations, then check whether the TLS handshake indicates a domain name that matches expectations.

Practical TLS checks:
- Filter for ClientHello packets (where SNI appears):
tls.handshake.type == 1 - Show packets with SNI present:
tls.handshake.extensions_server_name - Inspect certificate packets (when present):
tls.handshake.type == 11
Interpretation example: If a workstation that normally talks to Microsoft 365 and common SaaS suddenly shows repeated TLS connections with SNI to a newly registered-looking domain, that is a lead. If SNI is absent and the destination is a raw IP on 443, that can also be suspicious (not always—some services do this—but it reduces transparency).
Step 7: Follow TCP Streams and Look for Transfer Patterns
Use Follow → TCP Stream to reconstruct a session. For encrypted streams, the payload will be unreadable, but you can still observe session behavior: repeated short beacons, long-lived connections, or large bursts of data. Combine this with Statistics → IO Graphs to visualize spikes in traffic. A sudden outbound spike from a single host can indicate upload or exfiltration, while repeated periodic small connections can indicate beaconing.
Useful filters for stream work:
- Show a specific TCP stream number (after selecting a packet in that stream):
tcp.stream == 7 - Show retransmissions (can indicate instability or scanning side effects):
tcp.analysis.retransmission - Show SYN packets (connection attempts):
tcp.flags.syn == 1 && tcp.flags.ack == 0
Step 8: Spot Scanning and Lateral Movement Indicators
Network scanning often produces many connection attempts to many ports or many hosts. In Wireshark, scanning can show as repeated SYNs, many RSTs, or many ICMP unreachable messages, depending on the environment. Lateral movement in Windows-heavy networks may involve SMB (445), RPC (135), WinRM (5985/5986), RDP (3389), or remote service creation patterns. Packet captures alone may not prove authentication success, but they can show attempts and targets.
Practical filters:
- SMB traffic:
smb2 || smb - RDP traffic:
tcp.port == 3389 - WinRM traffic:
tcp.port == 5985 || tcp.port == 5986 - Many SYNs from one source (start point for scan review):
tcp.flags.syn == 1 && tcp.flags.ack == 0 && ip.src == 10.0.0.25
Exporting and Reporting from Wireshark (Practical Outputs)
Export Objects and Reconstructed Data
When HTTP is present, Wireshark can export transferred objects via File → Export Objects → HTTP. This can recover downloaded files or images. Treat exported objects as investigative artifacts: record which stream and packet range they came from, and keep the original PCAP as the primary source. For other protocols, “Follow Stream” output can be saved as text for notes, but remember it is a derived view of the capture.
Export Packet Dissections for Sharing
To share findings with teammates, you can export packet details as CSV or text. Commonly, you export a filtered view (for example, only DNS queries from a suspect host) and include columns like time, source, destination, protocol, and info. This is especially useful when you need to align packet evidence with log evidence.
Simple Log Analysis: Turning “Noisy Text” into Answers
What Logs Can Tell You (Even Without Packets)
Logs summarize activity and often persist longer than packet captures. For network investigations, the most useful “simple” logs include firewall allow/deny logs, proxy logs, DNS resolver logs, VPN logs, and web server access logs. They can answer: which internal IP connected to which external IP and port, which domain was requested, which URL was accessed, how many bytes were transferred, and whether access was blocked.
Because log formats vary, the goal is to normalize them into a few common fields: timestamp, source IP/user, destination IP/domain, destination port/protocol, action (allowed/blocked), bytes in/out, and an identifier (rule name, policy, request ID). Once you have those, you can sort, group, and filter effectively.
Step-by-Step: A Minimal, Repeatable Log Triage Method
Step 1: Confirm the time window and timezone. Before analysis, identify the log timezone and whether timestamps are local time or UTC. If you are correlating multiple sources, convert them to a single reference timezone for your working notes.
Step 2: Reduce to relevant records. Filter by suspect host (source IP), suspect user (if present), or suspect destination (domain/IP). If you do not have a suspect yet, start with outliers: highest bytes out, rare destinations, denied bursts, or unusual ports.
Step 3: Group and count. Count connections by destination IP/domain, by port, and by time bucket (for example, per minute). This quickly reveals beaconing (regular intervals) or scanning (many destinations/ports in a short time).
Step 4: Pivot from domain to IP and back. DNS logs map domains to IPs at a point in time; firewall logs show IP connections. Use DNS to explain what an IP might represent, and use firewall logs to show whether the connection actually occurred and how much data moved.
Step 5: Extract a small “evidence slice.” Save the subset of log lines that support your key claims (for example, the first time a domain was queried, the first successful connection to its IP, and the largest outbound transfer). Keep the slice small and clearly tied to your narrative.
Practical Examples of “Simple” Analysis Using Common Tools
Below are examples using command-line tools that are commonly available. Adjust field positions and separators to match your log format.
Example: Quickly Find Top Destination IPs in a Firewall Log
Assume a simple space-delimited firewall log where fields include timestamp, src_ip, dst_ip, dst_port, action, bytes_out. To count top destination IPs for a suspect source:
grep " src=10.0.0.25 " firewall.log | awk -F'dst=' '{print $2}' | awk '{print $1}' | sort | uniq -c | sort -nr | headInterpretation: a small number of destination IPs with very high counts can indicate beaconing or a heavily used service. Many destination IPs with low counts can indicate scanning or a browser-heavy session. Always validate by checking ports and timing.
Example: Identify High Outbound Bytes (Potential Exfil Candidates)
If the log includes bytes_out, you can sort to find the largest transfers. For a CSV log with a bytes_out column (example column 8):
awk -F',' 'NR>1 {print $8 "," $0}' firewall.csv | sort -t',' -nr | headInterpretation: large outbound transfers to uncommon destinations are worth deeper review. Large transfers to common cloud storage may be normal, so compare against known baselines when possible.
Example: Detect Regular Beaconing Patterns
Beaconing often shows as repeated connections at consistent intervals. A simple approach is to extract timestamps for a given destination and inspect spacing. If timestamps are ISO-like and the destination is in the line:
grep "dst=203.0.113.50" firewall.log | awk '{print $1" "$2}' | head -n 50Then manually check if the times occur every 60 seconds, 5 minutes, etc. For more structure, bucket by minute:
grep "dst=203.0.113.50" firewall.log | awk '{print substr($1,1,16)}' | sort | uniq -cInterpretation: consistent counts per minute over long periods can indicate automated activity rather than human browsing.
Example: Simple DNS Log Review for Suspicious Domains
DNS logs often include query name and response code. To find NXDOMAIN-heavy activity for a host:
grep "client=10.0.0.25" dns.log | grep "rcode=NXDOMAIN" | awk -F'query=' '{print $2}' | awk '{print $1}' | sort | uniq -c | sort -nr | headInterpretation: many failed lookups for similar-looking domains can indicate algorithmic generation or misconfigured malware. Validate by checking whether successful lookups also occur and whether the domains are newly seen in your environment.
Correlating Wireshark Findings with Logs (A Practical Mini-Playbook)
Build a Shared Timeline Key
Pick a small set of anchor events that appear in both packets and logs: a DNS query for a domain, a TCP connection to the resolved IP, and a large data transfer time window. Convert timestamps to the same timezone and record them as a short table in your notes (time, source, destination, protocol, evidence source).
Validate “What the Domain Was” vs “Where the IP Went”
In packet captures, you might see a TLS connection to an IP with SNI indicating a hostname. In firewall logs, you might only see the IP. Use DNS logs (or Wireshark DNS) to map the hostname to the IP at that time. Be careful: CDNs and shared hosting mean many domains can share IPs, and DNS answers can change quickly. Your goal is to show that, at the relevant time, the suspect host resolved a domain and then connected to the resulting IP.
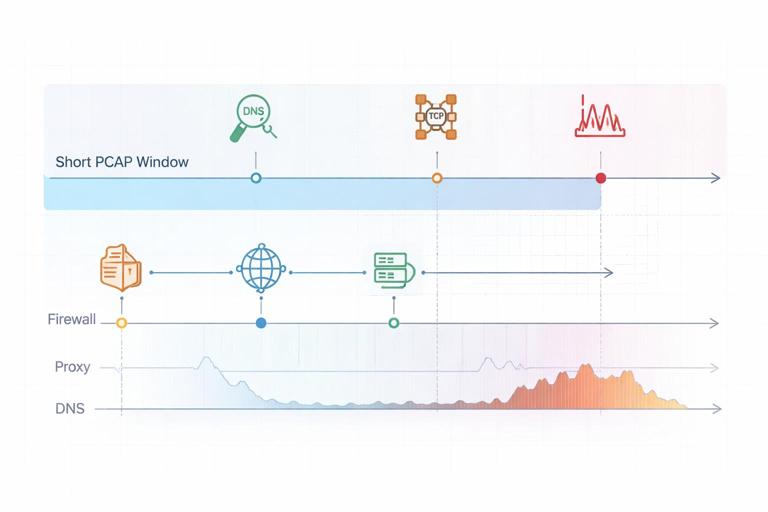
Use Logs to Extend Beyond the PCAP Window
Packet captures are often short. If the PCAP shows suspicious activity at 14:03, use firewall/proxy/DNS logs to check whether the same destination appears earlier or later. This helps you determine whether the event was a one-time occurrence or part of a longer pattern.
Common Pitfalls and How to Avoid Them
Assuming an IP Equals a Single Service
Many services share IPs (CDNs, cloud providers). Treat IP reputation carefully and prefer domain/SNI/certificate context when available. If you only have an IP, look for supporting evidence: consistent SNI, consistent DNS answers, or proxy logs with hostnames.
Over-Interpreting Encrypted Payloads
With TLS, you usually cannot see content. Focus on what you can reliably support: endpoints, timing, frequency, and volume. Avoid claiming “data theft” purely from “large outbound bytes” without additional context such as destination type, user behavior, or corroborating artifacts.
Ignoring NAT and Proxies
In many networks, multiple internal hosts share a single public IP via NAT, and web traffic may traverse a proxy. Ensure you are using the correct internal identifiers (source IP, proxy-auth user, device name fields in logs) so you do not misattribute activity.
Not Checking for Packet Loss or Capture Limits
PCAPs can be truncated, filtered, or dropped due to capture performance. If you see incomplete handshakes, missing DNS, or gaps, consider whether the capture point missed traffic. Use Wireshark expert info and capture statistics when available, and corroborate with logs.