What Autopsy and The Sleuth Kit Do in a Workflow
Goal and scope: Autopsy is a graphical case management and analysis interface built on top of The Sleuth Kit (TSK). TSK provides the low-level parsing and assumptions about disk images, partitions, file systems, and many artifact types; Autopsy orchestrates those capabilities into a repeatable workflow: ingest evidence, run modules, review results, pivot, and report.
How to think about “workflow”: In Autopsy/TSK, a workflow is not a single button that “finds the answer.” It is a sequence of decisions: what data sources to add, which ingest modules to run, how to validate what you see, and how to record and export findings. The same evidence can produce different results depending on module selection, keyword lists, time zone settings, and how you interpret artifacts.
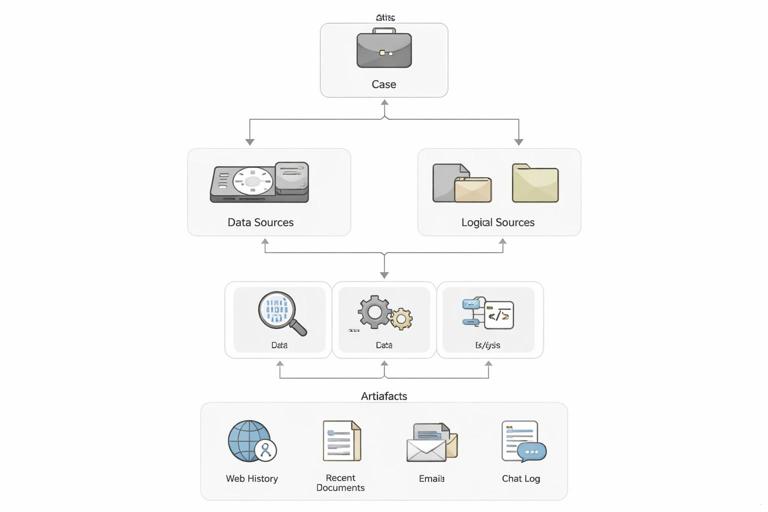
Key objects you will work with: A Case contains one or more Data Sources (disk image, logical files, etc.). Autopsy creates derived artifacts (e.g., web history entries, installed programs, recent documents) and indexes content for search. TSK under the hood reads file system structures, recovers deleted files, and exposes metadata such as timestamps and file paths.
Planning the Analysis: Define Questions and Map to Autopsy Features
Start with questions, not tools: Before clicking “Next,” translate your investigative questions into Autopsy tasks. Examples: “What files were created or copied in a date range?” maps to Timeline and Recent Activity. “Did the user search for or open specific terms?” maps to Keyword Search and Indexed Text. “Is there evidence of external storage usage?” maps to Recent Activity and device-related artifacts (depending on OS artifacts present in the image).
Choose the right data source type: Autopsy supports disk images and also “Logical Files” (a folder of collected files). A disk image gives you file system metadata and deleted file recovery. A logical set is faster but may miss deleted content and some metadata. Your workflow should explicitly note what you are analyzing so you interpret gaps correctly (e.g., “no deleted files found” is meaningless if you only had logical files).
- Listen to the audio with the screen off.
- Earn a certificate upon completion.
- Over 5000 courses for you to explore!

Download the app
Set analysis parameters early: Two settings commonly affect interpretation: time zone and whether you will index file content. Time zone impacts timeline ordering; indexing impacts keyword search completeness and speed. Decide these at case setup so your later screenshots and exports align with your narrative.
Creating a Case and Adding a Data Source (Step-by-Step)
Step 1 — Create a new case: In Autopsy, create a case with a descriptive name and a dedicated case directory on a drive with enough free space. Autopsy will store databases, indexes, and extracted artifacts; this can grow significantly beyond the size of “interesting” results.
Step 2 — Add a data source: Use Add Data Source and select the correct type (e.g., Disk Image or VM file, Logical Files). Provide the path to the image or folder. If you have multiple images (e.g., system drive and external drive), add them as separate data sources so you can filter results by source later.
Step 3 — Configure ingest modules: Autopsy will prompt you to select ingest modules. Treat this as your “analysis recipe.” A common beginner-friendly approach is to start broad (recent activity, web artifacts, installed programs, file type identification, keyword indexing) and then narrow with targeted keyword lists and file filters once you see what’s present.
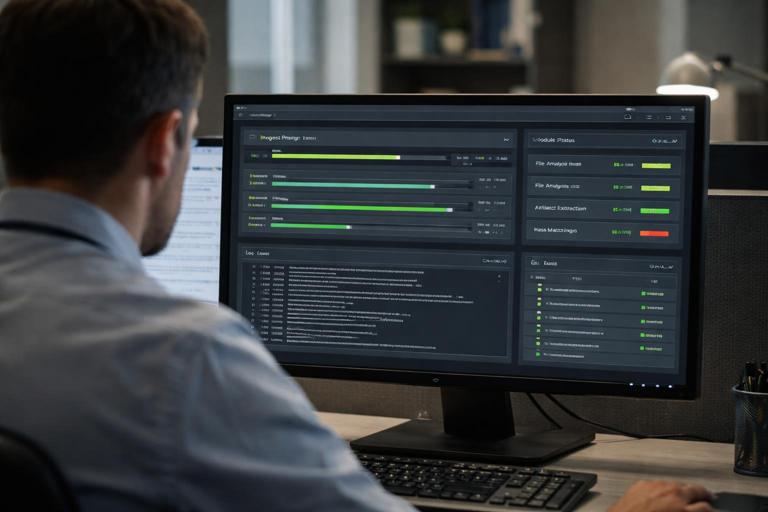
Step 4 — Run ingest and monitor: Ingest can take minutes to hours. Watch the ingest messages for errors (e.g., “cannot parse” or “unsupported file system”). If a module fails, note it and consider rerunning ingest with adjusted settings or a different module set.
Understanding Ingest Modules and What They Produce
Ingest modules are not “magic,” they are parsers: Each module looks for specific structures and patterns. For example, a web artifacts module parses known browser databases; a recent activity module parses OS-specific artifacts; an EXIF module reads metadata from media files. If the artifact format is missing, encrypted, corrupted, or from an unsupported version, the module may produce partial or no results.
File type identification and extension mismatch: Enable file type identification so Autopsy can detect files whose extensions do not match their signatures. This is useful for spotting renamed archives, disguised executables, or documents with misleading extensions. Treat mismatches as leads: verify by opening in a safe viewer or exporting for deeper analysis.
Hash set and known files (operational use): Even if you are not focusing on integrity concepts here, operationally, known-file filtering helps reduce noise. Autopsy can mark common OS files as “known” so you can focus on user-created and unusual files. Use this to prioritize review rather than as a sole decision-maker.
Navigating Results: A Practical Review Order
Use a repeatable review order: To avoid missing categories, adopt a consistent order: (1) ingest messages and errors, (2) data source summary, (3) notable results, (4) timeline, (5) keyword hits, (6) file system review (including deleted), (7) correlation and tagging, (8) exports and report. This order helps you quickly detect whether the evidence supports your initial questions.
Start with “Notable Results” carefully: Autopsy can flag items as notable based on rules (e.g., keywords, file types, blacklists). Notable results are a triage aid, not proof. Always pivot from a notable item to its context: where it came from, what user account it relates to, and what other artifacts corroborate it.
Use the “Results” and “Artifacts” views: Autopsy organizes parsed items under artifact categories (web history, recent documents, installed programs, etc.). When you click an artifact, inspect the raw fields (URL, title, timestamp, source file). Then locate the underlying source file in the file tree to understand provenance (e.g., which database file produced the record).
Timeline Analysis in Autopsy (Step-by-Step)
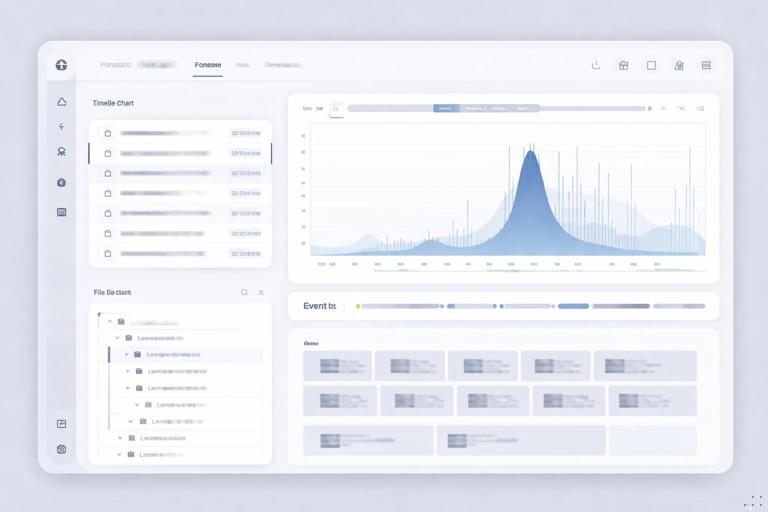
Step 1 — Open the Timeline: After ingest, open the Timeline view. Confirm the time zone setting and understand what timestamps are being plotted (file system MAC times, artifact times, application times). Different sources can disagree; your job is to interpret them, not force them to match.
Step 2 — Filter by data source and user paths: Start by filtering to user profile directories (e.g., Users\<name> on Windows) or other relevant folders. This reduces noise from OS background activity.
Step 3 — Narrow by event type: Use filters for file created/modified/accessed, web visits, downloads, and other artifact types available. If you are investigating a suspected exfiltration window, narrow to that date range and look for clusters: new archives created, USB-related artifacts, or large file copy patterns (as reflected by file creation/modification and presence in user folders).
Step 4 — Pivot from a spike to the file: When you see a spike (many file events in a short period), click into the event list, identify the top file paths, and pivot to the file tree. Check parent directories and neighboring files created around the same time. This is often more productive than reviewing isolated single events.
Step 5 — Validate with multiple sources: If a timeline suggests “file created at 10:32,” corroborate with other artifacts when you can (application logs, document metadata, or related shortcut artifacts if present). Autopsy’s strength is letting you pivot quickly between these sources.
Keyword Search and Indexing: Getting Useful Hits
Indexed vs. literal search: Autopsy supports indexed keyword search (fast, broad) and literal search (slower, exact). Indexed search depends on what content was indexed and which file types were parsed. Literal search can find strings in unindexed areas but may take much longer.
Build keyword lists that reflect behavior: Instead of only searching for company names, include operational terms: project code names, file naming conventions, internal system URLs, competitor names, “invoice,” “wire,” “password,” “2fa,” or specific file extensions (e.g., “.pst”, “.kdbx”). Keep separate lists for “high confidence” terms (unique identifiers) and “broad” terms (likely to produce noise).
Step-by-step keyword workflow: (1) Run an indexed search with high-confidence terms. (2) Tag the strongest hits. (3) Pivot to the source file and surrounding directory. (4) Expand with broader terms once you understand the user’s naming patterns. (5) Use regular expressions when appropriate (e.g., to find structured IDs or email patterns).
File System Review: Where Autopsy/TSK Shine
Deleted files and unallocated space: TSK can enumerate deleted directory entries and, depending on file system behavior, recover file content. In Autopsy, review deleted files in the file tree and pay attention to whether content is intact or partially overwritten. Treat recovered content as potentially incomplete and validate by opening and checking internal structure (e.g., does a presumed ZIP open cleanly?).
Sorting and filtering for prioritization: Use filters for file size, extension, and “recently modified” to find likely user data. Large archives, databases, and document collections are common containers for evidence. Also look for unusual locations (e.g., user temp folders, application data folders) where staged data may be stored.
Extension mismatch and embedded containers: When Autopsy flags a mismatch (e.g., a “.jpg” that is actually a ZIP), treat it as a lead. Export the file and analyze it with appropriate tools outside Autopsy if needed. Autopsy can also carve and parse some embedded content, but you should not assume it will automatically unpack every container format.
Using Autopsy Tags, Bookmarks, and Notes to Build a Defensible Narrative
Tagging as you go: Autopsy allows you to tag files and artifacts. Use a small, consistent tag taxonomy such as: “Credential-related,” “Data staging,” “Exfil candidate,” “Execution indicator,” “Benign/Noise,” and “Needs follow-up.” This prevents re-review and helps you produce a coherent report later.
Notes should capture context, not just facts: When you add a note, include: what it is, why it matters, and what you did to validate it. Example: “Chrome History entry shows upload to example.com at 14:05; corroborated by download of archive ‘Q4_finance.zip’ created 13:58 in Documents; source DB: History.” This style makes later reporting faster and more accurate.
Bookmark the source, not only the artifact: If you bookmark only an artifact row, you may lose context if you later need to show the underlying database file or the file path. Bookmark both the artifact and the source file when possible.
Deepening Analysis with The Sleuth Kit (TSK) Command Line
Why use TSK directly: Autopsy is convenient, but TSK command-line tools help you validate findings, troubleshoot parsing issues, and extract specific data precisely. This is especially useful when Autopsy’s UI hides details or when you need repeatable commands for documentation.
Common TSK tools and what they answer:
- mmls: Identify partitions/volumes and their offsets within an image.
- fsstat: Summarize file system details (type, block size, features).
- fls: List files and directories, including deleted entries.
- icat: Extract file content by inode/MFT entry (useful for deleted files).
- tsk_recover: Bulk recover files from a file system, including deleted where possible.
- blkls: Extract unallocated blocks (for carving workflows).
Step-by-step: Identify the right partition with mmls
Use case: You have a full disk image and need the correct partition offset for other commands.
mmls disk.E01Review the output for the partition that contains the file system you want (e.g., NTFS). Note the Start sector. Many TSK tools accept an offset via -o in sectors (not bytes). If your image is raw (dd), the same approach applies; for E01, ensure your TSK build supports it or use a converted/raw image as needed.
Step-by-step: Confirm file system details with fsstat
Use case: Validate what Autopsy thinks the file system is and capture parameters that affect interpretation.
fsstat -o 2048 disk.ddCheck file system type, cluster size, and timestamp behavior notes. If fsstat fails, you may have the wrong offset or a damaged/unsupported file system.
Step-by-step: List and extract a file with fls and icat
Use case: Autopsy shows a deleted file, but you want to extract it in a controlled way and verify it independently.
fls -o 2048 -r disk.dd | grep -i "Q4_finance"The output includes an identifier (inode/MFT entry). Use that identifier with icat:
icat -o 2048 disk.dd 12345 > Q4_finance.zipNow you can test whether the extracted file is structurally valid (e.g., does the ZIP open?) and compare it with what Autopsy previewed.
Cross-Checking Autopsy Findings: Practical Validation Patterns
Pattern 1 — Artifact row to source database: When Autopsy shows a web visit, locate the underlying browser database file in the file tree and export it. If needed, open it with a SQLite viewer to confirm the record exists and to see related fields Autopsy may not display (e.g., visit counts, transition types).
Pattern 2 — Timeline event to file metadata: When a timeline shows a file “created,” open the file’s metadata view and compare timestamps. If there is a discrepancy, note which timestamp the timeline used and whether the event came from file system metadata or an application artifact.
Pattern 3 — Keyword hit to surrounding context: A keyword hit inside a large file can be misleading (e.g., cached fragments). Export the file and confirm the term is in meaningful context. If the hit is in unallocated space or a carved fragment, treat it as an indicator that requires corroboration, not a standalone fact.
Handling Common Pitfalls in Autopsy/TSK Workflows
Ingest module overload: Running every module on every data source can create long processing times and a flood of low-value artifacts. A practical approach is two-pass ingest: first pass with core modules to map the case, second pass with targeted modules and keyword lists based on what you learned.
Time confusion: Mixed timestamp sources and time zone mismatches can create apparent contradictions. Record the configured time zone and be explicit about which artifact produced which timestamp. When in doubt, export the artifact source and verify raw values.
Encrypted containers and locked profiles: Autopsy may detect encrypted volumes or protected browser stores but cannot always decrypt them without keys. Your workflow should include a decision point: if encryption is present, identify what is encrypted, what is still visible (metadata, file names, container presence), and what additional material would be required to proceed (keys, passwords, live acquisition artifacts).
Interpreting absence: “No results” can mean the artifact does not exist, the module does not support the version, the data source is incomplete, or the user used alternative applications. Treat absence as a hypothesis to test by checking module logs, verifying source files exist, and searching for alternative locations or formats.
Exporting and Reporting from Autopsy Without Losing Traceability
Export with context: When you export a file or artifact, capture its path, data source, and the artifact type that led you to it. Autopsy can generate reports and also allows CSV exports for certain views. Prefer exports that preserve identifiers and source references so you can later explain “how you got it.”
Use case reports as structured output: Autopsy’s report generation can include tagged items, notable items, and selected artifacts. A practical workflow is to tag continuously during analysis, then generate a report that includes only tagged items. This keeps the report focused and reduces the chance of omitting a key item you already identified.
Keep screenshots purposeful: If you capture screenshots, include the panel that shows the artifact fields and the panel that shows the source path. A screenshot of a single row without provenance is hard to defend and hard to interpret later.