Why “Tables + Single Source of Truth” Matters in Operations
Operational dashboards and trackers fail most often for two reasons: the data structure is inconsistent, and the same metric is calculated differently in different places. Structuring your raw data as Excel Tables and then building a single, governed dataset (a “single source of truth”) solves both problems. A Table enforces consistent columns, expands automatically, and provides stable references. A single source of truth (SSOT) ensures every report, pivot, and chart pulls from the same cleaned, standardized dataset with the same business rules.
In an operations context, SSOT means that “On-Time Delivery,” “Cycle Time,” “Backlog,” “First Pass Yield,” or “Open Tickets” are defined once, computed once, and reused everywhere. When someone asks, “Why does your dashboard show 92% on-time but my report shows 89%?”, the answer should not be “because we used different formulas.” The goal is to make that mismatch impossible.
What Excel Tables Actually Give You (Beyond Formatting)
1) A stable schema: consistent columns and names
An Excel Table is a structured range with named columns. Instead of referencing A:A or A2:A5000, you reference columns by name, such as Orders[Ship Date]. This is more readable and less error-prone, especially when columns move or new columns are inserted.
2) Automatic expansion
When new rows are appended, the Table expands automatically. Any formulas, data validation, conditional formatting, PivotTables, and Power Query connections can be designed to pick up new rows without manual range edits.
3) Structured references that reduce formula errors
Structured references help prevent common mistakes like off-by-one ranges, missing new rows, or copying formulas incorrectly. For example, a calculated column in a Table automatically fills down for new records.
- Listen to the audio with the screen off.
- Earn a certificate upon completion.
- Over 5000 courses for you to explore!

Download the app
4) A natural boundary between raw data and derived outputs
Operations workbooks often mix raw exports, calculations, and dashboards on the same sheet. Tables make it easier to separate “inputs” (raw data tables) from “outputs” (summaries, pivots, charts). This separation is a prerequisite for a SSOT approach.
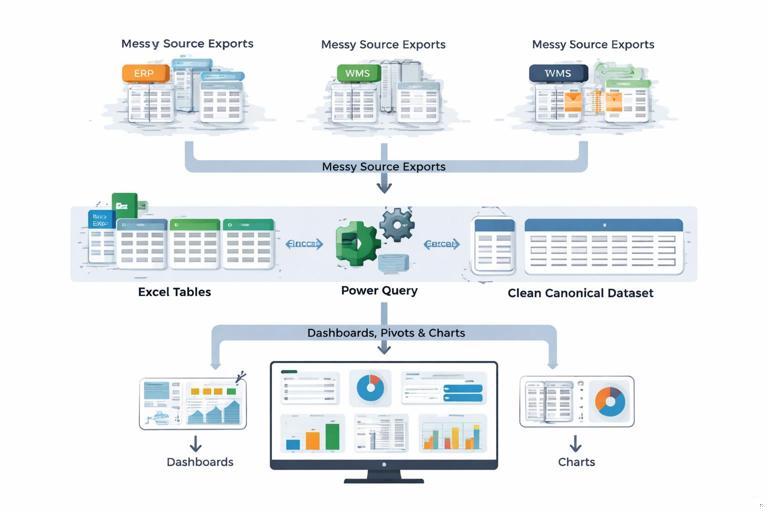
Defining “Single Source of Truth” in an Excel + Power Query Workflow
In this course context, SSOT is not a buzzword; it is a specific pattern:
Raw tables: one Table per source (ERP export, WMS export, ticketing export, manual log). These are append-only or refreshed exports. Minimal or no formulas.
Transform layer (Power Query): standardize column names, data types, keys, and business rules; remove duplicates; create consistent dimensions (e.g., Site, Product Family, Customer Tier).
Canonical dataset: one “gold” table (loaded to a Table or the Data Model) that every PivotTable and dashboard uses.
Consumption layer: pivots, measures, charts, KPI cards, and trackers that reference only the canonical dataset, not the raw tables.
The SSOT is the canonical dataset plus the documented rules that create it. If you have multiple “final” datasets (e.g., one for finance, one for ops) that disagree, you do not have SSOT—you have parallel truths.
Step-by-Step: Convert Operational Data into Excel Tables
Step 1: Start with a clean header row
Before converting to a Table, ensure the first row is a single header row with unique names. Avoid merged cells and multi-line headers like “Ship Date (UTC)” on one line and “Confirmed” on another. If your export has title rows above the headers, delete them or move them elsewhere.
Step 2: Remove blank rows and blank columns inside the dataset
Blank rows inside a dataset break many downstream processes. If you need visual separation, use formatting outside the dataset, not blank rows within it.
Step 3: Convert to a Table
Select any cell in the dataset and use Insert > Table (or Ctrl+T). Confirm “My table has headers.”
Step 4: Name the Table intentionally
In Table Design, set a meaningful name. Use a consistent naming convention that signals source and grain. Examples:
tblOrders_Raw(order line grain)tblShipments_Raw(shipment grain)tblTickets_Raw(ticket grain)tblCalendar(date dimension)
Avoid spaces and special characters. Consistent naming makes Power Query and formulas easier to maintain.
Step 5: Confirm each column has one meaning and one data type
Operations exports often mix types (e.g., “N/A” in a numeric column). Decide what the column represents and enforce it. If a column is numeric, keep it numeric; represent missing values as blanks, not text like “-” or “N/A”. If you must keep the original, create a cleaned column in Power Query later.
Designing Raw Tables for SSOT: Practical Rules
Rule A: Keep raw tables “raw”
Raw tables should be as close to the source export as possible. Avoid adding manual calculations that might be overwritten on refresh or copied inconsistently. If you must add a manual field (e.g., “Root Cause”), add it as a separate table keyed by an ID, not as a column inside the raw export that gets replaced.
Rule B: One record per row (define the grain)
Every SSOT starts by defining the grain: what does one row represent? In operations, common grains include:
One row per order line
One row per shipment
One row per production batch
One row per ticket
If a row sometimes represents an order header and sometimes an order line, your metrics will break. Decide the grain and reshape data in Power Query if needed.
Rule C: Ensure a unique key exists (or can be created)
A SSOT needs stable identifiers. Examples:
OrderLineID(preferred) or a composite key likeOrderID+LineNumberTicketIDShipmentID
If the source lacks a unique key, create one consistently in Power Query (for example, by concatenating fields). Avoid using row numbers as keys because they change when data is filtered or sorted.
Rule D: Separate facts from dimensions
Facts are events or measurements (quantity, duration, status at a point in time). Dimensions are descriptive attributes (site, customer, product family). In Excel, you can keep them together in one canonical table, but you still need to think in these terms to avoid duplicated attributes and inconsistent mapping. Often, you will maintain small dimension tables (e.g., a site mapping table) and merge them in Power Query.
Building the Canonical Dataset with Power Query (SSOT Layer)
Once your raw data is in Tables, Power Query becomes the transformation engine that produces the SSOT. The canonical dataset is the output query that loads to a Table (or Data Model) and is used everywhere.
Step-by-step example: Orders SSOT from a raw export
Assume you have tblOrders_Raw with columns: Order ID, Line, Customer, Site, Order Date, Requested Ship Date, Actual Ship Date, Qty, Status.
Step 1: Load the Table into Power Query
Use Data > From Table/Range. In Power Query, immediately rename the query to something like qOrders_Raw.
Step 2: Standardize column names
Rename columns to a consistent naming style (e.g., PascalCase without spaces): OrderID, LineNumber, CustomerName, SiteCode, OrderDate, ReqShipDate, ActShipDate, Quantity, Status. This reduces friction when merging and when building measures later.
Step 3: Set data types early
Explicitly set types: dates as Date, quantities as Whole Number/Decimal, IDs as Text (often safest), and status as Text. Type errors are a major source of silent miscalculations (e.g., dates treated as text won’t sort or filter correctly).
Step 4: Create or validate the unique key
Create a key column OrderLineKey by combining OrderID and LineNumber. In Power Query you can add a custom column such as:
= [OrderID] & "-" & Text.From([LineNumber])This key becomes the anchor for merges, de-duplication, and manual annotations.
Step 5: Remove duplicates intentionally
If your export can contain duplicates (common when pulling “open orders” repeatedly), decide the rule: keep the latest record by update timestamp, or keep the record with the most complete ship date. Do not “Remove Duplicates” blindly without defining which record should win.
Step 6: Add standardized business-rule columns
Instead of calculating KPIs in multiple dashboards, add them once in the canonical dataset. Examples:
OnTimeFlag: 1 if
ActShipDateis not null andActShipDate<=ReqShipDate, else 0.LateDays: if shipped late, difference in days; else 0.
OpenFlag: 1 if
Statusindicates open/backorder, else 0.
These columns become reusable building blocks for pivots and measures. The key is that the logic is defined once.
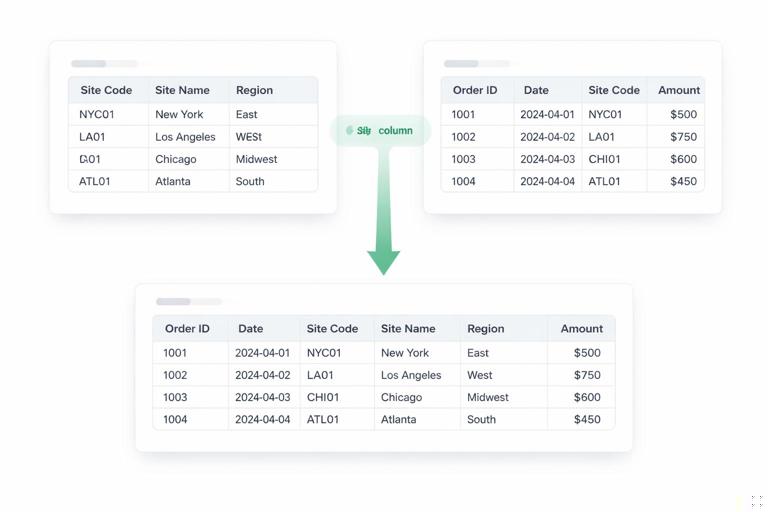
Step 7: Merge in mapping tables (dimensions)
Operations data often needs standardization: site codes, customer tiers, product families, carrier categories. Maintain small mapping tables as Excel Tables, for example tblSiteMap with SiteCode and SiteName, or tblCustomerTier with CustomerName and Tier. Load them into Power Query and use Merge Queries to enrich the dataset.
This avoids hardcoding logic like “if Site begins with X then Region = East” across multiple reports. Put the mapping in one place, merge it, and every report inherits the same classification.
Step 8: Output the canonical dataset
Create a final query named qOrders_Canonical that references the cleaned steps and loads to a worksheet Table named tblOrders_Canonical (or load to the Data Model if you are building model-based dashboards). Every PivotTable, chart, and KPI should reference this canonical output, not tblOrders_Raw.
Practical Pattern: SSOT for Multiple Sources (Append + Standardize)
Many operations teams have the same “entity” coming from different sites or systems. For example, tickets from two helpdesk tools, or shipments from multiple carriers. A SSOT approach standardizes each source to the same schema and then appends them.
Step-by-step: Standardize then append
1) Create one raw table per source:
tblTickets_Raw_SystemA,tblTickets_Raw_SystemB.2) Build one query per source:
qTickets_SystemA_CleanandqTickets_SystemB_Clean. In each, rename columns to the same target names (e.g.,TicketID,CreatedDate,ClosedDate,Status,Priority,SiteCode).3) Add missing columns: if System B lacks
Priority, add it as null so schemas match.4) Append queries: use Append Queries to create
qTickets_Canonical.5) Add a Source column: include
SourceSystemso you can filter and troubleshoot.
The key SSOT principle here is that the append happens after standardization, not before. If you append mismatched schemas, you get sparse columns and inconsistent meanings.
Making Tables “Dashboard-Ready”: Columns to Include for Operational Analysis
A canonical dataset should be analysis-ready. That typically means including:
Identifiers: stable keys (e.g.,
OrderLineKey,TicketID).Dates: event dates (created, promised, shipped, closed) as true Date/DateTime types.
Status fields: standardized statuses (avoid dozens of near-duplicates like “Closed”, “closed”, “CLOSED”).
Numeric measures: quantities, durations, cost, backlog age.
Derived flags: on-time, open/closed, SLA met, exception flags.
Dimensions: site, region, product family, customer tier, owner/team.
When these are present and standardized, building dashboards becomes mostly a matter of selecting fields, not inventing new calculations each time.
Common Failure Modes (and How Tables + SSOT Prevent Them)
Failure mode 1: “My pivot didn’t include the new rows”
This happens when a PivotTable is built on a fixed range. When the source is an Excel Table (or a query output Table), the pivot source expands automatically on refresh.
Failure mode 2: “We changed the definition of on-time delivery”
If on-time is calculated in multiple sheets, you will have multiple definitions. Put the rule in the canonical dataset (Power Query column or a single measure) and reuse it everywhere.
Failure mode 3: “Someone inserted a column and broke formulas”
Structured references are resilient to column insertion and movement. =[@Quantity]*[@UnitCost] remains correct even if columns move.
Failure mode 4: “The dashboard is slow and fragile”
SSOT reduces repeated calculations and reduces the number of places where logic is duplicated. Power Query transformations are applied once per refresh rather than recalculated across many sheets.
Hands-On: Build a Minimal SSOT in One Workbook
Scenario
You track daily shipments and want a dashboard showing on-time rate by site and week. You receive a daily export and paste it into Excel.
Step 1: Create the raw table
Paste the export into a dedicated sheet and convert it to a Table named tblShipments_Raw. Ensure headers are unique and there are no blank rows.
Step 2: Create a calendar table (if you don’t already have one)
Create a Table named tblCalendar with a continuous list of dates and columns like Year, Month, WeekStart, ISOWeek. This enables consistent weekly reporting. Keep it as a controlled dimension table rather than deriving week logic differently in each report.
Step 3: Transform shipments into canonical form in Power Query
Load tblShipments_Raw into Power Query as qShipments_Raw. Apply:
Rename columns to standard names
Set data types
Create
ShipmentKeyif neededCreate
OnTimeFlagbased on promised vs actual dateStandardize
SiteCodevia a mapping table merge if necessary
Load the final query as tblShipments_Canonical.
Step 4: Build the dashboard only from the canonical table
Create PivotTables using tblShipments_Canonical and join to tblCalendar (via relationships if using the Data Model, or by merging calendar attributes into the canonical table in Power Query). The dashboard should never point to tblShipments_Raw.

Governance: Keeping the SSOT Trustworthy Over Time
Document the rules where they live
SSOT is only as reliable as its definitions. Maintain a small “Data Dictionary” table (also an Excel Table) listing key fields and definitions: what counts as on-time, how backlog age is calculated, what statuses are considered “open,” and how exceptions are handled. This is not about writing long documentation; it is about making the rules explicit so they can be reviewed and changed intentionally.
Control manual inputs via separate tables
If operations needs human classification (root cause, escalation reason, corrective action), store it in a separate Table keyed by the unique ID (e.g., tblOrderAnnotations with OrderLineKey and RootCause). Merge it into the canonical dataset in Power Query. This prevents refreshes from wiping out manual work and keeps the SSOT consistent.
Use consistent naming across layers
Adopt a simple convention:
tbl*for Excel Tablesq*for Power Query queries*_Raw,*_Clean,*_Canonicalsuffixes to indicate maturity
This makes it obvious which object is safe to use for reporting and which is not.
Example: Structured References You’ll Reuse in Operational Tables
When you do need worksheet formulas in a Table (for example, in a small helper table or a manual log), structured references reduce errors. Examples:
=IF([@ActShipDate]="","Open","Shipped")=IF([@ActShipDate]="","",MAX(0,[@ActShipDate]-[@ReqShipDate]))=XLOOKUP([@SiteCode],tblSiteMap[SiteCode],tblSiteMap[SiteName],"Unknown")Even if you later move these rules into Power Query for stronger governance, these examples show how Tables make logic readable and resilient.