What scheduling and SLA tracking tools do in operations
Scheduling and SLA (Service Level Agreement) tracking tools answer two operational questions continuously: (1) What work should happen next, and in what order? (2) Are we meeting the promised time-to-complete, and if not, where is the delay happening? In Excel, an error-proof approach means you are not just listing tasks—you are building a system that timestamps key events, calculates elapsed time in a consistent way, compares it to targets, and surfaces bottlenecks early enough to act.
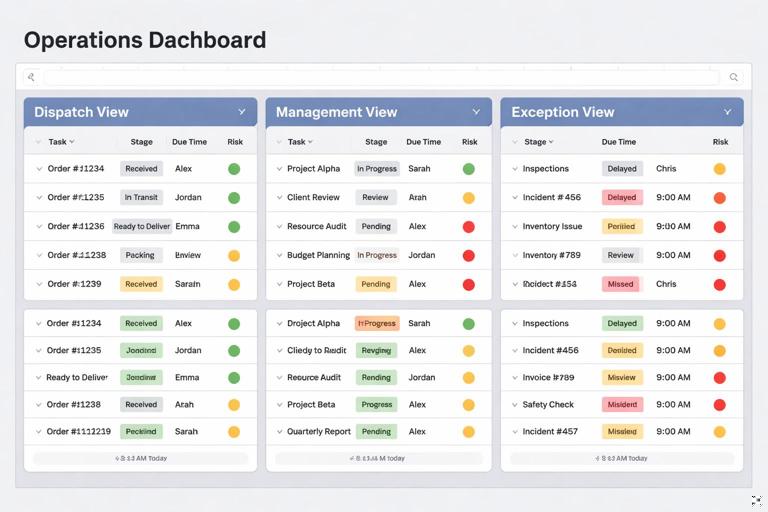
A practical scheduling and SLA workbook typically has three outputs used by different roles: a dispatch view (what to do next), a management view (SLA performance and aging), and an exception view (what is stuck, why, and who owns it). The key is to model work as items that move through stages, each stage having an owner, a start time, an end time, and a target duration. Once you have stage timing, bottlenecks become measurable: you can see which stage accumulates the most waiting time, which owner has the most overdue items, and which work type consistently breaches SLA.
Define the SLA model: clock rules, targets, and breach logic
1) Choose the time clock: calendar hours vs business hours
Before building calculations, define the clock that the SLA uses. Many operational SLAs are measured in business hours (e.g., 8:00–17:00, Monday–Friday), while others are calendar hours (24/7). This choice affects every metric and must be consistent across the dashboard.
- Calendar-hours SLA: elapsed time is simply End − Start.
- Business-hours SLA: elapsed time excludes nights, weekends, and sometimes holidays. This requires a working-hours function and a holiday calendar.
Even if your operation is 24/7, you may still want a “business-hours view” for staffing decisions. Keep both if needed, but label them clearly and do not mix them in the same KPI.
2) Define SLA targets at the right level
Targets can be defined per work type (e.g., “Standard order: 24h”, “Expedite: 4h”), per customer tier, per site, or per stage. Decide which is operationally actionable. A common pattern is:
- Listen to the audio with the screen off.
- Earn a certificate upon completion.
- Over 5000 courses for you to explore!

Download the app
- Overall SLA target for the full cycle (Created → Completed).
- Stage targets for internal control (e.g., Triage ≤ 1h, Pick ≤ 6h, QA ≤ 2h).
Stage targets are what surface bottlenecks. Overall targets tell you whether customers are impacted. Use both: stage targets to manage flow, overall targets to report service.
3) Define breach logic and status categories
To drive action, don’t just compute “minutes late.” Categorize items into operational statuses that match escalation rules. Example categories:
- On Track: remaining time is comfortably positive.
- At Risk: remaining time is low (e.g., < 20% of target remaining).
- Breached: elapsed time > target.
- Paused: SLA clock stopped due to customer hold, missing info, or approved exception.
“Paused” is critical; otherwise, teams will game the system or the dashboard will accuse the process unfairly. Pauses must be explicit events with start and end timestamps.
Data structure for scheduling and SLA tracking
To surface bottlenecks, you need event-level data (timestamps) rather than only current status. A minimal, scalable structure uses two datasets:
- Work Items (one row per ticket/order/job): ID, Work Type, Priority, Customer, Created DateTime, Due DateTime (if promised), Current Stage, Current Owner, Current Status, etc.
- Stage Events (many rows per work item): Work Item ID, Stage Name, Event Type (Start/End/PauseStart/PauseEnd), Event DateTime, Owner, Notes/Reason.
The Work Items table supports dispatching and filtering. The Stage Events table supports timing, bottleneck analysis, and auditability. If you only store “Entered Stage at” and “Left Stage at” in the Work Items table, you lose history when a job loops back or changes owners. Event logs preserve reality.
Build stage durations and waiting time from event logs (Power Query pattern)
This section focuses on a repeatable approach to transform Stage Events into a stage-duration fact table that can be summarized by stage, owner, work type, and date. The goal is a table like: Work Item ID, Stage, Stage Start, Stage End, Active Minutes, Paused Minutes, Total Minutes, Breach Flag.
Step-by-step: create a stage interval table
Step 1: Load Stage Events and enforce data types. In Power Query, ensure Event DateTime is a Date/Time type and Stage Name / Event Type are text. Remove blank IDs and obvious errors (e.g., missing timestamps).
Step 2: Sort events within each Work Item + Stage. Sort by Work Item ID, Stage Name, Event DateTime ascending. This is essential before pairing starts and ends.
Step 3: Group by Work Item ID + Stage Name. Use Group By with “All Rows” to create a nested table per stage instance. If stages can repeat (e.g., QA twice), add a Stage Instance number. A practical way is to create an index within each Work Item ID + Stage Name group and then derive an instance counter based on Start events. If your process is strictly linear (each stage once), you can skip instance handling.
Step 4: Pair Start and End events. Within each grouped nested table, identify the first Start and the first End after it. If your log uses “Entered” and “Exited” instead, map them to Start/End. If End is missing (work in progress), use the refresh time as a temporary end for “current aging” calculations, but keep a flag like IsOpenStage = true.
Step 5: Handle pauses explicitly. If you log PauseStart and PauseEnd, compute paused intervals inside the stage window and subtract them from active time. If pause end is missing, treat it as paused until refresh time (and flag it).
Step 6: Output one row per stage interval. Expand the grouped results into a flat table with Stage Start, Stage End, Active Duration, Paused Duration, Total Duration, and flags (Open, PausedNow, MissingEnd, etc.).
Step 7: Join SLA targets. Merge with an SLA Targets table keyed by Work Type + Stage (or just Stage). Add Target Minutes and compute Stage Breach = Active Minutes > Target Minutes (or Total Minutes if SLA counts waiting).
This interval table becomes the backbone for bottleneck detection because it allows you to aggregate “where time is spent” rather than “how many items exist.”
Practical M pattern (illustrative)
The exact M code depends on your event schema, but the pattern below shows the idea of grouping and extracting timestamps. Adapt field names to your data.
let Source = Excel.CurrentWorkbook(){[Name="StageEvents"]}[Content], Typed = Table.TransformColumnTypes(Source,{{"WorkItemID", type text},{"Stage", type text},{"EventType", type text},{"EventDT", type datetime},{"Owner", type text}}), Sorted = Table.Sort(Typed,{{"WorkItemID", Order.Ascending},{"Stage", Order.Ascending},{"EventDT", Order.Ascending}}), Grouped = Table.Group(Sorted,{"WorkItemID","Stage"},{{"Events", each _, type table}}), AddStart = Table.AddColumn(Grouped,"StageStart", each try Table.SelectRows([Events], (r)=>r[EventType]="Start"){0}[EventDT] otherwise null, type datetime), AddEnd = Table.AddColumn(AddStart,"StageEnd", each let ends = Table.SelectRows([Events], (r)=>r[EventType]="End") in try ends{0}[EventDT] otherwise null, type datetime), AddTotalMin = Table.AddColumn(AddEnd,"TotalMinutes", each if [StageStart]=null then null else Duration.TotalMinutes((if [StageEnd]=null then DateTime.LocalNow() else [StageEnd]) - [StageStart]), type number), Output = Table.RemoveColumns(AddTotalMin,{"Events"}) in OutputThis example ignores pauses and assumes one Start/End per stage. In real operations, you will extend it to compute paused minutes and to handle repeated stages. The key takeaway is that Power Query is used to produce a clean, analysis-ready interval table, so your dashboard layer stays simple and reliable.
Scheduling views that drive daily execution
A scheduling tool in Excel should not be a static list. It should prioritize work based on due times, SLA risk, dependencies, and capacity. The scheduling view is typically a filtered table or pivot-based list that answers: “What should each person/team work on next?”
Priority rules that avoid hidden bottlenecks
Define a deterministic priority score so the schedule is explainable and consistent. Common components:
- Due proximity: items due sooner rise to the top.
- SLA risk: items with low remaining time rise to the top.
- Work type / customer tier: contractual priorities override FIFO.
- Blocking dependencies: items waiting on upstream steps should not clog the queue; instead, surface them in an exception list.
Keep the score transparent: show the fields used to compute it (due time, remaining minutes, priority class). If the team can’t explain why an item is ranked above another, the schedule will be ignored.
Step-by-step: build a dispatch list that stays stable during refresh
Step 1: Create a “Now” timestamp at refresh. In Power Query, add a column RefreshDT = DateTime.LocalNow() so all calculations in that refresh use the same time reference. This prevents items from reordering mid-review due to volatile NOW() changes.
Step 2: Compute Remaining Minutes to SLA. In the interval table or in a merged work-item view, compute Remaining = Target − Elapsed (or Target − Active). If you track both stage SLA and overall SLA, compute both and decide which drives dispatch.
Step 3: Assign a risk band. Example: Breached (Remaining < 0), Critical (0–30 min), Warning (30–120 min), On Track (>120 min). Use consistent thresholds per work type if targets vary widely.
Step 4: Create a priority score. A simple approach is to map risk bands to weights and add due proximity. Example: Score = RiskWeight*100000 + MinutesToDue. Lower score = higher priority.
Step 5: Build role-based queues. Filter by Stage and Owner Team. Provide separate views: “Triage Queue,” “Pick Queue,” “QA Queue,” etc. Bottlenecks are often stage-specific, so mixing stages hides the problem.
Step 6: Add a capacity hint. Include columns like Estimated Minutes or Standard Handling Time (SHT). This allows a supervisor to see whether the queue is feasible for the shift. If you don’t have estimates, start with simple averages by work type and refine later.
SLA tracking metrics that reveal bottlenecks (not just performance)
Many dashboards stop at “% within SLA.” That is a lagging metric. To surface bottlenecks, you need leading indicators and flow metrics that explain why SLA is at risk.
Core metrics to include
- Backlog by stage: count of open items currently in each stage.
- Aging by stage: median and 90th percentile active minutes in stage for open items.
- Throughput: items completed per day/week by stage (or overall).
- WIP (work in progress): number of items being actively worked vs waiting.
- Queue time vs touch time: waiting time is often the bottleneck; separate it from active handling time.
- Rework/loop rate: items that revisit a stage (e.g., QA fail) create hidden load.
Backlog alone can mislead: a stage may have a small backlog but very high aging (few items stuck for a long time). Conversely, a stage may have a large backlog but low aging (high throughput). Pair backlog and aging to see true constraints.
How to compute queue time vs touch time
To separate waiting from working, you need either (a) explicit “In Progress” timestamps, or (b) a proxy such as “Assigned” vs “Completed.” A robust event model uses:
- Stage Start (entered stage)
- Work Start (someone begins work)
- Work End (work finished)
- Stage End (left stage)
Then:
- Queue time = Work Start − Stage Start
- Touch time = Work End − Work Start
- Post-work wait = Stage End − Work End (e.g., waiting for pickup, batching, approvals)
If you cannot capture Work Start/End, start with Stage Start/End and treat the full duration as “stage time.” You can still identify bottlenecks, but you won’t know whether they are staffing (touch time) or handoff delays (queue time).
Bottleneck surfacing patterns: what to show and how to trigger action
1) Bottleneck heatmap by stage and day
Create a matrix where rows are stages and columns are dates (or shifts). Values can be median stage minutes, 90th percentile minutes, or breach rate. A heatmap makes it obvious when a stage becomes constrained (e.g., QA spikes every Monday due to weekend accumulation).
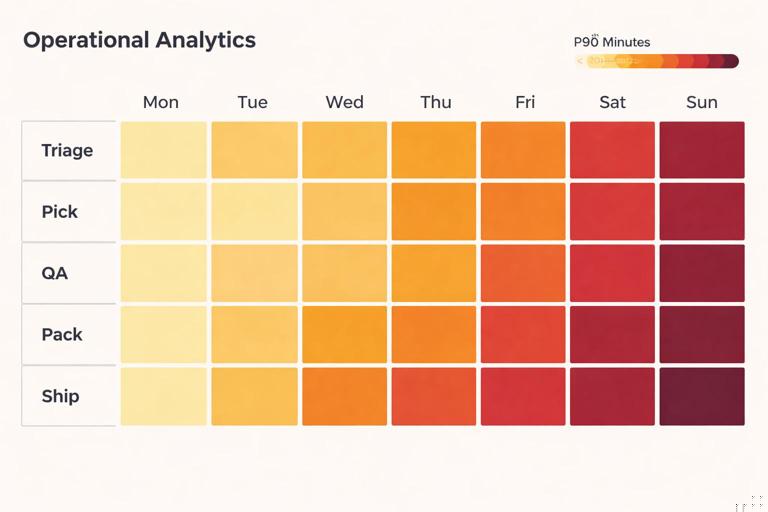
Use 90th percentile (P90) to detect “tail pain.” Median can look fine while a subset of items is severely delayed.
2) “Top stuck items” exception list
Provide a list of the top N items by:
- Most overdue vs SLA
- Longest time in current stage
- Longest time paused (to audit whether pauses are legitimate)
Include columns that enable immediate escalation: current owner, stage, last event time, pause reason, and next required action. The list should be filterable by team and stage so each supervisor sees their actionable set.
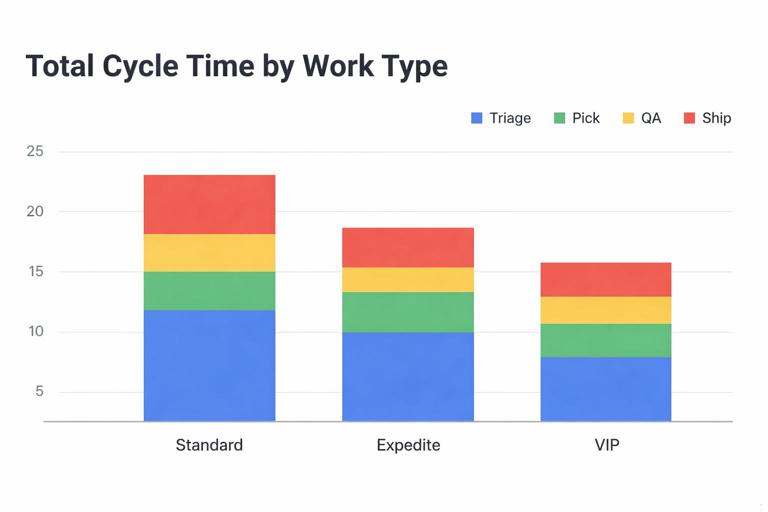
3) Bottleneck attribution: stage share of total cycle time
For completed items, compute each stage’s share of total cycle time. If one stage consistently consumes the largest share, it is the constraint. This is more informative than raw minutes because it normalizes across work types with different total durations.
A practical view is a stacked bar by work type: each bar is total cycle time, segmented by stage. This reveals whether bottlenecks differ by product/service line.
4) Arrival vs completion (flow balance)
To predict future SLA breaches, compare arrivals to completions. If arrivals exceed completions for several days, backlog will grow and aging will rise. Build a simple daily chart:
- Arrivals: count of items created per day
- Completions: count of items completed per day
- Net change: arrivals − completions
When net change stays positive, you have a capacity shortfall or a process disruption. Pair this with stage-level backlog to locate where the shortfall is occurring.
Business-hours SLA calculations (operationally realistic timing)
If your SLA is measured in business hours, you need a consistent way to compute working-time durations. In Excel, this is often implemented with a working-hours calendar table that lists each date and the working start/end times, plus a holiday flag. Power Query can also generate a calendar table and mark working days.
Step-by-step: implement business-hours elapsed time
Step 1: Create a Calendar table. Include Date, IsWorkday, WorkStartTime, WorkEndTime. Add holidays as non-workdays or shortened days if applicable.
Step 2: Convert each stage interval into working minutes. For each interval (Stage Start to Stage End), compute overlap with each workday’s working window. This can be done in Power Query by expanding each interval into the list of dates it spans, joining to Calendar, and summing overlaps.
Step 3: Store both metrics. Keep TotalMinutes (calendar) and WorkMinutes (business). Use WorkMinutes for SLA if that is the contractual definition, but keep TotalMinutes for operational reality (e.g., weekend backlog effects).
Step 4: Ensure pauses follow the same clock. If an item is paused, subtract paused working minutes from working SLA elapsed, not paused calendar minutes. Otherwise, pauses spanning weekends will distort results.
This approach is more complex than calendar time, but it prevents false breach flags and makes the dashboard credible to the teams using it.
Escalation rules and SLA governance inside the tool
Dashboards surface problems; governance ensures problems get acted on. Build escalation rules into the tracking tool so it becomes a management system, not just reporting.
Operational escalation fields
- Escalation Level: None, Supervisor, Manager, Customer Comms.
- Escalation Trigger: At Risk threshold, Breach, Aging threshold, VIP customer.
- Escalation Time: timestamp when it entered escalation.
- Escalation Owner: who is responsible for resolution.
These fields allow you to measure not only SLA breaches but also responsiveness to risk. For example, you can track “time from At Risk to first action” as a process health metric.
Pause reasons and auditability
Require a standardized pause reason list (e.g., Waiting on Customer, Missing Info, Vendor Delay, System Outage, Approved Exception). Then report pause minutes by reason. If “Waiting on Customer” dominates, the bottleneck may be upstream data quality or intake forms. If “System Outage” appears, the bottleneck is not staffing.
Common failure modes and how to design around them
Failure mode: SLA breaches caused by missing timestamps
If Stage End is missing, items can appear infinitely late. Mitigation: treat missing end as “open” and compute aging to RefreshDT, but separate open vs closed metrics. For SLA compliance reporting, only use closed items or explicitly define how open items are counted.
Failure mode: bottlenecks hidden by averaging
Average duration can look acceptable while a subset is severely delayed. Mitigation: use median and P90, plus a “count over threshold” metric (e.g., # items in stage > 8 hours).
Failure mode: teams ignore the schedule because it conflicts with reality
If the dispatch list doesn’t reflect constraints (dependencies, batching, skill requirements), it will be bypassed. Mitigation: add fields for required skill, dependency status, and batch group, then filter or rank accordingly. Keep the schedule aligned with how work is actually executed.
Failure mode: gaming via pauses
If pausing stops the SLA clock, teams may overuse it. Mitigation: require pause reasons, track pause frequency and duration by owner/team, and include “paused share of cycle time” in management reporting.
Practical build checklist for an SLA + scheduling workbook
- Event capture: confirm you can record Start/End (and ideally Work Start/End and Pause Start/End) with timestamps.
- Interval table: build a Power Query output with one row per stage interval and clean duration fields.
- Targets: maintain an SLA Targets table keyed by work type and stage.
- Risk bands: compute Remaining Minutes and assign On Track/At Risk/Breached/Paused.
- Dispatch views: create stage-specific queues with deterministic priority ranking.
- Bottleneck visuals: stage heatmap (P90), backlog by stage, and top stuck items list.
- Governance: escalation fields and pause reasons with reporting by owner and reason.
- Clock definition: implement calendar vs business-hours consistently and label KPIs clearly.