What a “process tracker” is in operations (and why it’s different from a dashboard)
A process tracker is a working system for capturing, updating, and auditing operational events over time: receipts, issues, approvals, work orders, inspections, vendor confirmations, and exceptions. Unlike a dashboard (which summarizes), a tracker is the operational record. It must support three realities: (1) entries arrive continuously, (2) statuses change, and (3) people need to trust the history when something goes wrong.
In Excel, the most reliable trackers behave like lightweight databases: each row is a single event or a single “thing” (an item, a purchase order line, a work order), and changes are recorded in a controlled way. The goal is not to build the most complex workbook; it’s to build a tracker that prevents common failure modes: duplicate records, missing timestamps, ambiguous statuses, overwritten values, and totals that don’t reconcile.
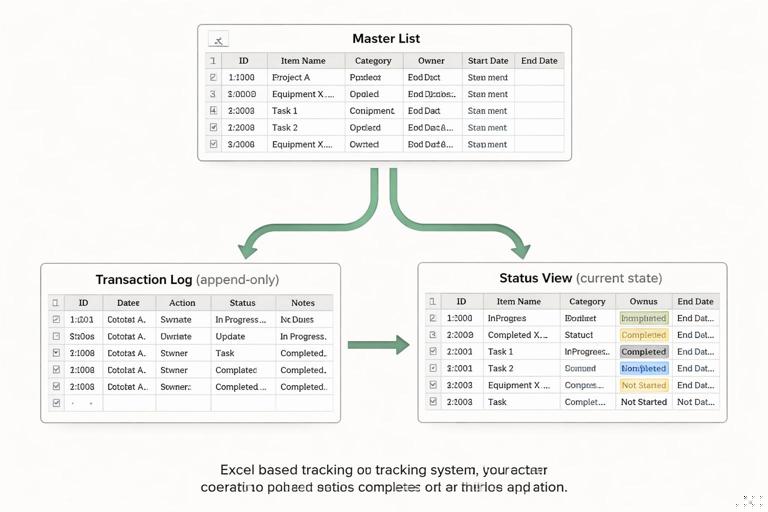
Core design pattern: master list + transaction log + status view
Most operational trackers become error-prone when they try to do everything in one table. A more robust pattern is to separate:
Master list: stable attributes of an entity (SKU description, unit of measure, min/max levels; vendor master; asset register).
Transaction log: time-stamped events (inventory movements, PO status changes, maintenance actions). This is append-only whenever possible.
Continue in our app.- Listen to the audio with the screen off.
- Earn a certificate upon completion.
- Over 5000 courses for you to explore!

Download the app
Status view: a calculated or query-built “current state” derived from the log (on-hand by SKU, open PO lines, assets due for service).
This separation makes trackers resilient: you can correct a mistake by adding a reversing transaction rather than overwriting history, and you can rebuild the current state at any time.
Inventory process tracker: movements-based on-hand and exception control
1) Define the scope and the grain
Decide what a row represents. For inventory, the most audit-friendly grain is a movement (one receipt, issue, adjustment, transfer). Each movement row should have: MovementID, DateTime, SKU, Location, MovementType, Quantity, Reference (PO, WO, ticket), EnteredBy, and Notes.
Avoid mixing “snapshot counts” (e.g., “OnHand”) into the movement log. On-hand is a computed result, not an input.
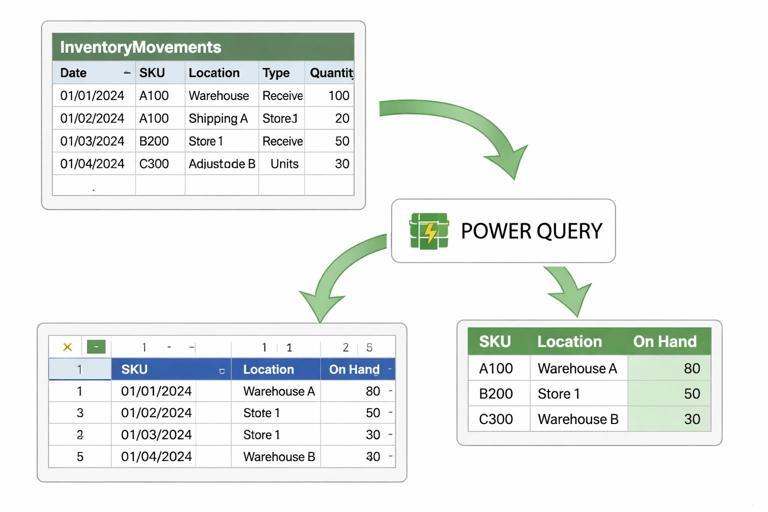
2) Build the movement log with operational fields
Create an InventoryMovements table with these recommended columns:
MovementID: unique key (can be generated as a prefix + date + sequence).
MovementDateTime: use date + time; if time is not available, standardize to a default time and document it.
SKU: key to the item master.
FromLocation and ToLocation: for transfers; for receipts/issues, one side can be blank or a standardized “External” location.
MovementType: Receipt, Issue, Transfer, Adjustment+, Adjustment-.
Quantity: always positive; the sign is implied by type (or store a SignedQty if you prefer).
ReferenceType and ReferenceID: PO, SO, WO, CycleCount, Scrap, etc.
EnteredBy and EnteredAt: supports accountability and troubleshooting.
ReasonCode: for adjustments and scrap (damage, expiry, count variance).
Operational tip: if you must allow edits, restrict them to Notes/ReasonCode and keep Quantity/Type locked after posting. If you cannot lock, add a “LastModifiedAt” and “LastModifiedBy” column and require users to fill them when changing a row.
3) Compute on-hand by SKU and location (status view)
Create a separate OnHand view that aggregates movements. You can do this with a PivotTable or with Power Query grouping. The key is to compute signed quantity consistently:
Receipt adds to ToLocation.
Issue subtracts from FromLocation.
Transfer subtracts from FromLocation and adds to ToLocation (often represented as two derived rows in the status calculation).
Adjustments add/subtract based on type.
Practical approach using Power Query (conceptual steps):
Load InventoryMovements into Power Query.
Create a custom column SignedQty for each row based on MovementType and which location you’re summarizing.
For transfers, split into two rows: one negative for FromLocation, one positive for ToLocation (you can duplicate rows and change fields).
Group by SKU + Location, sum SignedQty.
Load the result to a table named OnHand.
This produces a stable, refreshable “current on-hand” table that can be used by reorder logic, pick lists, and dashboards without touching the log.
4) Add cycle count and reconciliation workflow
Inventory trackers fail when physical counts don’t reconcile and adjustments are made without traceability. Implement a cycle count process with two tables:
CycleCountRequests: SKU, Location, RequestedBy, RequestedAt, CountDueDate, Status (Requested/In Progress/Completed).
CycleCountResults: CountID, SKU, Location, CountedQty, CountedBy, CountedAt, Notes.
Then generate an Adjustment movement automatically (or semi-automatically) by comparing CountedQty to computed OnHand. The adjustment should reference the CountID and include a reason code like “CycleCountVariance.” This keeps the movement log as the single audit trail.
5) Inventory exceptions to track (and how to surface them)
Build an Exceptions view (separate table) that flags issues requiring action:
Negative on-hand by SKU/location (often indicates missing receipts or timing issues).
Unreferenced movements (missing ReferenceID for receipts/issues).
High adjustment rate (too many adjustments for a SKU in a period).
Stale cycle counts (items not counted within policy window).
Keep exceptions as a work queue: include Owner, DueDate, and ResolutionNotes so the tracker drives action, not just reporting.
Purchasing pipeline tracker: from requisition to receipt with line-level control
1) Track at the PO line level, not just the PO header
Purchasing pipelines become ambiguous when a single PO contains multiple items with different promised dates and partial receipts. Use a PO line grain: each row represents one SKU/service line on a PO. The header fields (Vendor, Buyer, PO Date) can be repeated or referenced from a PO header table, but the operational status must be line-based.
2) Recommended tables for a robust pipeline
Requisitions: ReqID, Requester, CostCenter, NeededByDate, ApprovalStatus, ApprovedAt, Notes.
PO_Lines: POLineID, POID, VendorID, SKU/Service, Description, OrderedQty, UnitCost, Currency, OrderDate, PromisedDate, Incoterms/ShippingMode (if relevant), Buyer, Status.
PO_Events (log): EventID, POLineID, EventDateTime, EventType (Sent, Acknowledged, PromisedDateChanged, Shipped, Delivered, InvoiceReceived, Closed, Cancelled), EventValue (e.g., new promised date), EnteredBy, Notes.
Receipts: ReceiptID, POLineID, ReceiptDateTime, ReceivedQty, Location, Receiver, PackingSlip/ASN, Notes.
The key idea: the “current status” of a PO line is derived from events and receipts, not typed manually in multiple places.
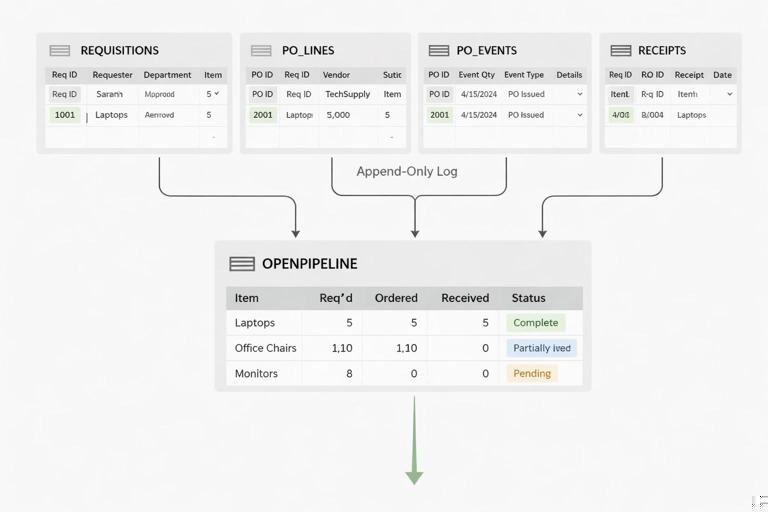
3) Step-by-step: build a current open pipeline view
Use Power Query to create a refreshable OpenPOLines view:
Load PO_Lines and filter out Cancelled/Closed lines if those are final states.
Load Receipts and group by POLineID to compute TotalReceivedQty and LastReceiptDate.
Merge the grouped receipts into PO_Lines by POLineID.
Create a column OpenQty = OrderedQty - TotalReceivedQty.
Filter OpenQty > 0 to get open lines.
Load PO_Events and, for each POLineID, identify the latest relevant event (e.g., latest PromisedDateChanged, latest Shipped). In Power Query, this is typically done by sorting events descending by EventDateTime and then keeping the first row per POLineID.
Merge the latest event fields into the open lines to show CurrentMilestone and LatestEventDate.
This view becomes your operational pipeline: what’s open, how much is still due, what’s the latest milestone, and what date was last touched.
4) Late and at-risk logic without fragile formulas
Instead of embedding complex formulas across the tracker, compute a small set of standardized risk flags in the status view:
DaysToPromised = PromisedDate - Today.
LateFlag: PromisedDate < Today and OpenQty > 0.
NoTouchFlag: LatestEventDate older than X days (e.g., 7) for open lines.
PartialReceiptFlag: TotalReceivedQty > 0 and OpenQty > 0.
These flags drive a buyer work queue. Add Owner and NextActionDate fields to the queue so the tracker supports follow-up cadence.
5) Handling promised date changes and vendor confirmations
Promised dates are often overwritten, destroying the ability to measure supplier reliability. Use the event log to record each change:
When a vendor confirms: add an Acknowledged event with the confirmed promised date in EventValue.
When the date changes: add PromisedDateChanged with old/new values (store new in EventValue; old can be inferred from previous event or stored in Notes).
Then build a Supplier Reliability view that counts changes per PO line and measures slip days (difference between first promised date and final receipt date). Keep this as an analysis view; the tracker’s job is to capture events cleanly.
Maintenance log tracker: assets, work orders, and preventive schedules
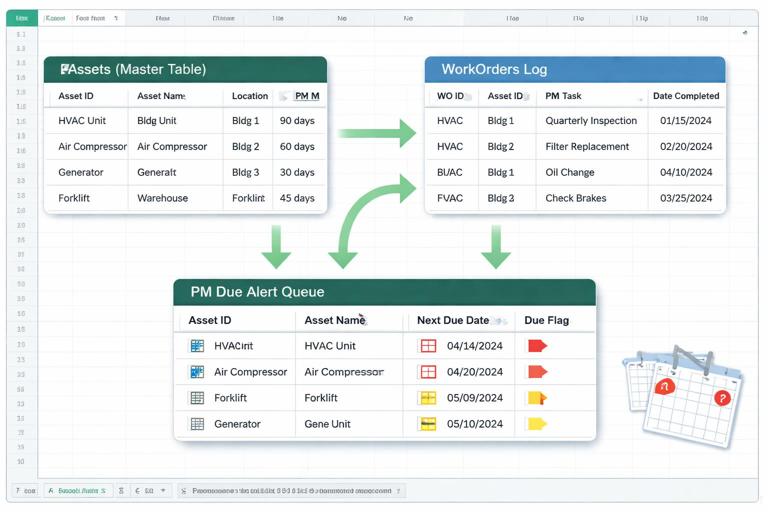
1) Separate the asset register from the work log
Maintenance tracking needs two different data shapes:
Asset register: one row per asset (AssetID, AssetName, Location, Criticality, Manufacturer, Model, InstallDate, ServiceIntervalDays or ServiceIntervalHours, SafetyNotes).
Work order log: one row per work order (or per work order task) capturing what happened and when.
Do not store “LastServiceDate” as a manual input on the asset register. Compute it from completed work orders to avoid drift.
2) Work order table fields that prevent ambiguity
Create a WorkOrders table with:
WOID: unique identifier.
AssetID: link to asset register.
WOType: Preventive, Corrective, Inspection, Calibration.
RequestedAt, RequestedBy, Priority.
ProblemCode and CauseCode (for corrective work).
Status: Requested, Approved, Scheduled, In Progress, Waiting Parts, Completed, Cancelled.
ScheduledStart, CompletedAt.
DowntimeMinutes (if applicable).
LaborHours and PartsCost (optional but useful).
Technician, Verifier (for QA sign-off).
If you need detailed steps/checklists, store them in a separate WorkOrderTasks table (WOID, TaskSeq, TaskDescription, TaskStatus, CompletedAt). This avoids extremely wide work order rows and supports repeating tasks.
3) Preventive maintenance schedule as a generated queue
A preventive maintenance (PM) tracker should generate “due” work, not rely on someone remembering to create it. Build a PMDue view:
From the asset register, take ServiceIntervalDays (or hours).
Compute LastCompletedPMDate per AssetID from WorkOrders where WOType=Preventive and Status=Completed.
NextDueDate = LastCompletedPMDate + ServiceIntervalDays (or InstallDate + interval if never completed).
DueFlag: NextDueDate <= Today + LeadTimeDays (e.g., 14).
In Power Query, this is typically a merge between Assets and a grouped WorkOrders table (max CompletedAt per AssetID for preventive work). Load PMDue as a table that planners use to create new WOs.
4) Step-by-step: build a maintenance “backlog and compliance” view
Load WorkOrders.
Create a Backlog view by filtering Status not in (Completed, Cancelled).
Add AgingDays = Today - RequestedAt.
Group backlog by AssetID, Priority, or Location to see where work is accumulating.
For compliance, filter preventive work orders completed in the last period and compare against PMDue expectations (e.g., assets due vs assets completed). This is easiest when PMDue is generated and time-stamped each refresh (store a snapshot if you need historical compliance).
Operational tip: if compliance must be auditable, store periodic snapshots of PMDue (AssetID, NextDueDate, SnapshotDate). Then you can prove what was due at the time, not what appears due today.
Shared controls across all trackers: IDs, timestamps, and change discipline
Unique IDs that survive copy/paste and refresh
Every tracker needs stable keys. If users will add rows manually, provide an ID generation method that is hard to break. Options include:
A controlled sequence stored in a single cell and incremented via a macro or Office Script.
A GUID generated by script for each new row.
A composite key (Date + User + Sequence) if scripts are not allowed, with validation to detect duplicates.
Even if you later consolidate with Power Query, stable IDs prevent accidental double-counting and make merges deterministic.
Status changes as events, not overwrites
For purchasing and maintenance, treat status changes as events. If you must keep a Status column on the main table for convenience, derive it from the latest event. This prevents “mystery states” where a line says Shipped but there is no shipment date or reference.
Work queues instead of “pretty sheets”
Trackers should produce actionable queues:
Inventory: negative on-hand, missing references, high adjustments.
Purchasing: late open lines, no-touch lines, partial receipts needing expediting.
Maintenance: overdue PMs, backlog aging, waiting parts older than threshold.
Each queue should include Owner, NextAction, and NextActionDate. This turns the workbook into a process tool rather than a passive report.
Practical example layouts (what to put on each worksheet)
Inventory workbook layout
Items (master): SKU, Description, UoM, Category, DefaultLocation, ReorderPoint, ReorderQty, PreferredVendor.
Movements (log): append-only movement rows.
OnHand (view): query output by SKU/location.
Exceptions (queue): negative on-hand, missing refs, stale counts.
CycleCounts: requests and results.
Purchasing workbook layout
Vendors (master): VendorID, Name, LeadTimeDays, Contact, PaymentTerms.
PO_Lines (base): one row per line with ordered qty and promised date.
PO_Events (log): acknowledgements, changes, shipments.
Receipts (log): partial receipts and dates.
OpenPipeline (view): open qty, late flags, latest milestone.
Maintenance workbook layout
Assets (master): AssetID, location, interval, criticality.
WorkOrders (log): status, dates, downtime, labor.
WorkOrderTasks (optional): checklist steps.
PMDue (view): next due dates and due flags.
Backlog (view): aging and priority.
Operational automation ideas that fit within Excel + Power Query
Refresh-driven status tables
Use Power Query to rebuild status views (OnHand, OpenPipeline, PMDue) on refresh. Users interact primarily with the log tables; planners and managers use the views. This reduces formula sprawl and makes the workbook easier to audit.
Controlled “posting” process
For movements, receipts, and work order completions, implement a simple posting routine:
User fills a small entry form table (staging).
A script/macro validates required fields and appends to the correct log table.
The staging area is cleared and time-stamped.
This reduces copy/paste errors and ensures every posted record has an ID and timestamp.
Snapshotting for audit and KPI stability
Some metrics change when history is corrected (late flags, due lists). If you need stable KPIs, store periodic snapshots:
Daily OpenPipeline snapshot (POLineID, OpenQty, PromisedDate, SnapshotDate).
Daily OnHand snapshot for critical SKUs.
Weekly PMDue snapshot for compliance reporting.
Snapshots can be appended to a history table via Power Query (staging + append) or via script. The key is to separate “current state” from “what we believed at the time.”
Common failure modes and how to prevent them in trackers
Duplicate records from repeated imports or manual entry
Use unique IDs and enforce uniqueness checks in your status queries (e.g., detect duplicate MovementID or ReceiptID and surface them in an Exceptions queue). If you consolidate from multiple sources, include SourceSystem and SourceRowID to make duplicates traceable.
Partial updates that break reconciliation
Example: a receipt is entered but the PO line is marked closed manually. Avoid manual closure; derive closure from OpenQty reaching zero and a final event (Closed) recorded in the event log.
Ambiguous dates (order date vs promised date vs receipt date)
Keep separate fields for each date type and use consistent naming. In purchasing, most operational decisions depend on PromisedDate and LatestEventDate; in maintenance, ScheduledStart and CompletedAt drive backlog and compliance.
Overloading a tracker with too many purposes
When a tracker tries to be a planning tool, an audit log, and a dashboard all at once, it becomes fragile. Keep logs narrow and append-only; keep planning queues as derived views; keep dashboards separate and fed from the views.