What Power Query Is (and Why Operations Teams Use It)
Power Query is Excel’s built-in data preparation engine. Instead of cleaning data by hand (copy/paste, Text to Columns, find/replace, manual filters), you build a repeatable set of transformation steps called a query. Each step is recorded and can be refreshed whenever new files arrive. In operations work, this matters because the same recurring issues show up every week: inconsistent headers, mixed date formats, extra spaces, multiple files to combine, and “almost the same” reports from different systems.

Power Query works in a different mindset than worksheet formulas. You are not editing cells; you are defining a pipeline: connect → clean → shape → consolidate → load. The output can be loaded to a worksheet table or to the Data Model. The key benefit is that the pipeline is deterministic and refreshable: when the source changes, you refresh and the same rules are applied again.
Core terms you’ll use
- Query: a set of steps that produces a table.
- Step: one transformation (e.g., remove columns, change type, split column).
- Applied Steps: the ordered list of steps; order matters.
- M: the Power Query formula language behind the steps.
- Load: where the result goes (worksheet table, connection only, Data Model).
Typical Data Problems Power Query Solves
Operational datasets often arrive with issues that make dashboards and trackers fragile. Power Query is designed to normalize these issues before the data touches your calculations.
Common cleaning tasks
- Removing leading/trailing/double spaces and non-printing characters.
- Standardizing case (upper/lower/proper) for IDs or names.
- Fixing data types (dates stored as text, numbers stored as text).
- Splitting or merging columns (e.g., “City, State” into two fields).
- Filtering out totals rows, headers repeated mid-file, or blank lines.
- Replacing inconsistent values (e.g., “N/A”, “na”, “-” → null).
Common shaping tasks
- Pivot/unpivot to convert cross-tab reports into normalized tables.
- Grouping and aggregating (e.g., daily shipments to weekly totals).
- Creating calculated columns for categorization (e.g., SLA bucket).
- Joining (merging) tables from different sources.
Common consolidation tasks
- Appending multiple files with the same structure (monthly exports).
- Combining multiple sheets from one workbook.
- Consolidating folder-based drops where new files arrive periodically.
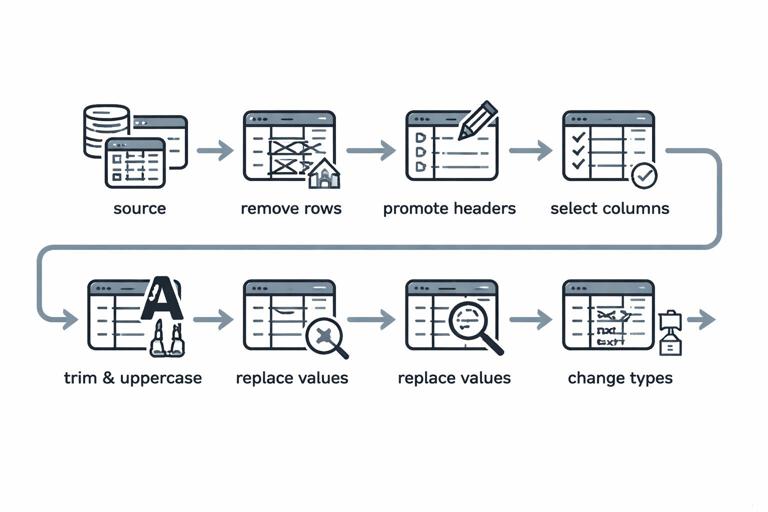
Workflow: Build a Refreshable Query (End-to-End)
This section walks through a practical pattern you can reuse: take messy exports, clean them, shape them into a consistent schema, and consolidate them into one refreshable dataset.
Scenario
You receive weekly shipment exports from multiple warehouses. Each file has small inconsistencies: extra header rows, date columns as text, and a “Total” line at the bottom. Your goal is one clean table with consistent columns: ShipDate, Warehouse, OrderID, SKU, Qty, Carrier, Status.
- Listen to the audio with the screen off.
- Earn a certificate upon completion.
- Over 5000 courses for you to explore!

Download the app

Step-by-step: connect and inspect
- Go to Data > Get Data and choose the appropriate connector (From Workbook, From Text/CSV, From Folder, etc.).
- In the preview, click Transform Data (not Load) to open Power Query Editor.
- Immediately check column headers and the first few rows. Look for repeated headers, blank rows, totals, and mixed formats.
Step-by-step: remove noise rows
Many exports include top rows like “Report generated on…” or blank lines. Remove them early so later steps behave predictably.
- If the first N rows are non-data, use Home > Remove Rows > Remove Top Rows.
- If there are blank rows, use Home > Remove Rows > Remove Blank Rows.
- If there is a “Total” row at the bottom, filter a stable column (like OrderID) to exclude “Total” or nulls. Prefer filtering by a rule that will still work when row counts change.
Step-by-step: promote headers safely
- Use Home > Use First Row as Headers only after you’ve removed the non-data rows.
- Verify that headers are unique and meaningful. If you see duplicates like “Column1”, “Column1_1”, fix them now by renaming.
Step-by-step: set data types deliberately
Data types control sorting, grouping, and downstream calculations. Power Query often auto-detects types, but operational exports can trick detection (especially dates). Set types intentionally after the table is stable.
- Select the ShipDate column and set type to Date.
- Select Qty and set type to Whole Number (or Decimal if needed).
- Keep IDs like OrderID as Text to preserve leading zeros.
If a date is stored as text, try Transform > Data Type > Using Locale and choose the correct locale (e.g., English (United States) for MM/DD/YYYY). This is more robust than hoping auto-detection guesses correctly.
Cleaning Techniques That Prevent Downstream Errors
Trim, clean, and normalize text
Spaces and hidden characters are a major cause of mismatches in joins and lookups. Apply text cleanup to key fields used for matching (SKU, Warehouse, Carrier, Status).
- Select the column(s) and use Transform > Format > Trim to remove leading/trailing spaces.
- Use Transform > Format > Clean to remove non-printing characters.
- Use Transform > Format > Uppercase (or Lowercase) for IDs where case should not matter.
Practical tip: apply normalization before merges/appends so keys match reliably across sources.
Replace inconsistent “null-like” values
Exports often use placeholders like “N/A”, “-”, or “(blank)”. Convert these to actual nulls so filters and calculations behave consistently.
- Select the column and use Transform > Replace Values to replace “N/A” with null.
- Repeat for “-”, “na”, “NULL”, etc., as needed.
Split columns using stable delimiters
If a field combines multiple pieces (e.g., “Carrier - ServiceLevel”), split it into separate columns.
- Select the column and choose Transform > Split Column > By Delimiter.
- Choose the delimiter (e.g., “ - ”) and decide whether to split at the left-most delimiter or each occurrence.
- Rename the resulting columns to meaningful names.
Remove columns you don’t need (but do it at the right time)
Removing columns reduces refresh time and keeps your dataset focused. However, remove columns after you’ve confirmed which fields are needed for joins, filters, or audit checks.
- Select unwanted columns and use Home > Remove Columns.
- Prefer Remove Other Columns when you know the exact final schema; this is safer against source files that add extra columns later.
Shaping Data: From “Report Layout” to “Analysis Layout”
Many operational reports are designed for humans to read, not for analysis. Power Query reshapes them into a normalized structure where each row is one record and each column is one attribute.
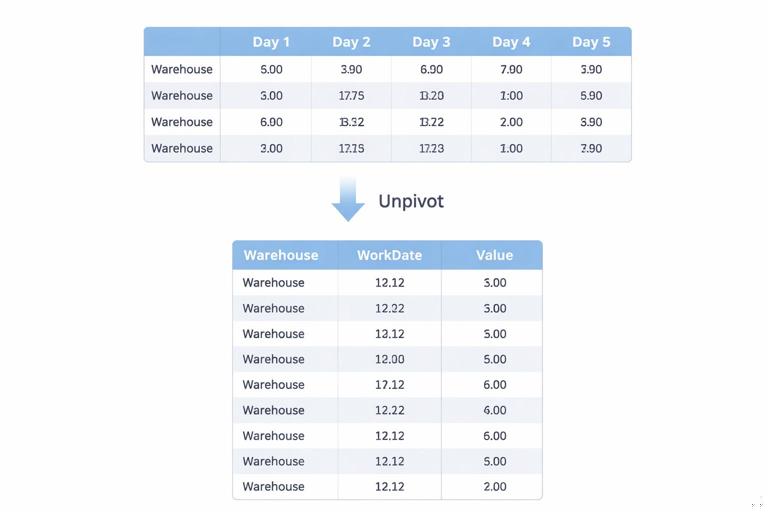
Unpivot: turning cross-tabs into rows
Example: a capacity report arrives like this: one row per warehouse, one column per day (Mon, Tue, Wed…), with numbers in the grid. Dashboards and pivots work better when the days are rows.
Step-by-step:
- Identify the identifier columns (e.g., Warehouse, Region).
- Select those identifier columns.
- Choose Transform > Unpivot Columns > Unpivot Other Columns.
- Rename the resulting columns: “Attribute” → “WorkDate” (or Day), “Value” → “CapacityUnits”.
- Set data types: WorkDate as Date (or Text if it’s day names), CapacityUnits as number.
Unpivot is one of the highest-impact transformations for operations dashboards because it converts “wide” reports into “tall” datasets that are easy to filter, group, and chart.
Pivot: turning categories into columns (when needed)
Sometimes you need the opposite: you have rows like (Warehouse, Status, Count) and want one column per Status. Use Pivot carefully because it can create sparse tables and can break if new categories appear.
- Select the category column (e.g., Status).
- Choose Transform > Pivot Column.
- Pick the values column (e.g., Count) and choose an aggregation (Sum is common).
Operational tip: if new statuses can appear, consider keeping the data unpivoted and using PivotTables/visuals to pivot dynamically instead of hard-pivoting in Power Query.
Group By: aggregations for operational rollups
Grouping is useful for producing daily/weekly summaries, exception counts, or totals by site.
Step-by-step:
- Go to Home > Group By.
- Choose grouping columns (e.g., Warehouse, ShipDate).
- Add aggregations like Sum of Qty, Count Rows, or Max of ShipDateTime.
Use Group By when you want the query output to be a summary table. If you still need record-level detail for drill-down, keep a separate detail query and build a summary query that references it.
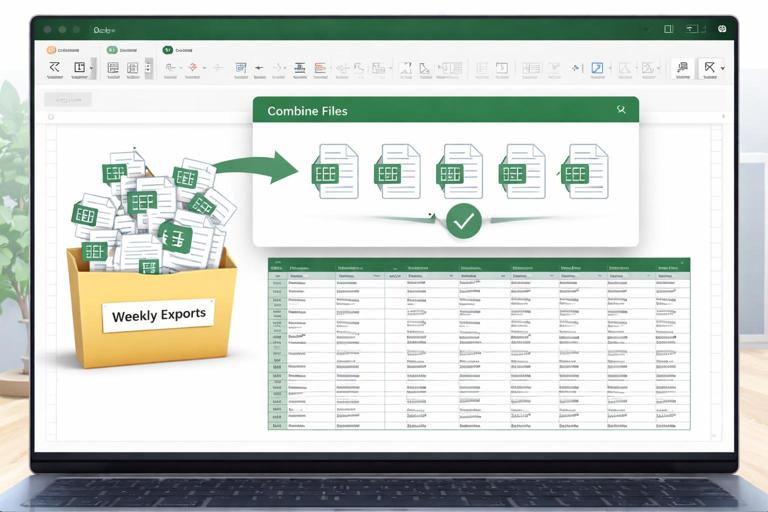
Consolidation Patterns: Append and Combine Files Reliably
Append queries: stacking tables with the same schema
Appending is the Power Query equivalent of stacking datasets vertically (like adding rows). This is ideal when you have the same export from multiple warehouses or months.
Step-by-step:
- Create one clean query per source (or per system) that outputs the same column names and types.
- Go to Home > Append Queries (or Append Queries as New).
- Select the tables to append.
- After appending, re-check data types and column order.
Practical rule: standardize column names before appending. If one query outputs “Order ID” and another outputs “OrderID”, you will get two separate columns with nulls, which is a common consolidation failure.
Combine from Folder: the “drop files here and refresh” approach
For recurring operations, a folder-based process is often the most scalable: each week a new file is saved into a folder, and the query combines them automatically.
Step-by-step:
- Put all source files in a dedicated folder with consistent structure (e.g., \Ops\Shipments\WeeklyExports\).
- In Excel, choose Data > Get Data > From File > From Folder.
- Select the folder and click Combine & Transform.
- Power Query creates a sample file transform and a function that is applied to each file.
- In the sample transform query, perform your cleaning steps (remove top rows, promote headers, set types, remove totals).
- Return to the combined query and verify that all files are included and the schema is consistent.
Operational tip: if some files occasionally have extra columns, use a “keep only required columns” step (Remove Other Columns) in the sample transform so the combined result stays stable.
Combine multiple sheets from one workbook
Some systems export one workbook with multiple sheets (one per site). You can consolidate them by filtering the workbook object list and expanding the data.
- Use Get Data > From Workbook.
- In the Navigator, select the workbook object list (or choose “Transform Data”).
- Filter to the sheets you want (exclude hidden/system sheets if present).
- Expand the Data column to combine.
- Apply consistent header/type steps after expansion.
Merging (Joining) Data to Enrich Operational Records
Merging queries is how you add attributes from a reference table (e.g., SKU master, warehouse mapping, carrier service levels). This is similar to a database join.
Step-by-step: merge shipments with a SKU master
- Ensure both tables have a clean, normalized key (e.g., SKU trimmed and uppercased in both queries).
- In the shipments query, choose Home > Merge Queries.
- Select the SKU master query as the second table.
- Select the key columns in both tables (SKU).
- Choose join kind (typically Left Outer to keep all shipments).
- After merging, expand the nested table column to bring in fields like ProductFamily, UnitWeight, or HazardClass.
Practical check: after the merge, create a quick filter on the expanded fields to see if any are null. Nulls often indicate key mismatches (spaces, case, leading zeros) or missing master data.
Join kinds you’ll actually use
- Left Outer: keep all rows from the main table; bring matches from the lookup table (most common for enrichment).
- Inner: keep only rows that match in both tables (useful for validating that all records have master data).
- Anti joins (Left Anti): return rows with no match (useful for exception lists like “SKUs missing from master”).
Making Queries Robust: Order of Steps, Naming, and Parameters
Applied Steps order matters
Power Query executes steps in order. A common reliability issue is setting data types too early, then later removing header rows or changing columns, which can cause type conversion errors. A practical order for messy exports is:
- Remove top/bottom noise rows
- Promote headers
- Remove blank rows
- Standardize column names
- Keep only required columns
- Clean text keys (Trim/Clean/Case)
- Replace null-like values
- Set data types
- Merge/append
- Final checks (sort, remove duplicates if required)
Rename steps and queries for maintainability
In operations, someone else will eventually maintain your workbook. Rename queries and steps so the pipeline is readable.
- Rename queries like “Shipments_Raw”, “Shipments_Clean”, “Shipments_All”, “SKU_Master”.
- Right-click steps and rename them (e.g., “Removed Header Rows”, “Normalized SKU”, “Filtered Totals”).
Use parameters for file paths and cutoffs
Hard-coded file paths break when folders move. Parameters make queries portable.
Step-by-step:
- In Power Query Editor, go to Home > Manage Parameters.
- Create a parameter like pShipmentsFolder with the folder path.
- Edit the Source step to reference the parameter instead of a literal path.
You can also parameterize date cutoffs (e.g., only load the last 90 days) to keep refresh fast.
Quality Checks Inside Power Query
Power Query includes profiling tools that help you catch issues before loading.
Column quality, distribution, and profile
- In Power Query Editor, go to View and enable Column quality, Column distribution, and Column profile.
- Look for unexpected errors, high null percentages, or unusual distinct counts (e.g., Warehouse should have a small number of distinct values).
Detecting duplicates and key integrity
If OrderID should be unique per warehouse per day, you can test it.
- Select the key columns (Warehouse, ShipDate, OrderID).
- Use Home > Remove Rows > Remove Duplicates in a validation query to see how many duplicates exist (or keep duplicates and flag them).
- Alternatively, Group By the key columns and count rows; filter counts > 1 to produce an exception list.
When to Load to Worksheet vs Connection Only
Loading choices affect performance and workbook clarity.
- Load to Table when users need to see the cleaned dataset, filter it, or use it as a source for PivotTables.
- Connection Only when the query is an intermediate step (e.g., a staging query used by other queries).
- Load to Data Model when you want relationships and measures (especially for larger datasets), while keeping the worksheet uncluttered.
Practical pattern: keep raw/staging queries as Connection Only, and load only the final curated outputs that feed dashboards and trackers.
Example: A Complete Transformation Recipe (with M You Can Reuse)
The UI is usually enough, but seeing the M helps you understand what’s happening and lets you copy patterns. Below is an illustrative query skeleton for cleaning a shipments table after it has been imported (the Source step will differ by connector).
let Source = Excel.CurrentWorkbook(){[Name="Shipments_Import"]}[Content], RemovedTopRows = Table.Skip(Source, 2), RemovedBlankRows = Table.SelectRows(RemovedTopRows, each List.NonNullCount(Record.FieldValues(_)) > 0), PromotedHeaders = Table.PromoteHeaders(RemovedBlankRows, [PromoteAllScalars=true]), RenamedColumns = Table.RenameColumns(PromotedHeaders, { {"Order ID", "OrderID"}, {"Ship Date", "ShipDate"}, {"WH", "Warehouse"} }, MissingField.Ignore), KeptRequired = Table.SelectColumns(RenamedColumns, {"ShipDate","Warehouse","OrderID","SKU","Qty","Carrier","Status"}, MissingField.UseNull), TrimmedText = Table.TransformColumns(KeptRequired, { {"Warehouse", Text.Trim, type text}, {"OrderID", Text.Trim, type text}, {"SKU", each Text.Upper(Text.Trim(_)), type text}, {"Carrier", Text.Trim, type text}, {"Status", Text.Trim, type text} }), ReplacedPlaceholders = Table.ReplaceValue(TrimmedText, "N/A", null, Replacer.ReplaceValue, {"Carrier","Status"}), FilteredTotals = Table.SelectRows(ReplacedPlaceholders, each [OrderID] <> null and [OrderID] <> "Total"), Typed = Table.TransformColumnTypes(FilteredTotals, { {"ShipDate", type date}, {"Qty", Int64.Type} })in TypedHow to use this pattern: build the steps in the UI first, then open Advanced Editor to review the generated M. You can adjust column lists and rename mappings to match your schema. The most reusable parts are: keeping required columns, trimming/uppercasing keys, replacing placeholders with null, filtering totals, and applying types at the end.