What “reliability and scale” mean in an operational workbook
An operational workbook is not a one-off analysis file. It is a living system that gets updated (daily/weekly), touched by multiple people, and used to make decisions. “Reliability” means the workbook produces correct outputs even when inputs change, users make mistakes, or data arrives late. “Scale” means the same design keeps working as volume grows (more rows, more sites, more SKUs, more weeks) and as the process expands (new metrics, new teams, new sources).
Designing for reliability and scale is mostly about structure: separating raw inputs from transformations and outputs, standardizing tables and naming, controlling where users can edit, and building checks that fail loudly when something is wrong. The goal is to make the workbook behave like a small application: predictable, testable, and hard to break.
Architecture: separate layers so changes don’t ripple unpredictably
Use a three-layer layout: Inputs → Model → Outputs
A reliable operational workbook is easiest to maintain when it is organized into layers. Each layer has a clear purpose and limited editing rights.
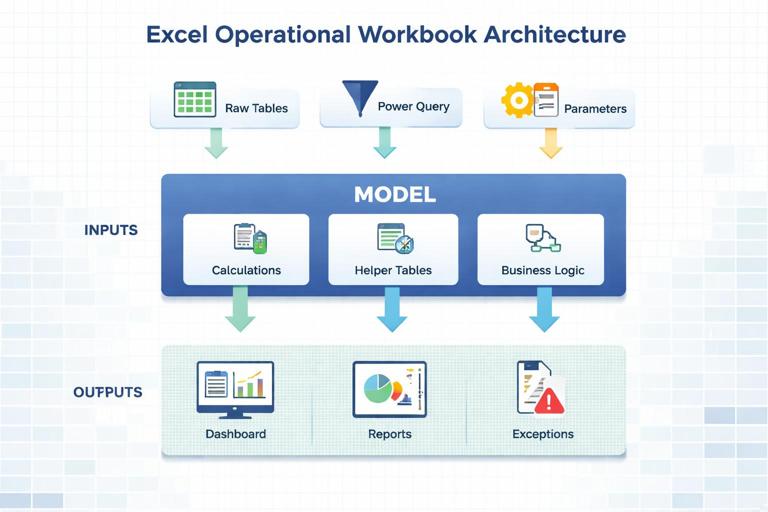
Inputs layer: where data enters the workbook. This can be Power Query-loaded tables, manual entry tables (rare), or parameter tables. Inputs should be in Excel Tables with stable column names and explicit data types.
Model layer: calculations, relationships, helper tables, and business logic. This is where you compute KPIs, flags, and aggregations. Users should rarely type here.
Continue in our app.- Listen to the audio with the screen off.
- Earn a certificate upon completion.
- Over 5000 courses for you to explore!

Download the app
Outputs layer: dashboards, printable reports, and operational views (today’s backlog, exceptions list). Outputs should reference the model, not the raw inputs directly.
This separation prevents a common failure mode: a dashboard cell directly referencing a raw column that later changes shape, causing silent errors. When outputs depend on a stable model interface (well-defined tables/columns), you can change the input mechanics without breaking the dashboard.
Standardize sheet roles and naming
Use a consistent naming convention so anyone can navigate quickly. A practical pattern:
IN_ prefix for input sheets (e.g., IN_RawOrders, IN_Params)
MDL_ prefix for model sheets (e.g., MDL_Calendar, MDL_KPI)
OUT_ prefix for outputs (e.g., OUT_Dashboard, OUT_Exceptions)
SYS_ for system/admin (e.g., SYS_Checks, SYS_Notes)
Inside each sheet, keep a consistent layout: tables start at the top-left, a small “control panel” area for slicers/filters on outputs, and a reserved area for checks and refresh timestamps.
Data contracts: treat tables like APIs
Define a stable schema for each core table
Operational workbooks break when columns are renamed, inserted, or change meaning. Prevent this by defining a “data contract” for each core table: required columns, data types, and allowed values. Put this contract in a SYS_Notes sheet and enforce it with checks.
Example contract for an Orders table:
OrderID (text, unique, not blank)
OrderDate (date, not blank)
Site (text, must exist in Sites table)
SKU (text, must exist in Items table)
Qty (number, >= 0)
Status (text, one of: Open, Picked, Shipped, Cancelled)
When new sources are added, you map them into this contract rather than letting downstream formulas adapt ad hoc.
Prefer “long” tables over wide cross-tabs
For scale, store facts in long format: one row per event/transaction/period, with columns for attributes. Wide cross-tabs (e.g., one column per week) are fragile: adding a new week forces structural changes and breaks formulas and charts. Long tables scale naturally as rows increase.
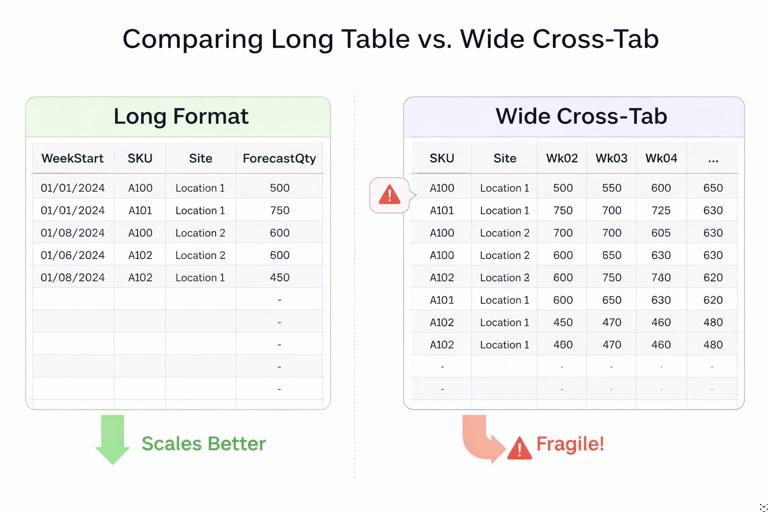
Example: instead of columns Wk01, Wk02, Wk03… store a Forecast table with columns: WeekStart, SKU, Site, ForecastQty.
Control user edits: make the right thing easy and the wrong thing hard
Minimize manual entry; when needed, isolate it
Manual entry is a reliability risk, but sometimes unavoidable (e.g., entering staffing constraints, target service levels, or one-off overrides). When you must allow manual entry:
Use a dedicated input table (e.g., IN_Overrides) rather than scattered cells.
Use Excel Table features: structured references, auto-fill, and consistent formatting.
Use Data Validation to restrict values (lists, numeric ranges, date ranges).
Include an “EnteredBy” and “EnteredOn” column if the process needs traceability.
Protect structure, not just cells
Workbook protection is often used incorrectly: people lock everything, then users copy/paste and break tables anyway. A better approach is to protect the structure that must not change:
Lock and protect sheets that contain model logic and output layouts.
Leave only the input table body unlocked for entry.
Prevent insertion/deletion of rows/columns on protected sheets if that would break references.
Use separate “staging” sheets for paste operations, then load/clean from there.
Even without heavy protection, reliability improves when users have a clearly marked “edit zone” and everything else is visually and structurally treated as system-controlled.
Design calculations for robustness under change
Use structured references and avoid hard-coded ranges
Hard-coded ranges (e.g., A2:A5000) fail when data grows. Use Excel Tables and structured references so formulas automatically expand with new rows.
Example: instead of =SUM($E$2:$E$5000), use =SUM(tblOrders[Qty]).
For outputs that need dynamic lists, reference table columns directly or use dynamic array formulas that spill based on table size.
Build calculations around keys, not positions
Operational data changes order frequently (sorting, new rows, new sites). Formulas that rely on row positions or “the 5th column” are brittle. Use keys (OrderID, SKU, Site, Date) and lookups/joins that match on those keys.
Example pattern: compute a KPI table keyed by Site and WeekStart, then have the dashboard pull from that table using those keys. This is more reliable than referencing a pivot output cell that moves when filters change.
Prefer explicit helper columns over deeply nested formulas
Deeply nested formulas are hard to audit and easy to break. For reliability, decompose logic into helper columns with clear names. This also improves performance because Excel can reuse intermediate results.
Example: instead of one formula that computes “Late and Open and HighPriority”, create helper columns:
IsOpen
IsLate
IsHighPriority
ExceptionFlag = AND(IsOpen, IsLate, IsHighPriority)
Then your exceptions report filters on ExceptionFlag.
Operational checks: detect issues early and visibly
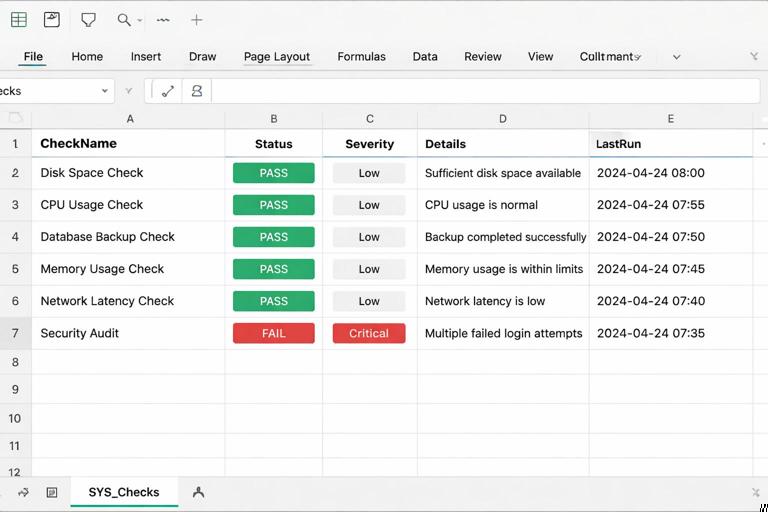
Create a SYS_Checks table with pass/fail tests
Reliability improves dramatically when the workbook tells you when it cannot be trusted. Create a SYS_Checks table with columns like: CheckName, Status (PASS/FAIL), Severity (Info/Warn/Critical), Details, LastRun.
Examples of high-value checks:
Row count change: compare current row count to last refresh or expected range.
Missing required columns: verify that input tables contain required headers.
Duplicate keys: count duplicates in OrderID or composite keys.
Orphan references: SKUs in Orders not found in Items master.
Date coverage: ensure the calendar covers the latest date in transactions.
Null rate: percentage of blanks in critical fields (Site, SKU, Qty).
Place a small “trust indicator” on the dashboard that reads from SYS_Checks. If any Critical check fails, show a prominent warning and optionally hide KPIs (or show them with a red banner) to avoid decision-making on bad data.
Implement checks with simple, auditable formulas
Checks should be easy to understand. Use COUNTIFS, UNIQUE/COUNT, and simple comparisons. Example duplicate key check for a table tblOrders with OrderID:
=LET(ids, tblOrders[OrderID], dupCount, ROWS(ids)-ROWS(UNIQUE(ids)), IF(dupCount>0, "FAIL", "PASS"))Example orphan SKU check (SKUs in Orders not in Items):
=LET(orderSkus, UNIQUE(tblOrders[SKU]), itemSkus, tblItems[SKU], missing, FILTER(orderSkus, ISNA(XMATCH(orderSkus, itemSkus))), IF(ROWS(missing)>0, "FAIL", "PASS"))Keep the “Details” column as a short text summary (e.g., “12 missing SKUs”) and optionally provide a drill-down table listing the missing values.
Performance and scalability: keep refresh and recalculation fast
Reduce volatile functions and unnecessary recalculation
Volatile functions (like NOW, TODAY, RAND, OFFSET, INDIRECT) recalculate frequently and can slow large workbooks. In operational models, prefer stable references and explicit refresh timestamps.
Instead of using NOW() everywhere, store a single timestamp cell (e.g., SYS_LastRefresh[Value]) updated on refresh, and reference that cell.
Limit cross-sheet dependencies and repeated lookups
When many formulas repeatedly look up the same mapping (e.g., SKU → Category), performance suffers and errors multiply. Centralize mappings in the model layer and bring attributes into fact tables once (either via Power Query merge or via a single helper column), then reuse the enriched table.
Example: rather than doing XLOOKUP(Category) in five different output tables, add Category to the Orders model table once, then aggregate by Category.
Design outputs to read from aggregated tables
Dashboards that point directly at millions of rows will become slow. Create aggregated model tables at the grain needed for reporting (e.g., Site x Day, SKU x Week). Outputs should read from these smaller tables.
Practical pattern:
MDL_FactOrders: transaction-level table
MDL_OrdersByDay: aggregated table with Date, Site, OrdersCount, Units
OUT_Dashboard charts and KPIs use MDL_OrdersByDay
Step-by-step: build a scalable workbook skeleton you can reuse
Step 1: Create the sheet structure and navigation
Create sheets: IN_Raw, IN_Params, MDL_Tables, OUT_Dashboard, OUT_Exceptions, SYS_Checks, SYS_Notes.
In SYS_Notes, document: file purpose, owner, refresh frequency, data sources, and table contracts.
Add a simple “Home” area at the top of OUT_Dashboard with links (cell hyperlinks) to key sheets.
Step 2: Define parameter tables instead of hard-coded constants
Operational logic often depends on thresholds (late definition, service level targets, capacity assumptions). Put these in IN_Params as a two-column table: ParamName, ParamValue. Then reference them by name.
Example parameter table rows:
LateDaysThreshold = 2
HighPriorityCutoff = 100
DefaultSite = “DC1”
In formulas, retrieve parameters with XLOOKUP:
=XLOOKUP("LateDaysThreshold", tblParams[ParamName], tblParams[ParamValue])This design scales because changing a threshold does not require editing multiple formulas.
Step 3: Convert all input ranges into Excel Tables with stable names
Select each input range and press Ctrl+T to create a Table.
Name tables clearly (Table Design → Table Name): tblRawOrders, tblItems, tblSites, tblParams.
Ensure headers match the data contract exactly (case and spelling consistent).
Tables provide automatic expansion, structured references, and consistent schema handling.
Step 4: Build model tables with explicit keys
In MDL_Tables, create model tables that include keys and derived fields. Example derived fields for orders:
OrderKey (same as OrderID or composite if needed)
OrderWeekStart (normalized week start date)
IsLate (based on OrderDate vs ShipDate or SLA)
ExceptionType (text label for the reason)
Keep derived fields close to the data they describe, and name them consistently (Is*, Has*, *_Flag) so they are easy to filter and audit.
Step 5: Create an exceptions table that is safe to operationalize
Exceptions lists are operational tools: people will filter, sort, and act on them. Make them robust:
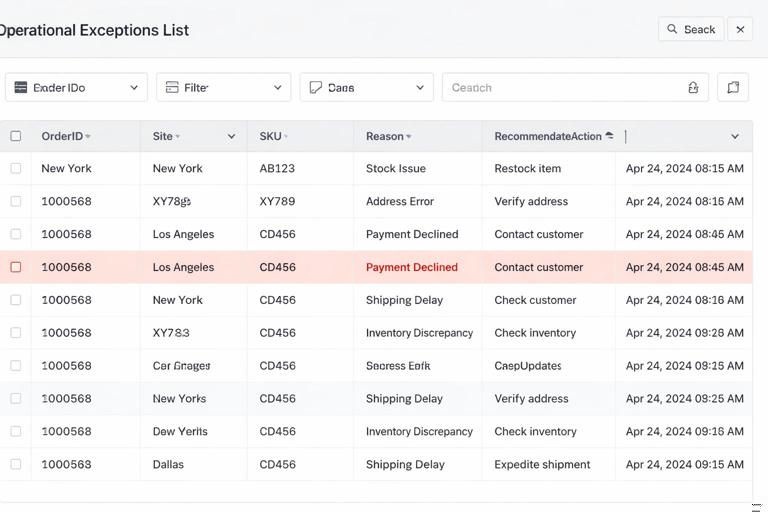
Use a dedicated table (e.g., tblExceptions) that draws from the model.
Include stable identifiers (OrderID, Site, SKU) and the fields needed to resolve the issue.
Include a “Reason” column and a “RecommendedAction” column if possible.
Include a “LastUpdated” timestamp cell on the sheet.
Do not build exceptions as a fragile set of filtered rows in-place on the raw data sheet. Keep it as a separate output artifact.
Step 6: Add SYS_Checks and wire it to the dashboard
Create tblChecks with columns: CheckName, Status, Severity, Details.
Create formulas for each check (as described earlier).
Create a dashboard cell “DataStatus” that evaluates if any Critical checks fail:
=LET(statuses, tblChecks[Status], severities, tblChecks[Severity], criticalFail, SUMPRODUCT((statuses="FAIL")*(severities="Critical")), IF(criticalFail>0, "DO NOT TRUST - CHECK INPUTS", "OK"))Format this cell with conditional formatting so it turns red on failure.
Operational usability: make the workbook easy to run repeatedly
Provide a runbook inside the file
Operational scale requires handoffs. Put a short runbook at the top of SYS_Notes or IN_Raw:
Step 1: Paste/export file into IN_Raw staging table (or update source path)
Step 2: Refresh data
Step 3: Check SYS_Checks (must be all PASS for Critical)
Step 4: Use OUT_Exceptions to resolve issues
Step 5: Review OUT_Dashboard KPIs
This reduces tribal knowledge and prevents “it worked on my machine” behavior.
Use consistent time logic and a single calendar reference
Operational reporting often breaks around week boundaries, fiscal calendars, and holidays. Even if you already have a calendar table, the design principle here is: all time grouping should reference one calendar table and one definition of week/month/fiscal period. Avoid mixing ad hoc WEEKNUM logic in multiple places. Store the period attributes once and reuse them everywhere.
Design for safe filtering and printing
Users will filter tables, copy views into emails, and print. Make outputs resilient:
Keep slicers/filters in a dedicated control area.
Use consistent number formats (units, currency, percentages) and avoid mixing in the same column.
For printable views, create a dedicated OUT_Print sheet rather than printing the dashboard directly.
Change management: evolve the workbook without breaking it
Versioning inside the workbook
Operational files evolve. Add a small version table in SYS_Notes:
Version number
Date
Change summary
Changed by
This helps teams understand why numbers changed and supports rollback when a change introduces errors.
Build extension points: where new metrics can be added safely
Plan where new metrics will live so you don’t bolt them onto random cells later. Common extension points:
A Metrics definition table (MetricName, NumeratorField, DenominatorField, Format, Target)
An Aggregations area in MDL_Tables where new KPI columns can be added without changing output layouts
A dedicated OUT_Metrics sheet for new visuals before promoting them to the main dashboard
When the workbook is designed with extension points, scaling the process becomes additive rather than disruptive.
Practical example: turning a fragile tracker into a reliable operational tool
Scenario
You have a tracker that lists shipments with columns: Date, Site, Carrier, Units, OnTimeFlag. The dashboard shows On-Time % by site and a list of late shipments. Problems occur when a new carrier is added, when rows exceed the old formula ranges, and when someone sorts the raw data and breaks references.
Reliability redesign steps
Convert raw range to tblShipments and enforce column names and types.
Create MDL_Shipments with derived columns: WeekStart, Month, SiteGroup, LateReason (if available).
Create MDL_ShipmentsByWeek aggregated by Site and WeekStart with Units, LateUnits, OnTimePct.
Build OUT_Dashboard to chart MDL_ShipmentsByWeek and show KPIs from that table.
Build OUT_Exceptions as a table filtered to Late shipments with key identifiers and action fields.
Add SYS_Checks: duplicates, missing Site, unexpected OnTimeFlag values, date coverage.
Lock MDL and OUT sheets, leaving only IN sheets editable.
The result is a tracker that can grow from 5,000 to 500,000 rows with minimal structural change, and that signals when the data is incomplete or malformed.