Why mini-projects and checklists matter in operations spreadsheets
Operations spreadsheets fail less because of “bad formulas” and more because of inconsistent habits: someone pastes values over formulas, a new site uses different codes, a date column silently turns into text, or a “quick fix” becomes permanent. Mini-projects are short, repeatable builds that force you to practice reliable patterns under realistic constraints (messy inputs, changing requirements, multiple users). Checklists turn those patterns into a pre-flight routine so that every new tracker, forecast sheet, or dashboard update is produced the same way, even under time pressure.
This chapter gives you (1) mini-projects you can complete in 30–90 minutes each, (2) checklists you can reuse for builds and refresh cycles, and (3) the most common operational spreadsheet pitfalls—what they look like, why they happen, and how to prevent them.
Mini-project 1: “Daily Exceptions Board” (turn noise into a short action list)
Goal
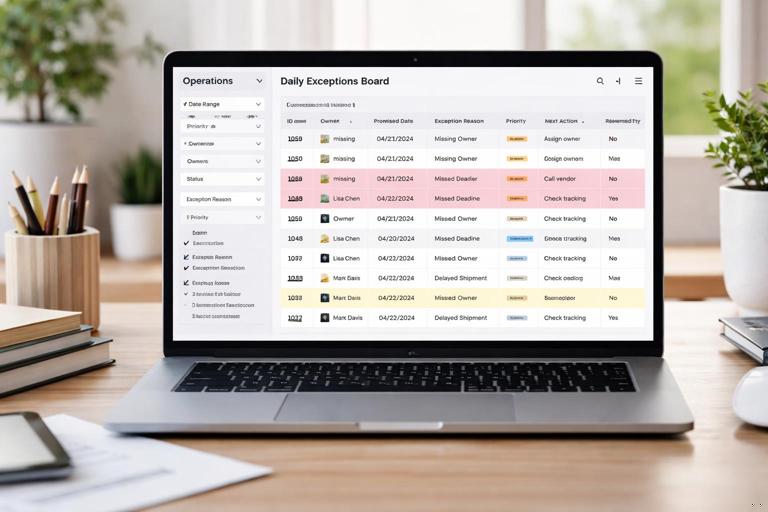
Create a daily view that shows only items requiring action (late, missing, out-of-range, or blocked), with an owner, due date, and a clear reason. The key operational skill here is designing for triage: the sheet should answer “What do I do next?” not “What is everything?”
Inputs
- A table of operational records (orders, tickets, work orders, shipments, cases—any row-based log).
- Columns typically available: ID, created date, promised date, status, owner, last update date, quantity, location, priority.
Step-by-step
- Step 1: Define exception rules in plain language. Write 5–8 rules as sentences, e.g., “Promised date is before today and status is not Closed,” “Owner is blank,” “Last update older than 3 days and status is In Progress,” “Quantity is zero or blank,” “Location is not recognized.” Keep them operational, not technical.
- Step 2: Create an “Exception Reason” column. Add a single column that outputs one primary reason per row. If multiple issues exist, choose a priority order (e.g., missing owner beats late date). This prevents a row from appearing multiple times and makes the board readable.
- Step 3: Create an “Exception Flag” column. A simple TRUE/FALSE (or Yes/No) that indicates whether the row is actionable today. This is what you filter on.
- Step 4: Build the Exceptions Board view. Create a separate sheet that displays only flagged rows and the columns needed to act: ID, owner, promised date, exception reason, priority, and a notes field. Keep it narrow.
- Step 5: Add a “Next Action” column. Use a controlled list (e.g., Call supplier, Reassign owner, Update ETA, Investigate data issue, Close item). This turns the board into a work queue.
- Step 6: Add a “Reviewed Today” checkbox or Yes/No. This prevents repeated work and supports daily standups.
- Step 7: Add a daily refresh routine. Decide who refreshes, when, and what “done” means (e.g., exceptions reduced below a threshold or all reviewed).
Practical example exception logic (pseudo-formula)
Priority order example for Exception Reason: 1) Missing Owner 2) Invalid Status 3) Late 4) Stale Update 5) Data Issue (qty/location) If Owner is blank => "Missing owner" Else if Status not in allowed list => "Invalid status" Else if PromisedDate < Today and Status <> "Closed" => "Late" Else if LastUpdate < Today-3 and Status = "In Progress" => "Stale update" Else if Qty is blank or 0 => "Missing/zero qty" Else if Location not recognized => "Invalid location" Else => ""Even if your workbook already uses robust calculation patterns, the operational insight is the priority ordering: it prevents “exception spam” and focuses the team on the most important fixes first.
Mini-project 2: “Shift Handover Log” (reduce tribal knowledge loss)

Goal
Create a structured handover log that captures what the next shift needs: open issues, blockers, and commitments. This mini-project trains you to design for human workflow: short entries, consistent categories, and fast filtering.
- Listen to the audio with the screen off.
- Earn a certificate upon completion.
- Over 5000 courses for you to explore!

Download the app
Step-by-step
- Step 1: Define handover categories. Typical categories: Safety, Quality, Staffing, Equipment, Supplier, Customer, System/IT, Other.
- Step 2: Define severity and required fields. For example: Severity (Low/Med/High), Area/Line, Owner, Due date/time, Status (Open/Monitoring/Resolved), and “What changed since last update?”
- Step 3: Add a “Handover Summary” view. Filter to Open/Monitoring only, sorted by severity then due time. Keep it printable or easy to read on a screen during a shift meeting.
- Step 4: Add a “Commitment” field. A short promise: “Supplier will confirm ETA by 14:00,” “Maintenance to inspect Line 2 before start-up.” This makes follow-up measurable.
- Step 5: Add a “Close-out proof” field. A short reference: ticket number, photo link, inspection record ID, email subject. This reduces disputes later.
Common pitfall to avoid in this mini-project
Do not let the log become a chat transcript. If entries are long, unstructured paragraphs, the next shift will miss critical items. Keep each row to one issue and enforce short, consistent fields.
Mini-project 3: “Cycle Count Variance Triage” (separate data issues from process issues)
Goal
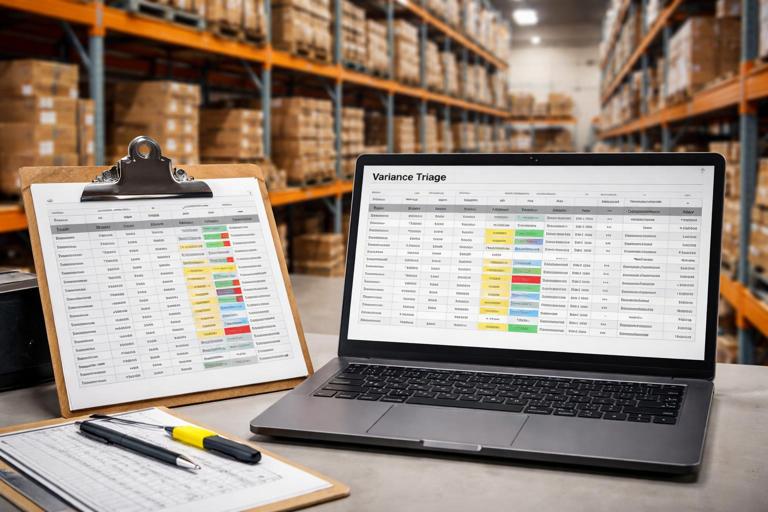
Build a triage sheet that classifies inventory variances into likely causes and routes them to the right owner (warehouse, receiving, production, master data). The skill here is operational classification: the spreadsheet should guide investigation rather than just report variance.
Step-by-step
- Step 1: Define variance bands. Example: 0, 1–2 units, 3–10 units, >10 units, or percentage-based bands for high-value items.
- Step 2: Add “Likely Cause” rules. Examples: “If item is new and location recently changed => master data,” “If variance is negative and recent shipments occurred => picking/ship confirm timing,” “If variance is positive and receiving happened yesterday => receiving putaway timing.”
- Step 3: Add “Investigation Checklist” per cause. A short list of steps for each cause category (e.g., check last receipt, check last pick, check location history, check unit of measure, check open transfers).
- Step 4: Add “Disposition” fields. Adjust inventory, recount, correct location, correct UOM, open ticket, escalate.
- Step 5: Add “Aging” and “Escalation” logic. If an item remains unresolved after X days, escalate to a supervisor or trigger a review.
Investigation checklist example (stored as text guidance)
- Receiving timing: verify receipt posted, verify putaway completed, confirm pallet moved to correct bin, confirm no duplicate receipt.
- Picking timing: verify pick confirmed, verify ship confirm, check backorders, check staging area counts.
- Master data: verify UOM, verify conversion factors, verify default bin, verify item status and pack size.
Mini-project 4: “Supplier On-Time Delivery Scorecard with Dispute Queue”
Goal
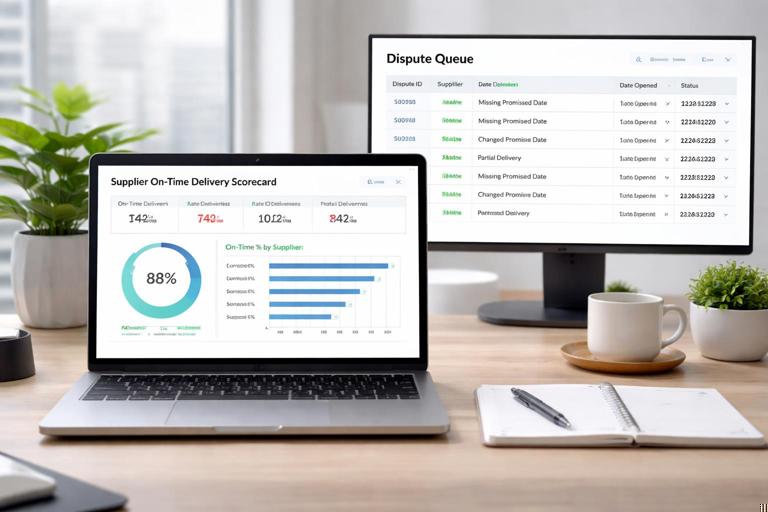
Create a scorecard that not only calculates on-time delivery but also isolates disputable records (e.g., missing promised date, changed promise date, partial deliveries) into a queue for review. The operational skill is separating measurement from data governance: you need a place to resolve disagreements before they pollute KPIs.
Step-by-step
- Step 1: Define the KPI rules. What counts as on-time? Early allowed? Partial shipments? Use a written definition and keep it stable.
- Step 2: Identify dispute triggers. Examples: promised date missing, promised date changed after ship date, receipt date missing, quantity received < quantity ordered, supplier name mismatch.
- Step 3: Create a “Dispute Reason” field. One reason per record, prioritized.
- Step 4: Create a “Dispute Queue” view. Filter to disputed records only, with columns needed to resolve: PO, line, supplier, buyer, promised date history reference, receipt reference.
- Step 5: Add “Resolution” fields. Resolution status (Open/Resolved), resolution note, resolved by, resolved date.
- Step 6: Ensure KPI excludes unresolved disputes. Your scorecard should clearly separate “confirmed performance” from “pending review.”
Build checklist: before you share an operational spreadsheet
Use this checklist every time you publish a tracker, scorecard, or dashboard to others. It is designed to prevent the most common breakages caused by real-world usage.
Data and structure
- All input columns have explicit formats (dates are dates, numbers are numbers, IDs are text where needed).
- No mixed-type columns (e.g., numbers and “N/A” in the same field).
- Required fields are enforced (or missing values are surfaced as exceptions).
- There is a clear place for manual inputs; users are not expected to type into calculated areas.
- Any “helper” columns are either hidden or clearly labeled as system fields.
Usability and workflow
- The main view answers a single operational question (triage, handover, backlog, performance, etc.).
- Filters and sorting do not break the workflow (e.g., no reliance on “current sort state” for correctness).
- Owners and due dates exist for actionable items.
- There is a defined refresh cadence and a named person/role responsible.
- There is a short “How to use” section on the first sheet (3–6 bullets).
Controls and protection
- Input cells are visually distinct from calculated cells.
- Critical formulas are protected from accidental overwrite (sheet protection or locked ranges where appropriate).
- External links are intentional and documented (no accidental links to personal files).
- File naming and versioning are defined (avoid “Final_v7_REALfinal.xlsx”).
Auditability
- Key metrics can be traced back to underlying rows (drill-down path exists).
- Any manual overrides are logged (who, when, why) or at least isolated in a dedicated column.
- Assumptions and definitions are written near the metric (not in someone’s head).
Refresh checklist: every time you update data or run a reporting cycle
Before refresh
- Confirm the reporting period and cut-off time (avoid mixing partial days/weeks).
- Confirm source files are complete (no missing sites, no partial exports).
- Save a timestamped backup copy before refresh if the workbook is business-critical.
During refresh
- Watch for row count changes that are unexpectedly large (a common sign of duplicate appends or missing filters).
- Spot-check a few known records (a “golden set”) to confirm IDs and dates match expectations.
- Check that time zones and date parsing behaved correctly (especially after CSV imports).
After refresh
- Review the exceptions queue first; resolve data issues before discussing KPIs.
- Check that totals reconcile to a known control number (e.g., total orders, total receipts).
- Confirm slicers/filters are reset to a standard view before sharing screenshots or PDFs.
Common operational spreadsheet pitfalls (and how to prevent them)
Pitfall 1: Silent date corruption (text dates, locale swaps, time zone drift)
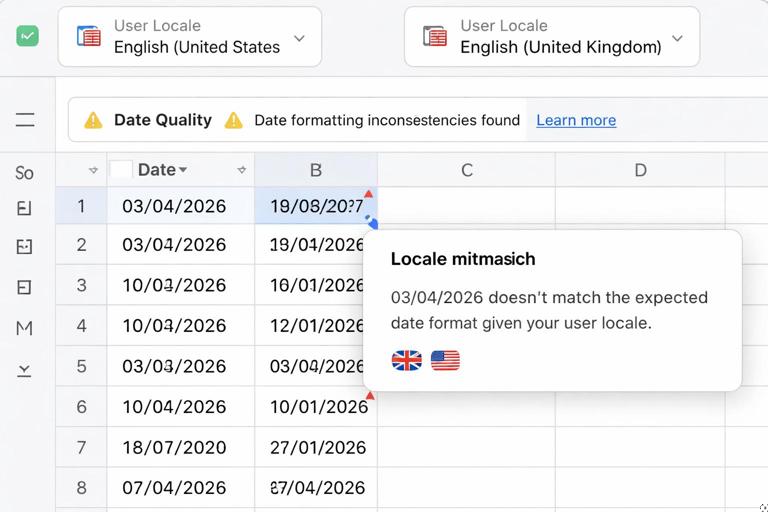
What it looks like: A promised date of “03/04/2026” becomes April 3 for one user and March 4 for another; sorting dates puts “10/01/2026” before “2/01/2026”; a CSV import shifts dates by one day.
Why it happens: Mixed locale settings, text dates imported from CSV, and inconsistent date-time handling.
Prevention: Standardize date formats in inputs, use explicit parsing during import, and add a “Date Quality” check that flags non-date values. Keep date-time fields separate from date-only fields when the time component matters operationally (e.g., SLA deadlines).
Pitfall 2: Duplicates from appends and copy-paste workflows
What it looks like: Counts double after a refresh; the same PO line appears twice; backlog suddenly spikes.
Why it happens: Users append the same file twice, paste new data under old data without clearing, or combine sources that share overlapping periods.
Prevention: Maintain a unique key for each record and run a duplicate check on that key every refresh. Add a control total (row count by day/site) and compare to last refresh. If you must allow manual paste, provide a “Paste Here” staging area and a clear “Clear staging” button/instruction.
Pitfall 3: Broken logic due to new statuses, new sites, or renamed codes
What it looks like: Items disappear from views; exceptions stop triggering; a new status “Pending QA” isn’t included in “Open” logic; a new warehouse code is treated as invalid.
Why it happens: Hard-coded lists and assumptions that don’t evolve with the business.
Prevention: Keep controlled lists in one place and add a “New/Unknown Values” report that shows any status/site codes not recognized. Operationally, treat unknown codes as exceptions that must be triaged, not ignored.
Pitfall 4: Overwriting formulas with values (especially during firefighting)
What it looks like: A column that used to calculate now contains static numbers; future rows show blanks; metrics drift over time.
Why it happens: Someone copies a range and pastes values to “fix” a problem quickly, or drags a value down a calculated column.
Prevention: Protect calculated ranges, visually separate inputs, and provide a dedicated override column if overrides are a legitimate business need. Add a quick “formula integrity” check: sample a few cells and confirm they still contain formulas.
Pitfall 5: Hidden filters and accidental partial views
What it looks like: A user says “we only have 12 open orders,” but a filter is hiding 200 rows; a pivot is filtered to one site; screenshots are taken from a filtered state.
Why it happens: Excel remembers filter states; people reuse the same file for multiple audiences.
Prevention: Create a “Standard View” routine: clear filters, reset slicers, and set a default sort before sharing. Add a visible indicator (e.g., a cell that displays “Filters ON” when any filter is active) using built-in filter status checks or a simple manual checklist step.
Pitfall 6: Totals that don’t reconcile (no control numbers)
What it looks like: KPI totals change week to week for reasons no one can explain; the dashboard says 1,240 units shipped but the system report says 1,198.
Why it happens: Missing cut-off definitions, inconsistent inclusion rules, or data refresh pulling different time windows.
Prevention: Define a control total and reconcile every cycle: total rows, total quantity, total dollars, or total IDs by period. Store the control totals with the report date so you can detect drift early.
Pitfall 7: “One cell to rule them all” (fragile single-point-of-failure logic)
What it looks like: A single complex formula drives many outputs; when it breaks, everything breaks; only one person understands it.
Why it happens: Over-optimization and building for cleverness instead of maintainability.
Prevention: Break logic into readable steps, add comments/labels, and create a small test area with known cases (see the next pitfall). Favor clarity over minimal cell count in operational tools.
Pitfall 8: No test cases (you don’t know it’s wrong until operations hurts)
What it looks like: A change is made and the sheet “seems fine,” but exceptions stop appearing or KPIs shift subtly.
Why it happens: Spreadsheet changes are rarely tested like software.
Prevention: Maintain a tiny “test deck” of 10–20 representative rows (late, on-time, missing owner, partial receipt, etc.) with expected outputs. After any change, confirm outputs match expectations. This can be a hidden sheet used only by maintainers.
Pitfall 9: Manual steps that are not written down (key-person risk)
What it looks like: Only one analyst knows the refresh sequence; when they are out, the report is late or wrong.
Why it happens: Informal processes and “I’ll remember” workflows.
Prevention: Write a one-page runbook: where files come from, where they go, refresh order, validation checks, and how to handle common errors. Put it inside the workbook as a “Runbook” sheet.
Pitfall 10: Performance collapse (slow recalculation, huge files, unstable sharing)
What it looks like: Opening takes minutes, filters lag, saving freezes, collaboration becomes impossible.
Why it happens: Too many volatile functions, excessive formatting, unnecessary columns, or storing years of history in a file meant for daily operations.
Prevention: Archive old periods, limit formatting to what supports decisions, and keep operational tools focused on the time horizon they manage. Separate “history warehouse” from “daily cockpit.”
Operational “definition of done” for a spreadsheet tool
In operations, a spreadsheet is done when it reliably supports a recurring decision or workflow. Use this definition-of-done checklist to decide whether a tool is ready for production use.
- Decision clarity: The primary view makes the next action obvious (owner, due date, reason).
- Exception handling: Unknown values, missing fields, and disputes are surfaced in a queue.
- Repeatability: A refresh cycle can be executed by someone else using the runbook.
- Change tolerance: New statuses/sites don’t silently break outputs; they trigger review.
- Traceability: Metrics can be traced to rows; overrides are visible.
Practice pack: quick drills to build reliability habits
Drill 1: Build a “golden record” spot-check list
Create a small list of 10–15 IDs that you can always verify in the source system (or a trusted export). Each refresh, confirm those records match on key fields (status, dates, quantities). This drill trains you to validate with reality, not just with internal spreadsheet consistency.
Drill 2: Create an “unknown values” report
Pick one categorical field that often changes (status, site, carrier, reason code). Create a view that lists any values not in your recognized list. Operationally, this becomes an early-warning system for process changes and master data drift.
Drill 3: Simulate a bad paste
Intentionally paste a column with mixed types (numbers plus text), then run your checks. If your tool doesn’t flag the issue, add a check. This drill makes your workbook resilient to the most common real-world user behavior.