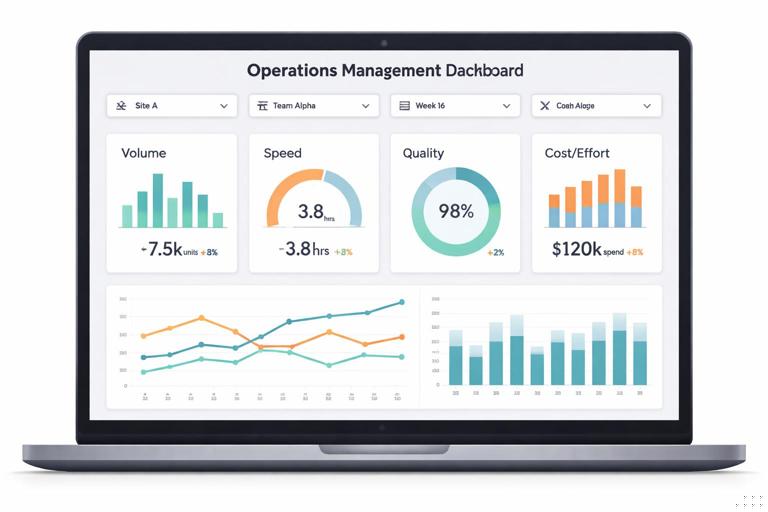
What “Management-Ready” Means in an Operations Dashboard
A management-ready dashboard is not a collection of charts; it is a decision interface. It answers a small set of recurring questions with consistent definitions, minimal interaction cost, and clear accountability. In operations, those questions usually fall into four categories: volume (how much work is flowing), speed (how fast it moves), quality (how often it fails), and cost/effort (how much it consumes). A management-ready dashboard makes these measurable, comparable across time, and filterable by the dimensions leaders actually use (site, product line, customer segment, team, shift, supplier, etc.).
To be management-ready, your dashboard should meet these criteria:
- Single version of KPI definitions: every KPI has a documented numerator, denominator, time basis, inclusion/exclusion rules, and rounding.
- Stable layout and predictable interactions: slicers and timelines behave consistently; the same filters apply to all visuals.
- Clear “as of” date and refresh status: leaders must know what period they are looking at.
- Exception-first design: highlight what needs attention (missed SLA, backlog growth, defect spikes) rather than only reporting totals.
- Drill-down path: from KPI to the underlying slice (team/site/week) and then to a detail list when needed.
This chapter focuses on building that interface using PivotTables, Slicers, and explicit KPI definitions, so the dashboard is fast, filterable, and defensible in reviews.
Designing KPI Definitions Before Building the Pivot
PivotTables are excellent at summarizing, but they will faithfully summarize bad definitions. Before you build anything, write KPI definitions in a small “KPI Dictionary” section (a worksheet or a structured table) that management can sign off on. Treat it like a contract.
KPI definition template (use this structure)
- KPI Name: e.g., On-Time Shipment Rate
- Business question: “What % of shipments left on or before the promised ship date?”
- Numerator: Count of shipments where ActualShipDate <= PromisedShipDate
- Denominator: Count of shipments with a PromisedShipDate in the selected period (exclude cancelled)
- Time basis: by PromisedShipDate (not ActualShipDate)
- Filters / exclusions: exclude cancelled, exclude test orders, include only ShipMethod in {Ground, Air}
- Grain: shipment line vs shipment header (choose one)
- Target: 95% monthly, 97% weekly (example)
- Owner: Ops Manager, Logistics Lead
- Refresh cadence: daily at 7am
Two common dashboard failures come from unclear time basis and unclear grain. For example, “On-time” can be measured by promised date or by actual ship date; “defect rate” can be per unit, per order, or per inspection. Decide explicitly, document it, and build the Pivot to match.
- Listen to the audio with the screen off.
- Earn a certificate upon completion.
- Over 5000 courses for you to explore!

Download the app
Operational KPI examples that work well with PivotTables
- Backlog: open items count, open quantity, open value
- Throughput: completed items per day/week
- Cycle time: average days from Created to Completed (often needs careful handling of blanks/outliers)
- SLA compliance: % completed within SLA threshold
- First-pass yield: % passing without rework
- Supplier on-time: % POs received by requested date
For management-ready dashboards, prefer KPIs that can be explained in one sentence and audited back to rows.
PivotTable Architecture for Dashboards
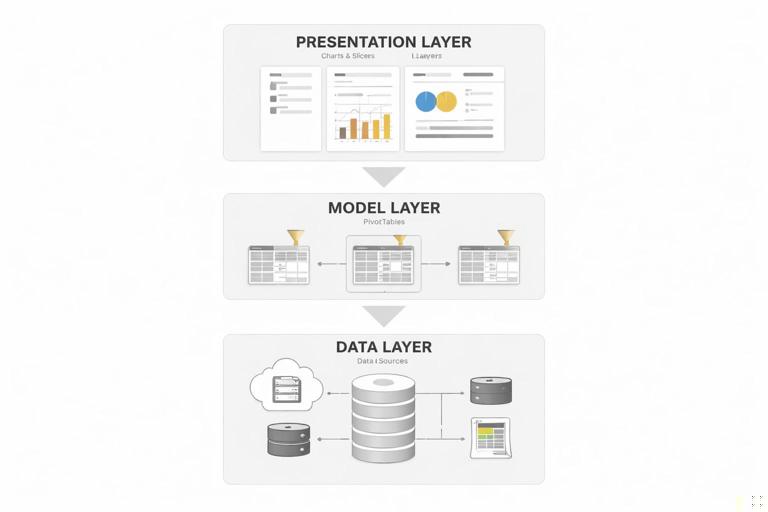
Think of your dashboard as three layers:
- Data layer: your cleaned, consolidated dataset (already handled in earlier chapters).
- Model layer: PivotTables (and optionally the Data Model) that aggregate the dataset into KPI-ready summaries.
- Presentation layer: charts, KPI cards, slicers, and formatting.
For reliability and speed, build multiple PivotTables that each serve a clear purpose (e.g., one for trend by week, one for breakdown by site, one for top exceptions). Then connect slicers to all relevant pivots so the dashboard filters as one unit.
When to use a standard PivotTable vs the Data Model
If you have a single flat table and straightforward aggregations (counts, sums, averages), a standard PivotTable is sufficient. If you need relationships between multiple tables (e.g., a Date table, a Site table, a Product table) or distinct counts across large datasets, consider using the Data Model. The dashboard techniques (slicers, pivot charts, KPI cards) remain similar, but measures behave differently. If you are not using the Data Model, keep the dataset denormalized (one table) and ensure all dimensions needed for slicing are present as columns.
Step-by-Step: Build a PivotTable-Based Dashboard Backbone
This walkthrough assumes you have a single clean table named OpsData with columns like Date, Week, Site, Team, Status, CreatedDate, CompletedDate, SLAHours, IsWithinSLA, Quantity, Value, DefectFlag, etc. Adjust to your dataset.
Step 1: Create a “Pivot” worksheet and build the first PivotTable
1) Click inside the OpsData table. 2) Insert > PivotTable. 3) Place it on a new worksheet named Pivot. 4) In the PivotTable Fields pane, build a trend view:
- Rows: Week (or Date grouped to weeks)
- Values: Count of records (e.g., WorkItems), Sum of Quantity, Average of CycleTimeDays (if present)
- Filters (optional): Status
Immediately set formatting: right-click values > Value Field Settings > Number Format. Use consistent formats (whole numbers for counts, one decimal for days, percent for rates). Management-ready dashboards fail when numbers look inconsistent or “too precise.”
Step 2: Add a KPI Pivot for rates (SLA %, On-time %, Yield)
Create a second PivotTable on the same Pivot sheet (leave space between pivots). Build it so it can feed KPI cards:
- Rows: (none) or a single field like Site if you want a breakdown
- Values: Sum of IsWithinSLA (if it is 1/0), Count of WorkItems
Then add a calculated field or use a helper column in the source data to compute the rate. A robust pattern is to store flags as 1/0 in the data (e.g., IsWithinSLA = 1 if within SLA else 0). Then the Pivot can compute:
- SLA Compliance = Sum(IsWithinSLA) / Count(WorkItems)
In a standard PivotTable, you can create a calculated field (PivotTable Analyze > Fields, Items & Sets > Calculated Field) such as:
Name: SLA_ComplianceRate Formula: =IsWithinSLA/WorkItemsHowever, calculated fields can be limited depending on your setup. A more predictable approach is to add a helper column in OpsData called SLA_ComplianceContribution equal to IsWithinSLA, and then compute the rate outside the pivot using GETPIVOTDATA (covered later in this chapter). Choose the approach that is easiest to audit in your environment.
Step 3: Add an “Exceptions” Pivot (Top problems)
Management dashboards should quickly show what is driving misses. Create a pivot that lists top exception categories:
- Rows: ExceptionReason (or DefectType, DelayReason, Supplier)
- Values: Count of WorkItems (or Sum of Value)
- Filters: Week/Date, Site, Team
Sort descending by the value. Optionally apply a Value Filter (Top 10) to keep the list readable.
Step 4: Create PivotCharts for trend and composition
For the trend pivot, insert a PivotChart (line chart for weekly trend). For the exceptions pivot, use a bar chart. Keep chart types conventional: line for time, bar for ranking, stacked bar for composition. Avoid complex chart types that require explanation.
Slicers and Timelines: Making the Dashboard Interactive Without Breaking It
Slicers are the control panel of a management-ready dashboard. The key is consistency: slicers must filter all relevant pivots and charts, and they must be placed and formatted so users understand what they control.
Step-by-step: Add slicers and connect them to all pivots
1) Click any PivotTable. 2) PivotTable Analyze > Insert Slicer. 3) Choose the fields leaders use: Site, Team, ProductLine, Customer, Status. 4) If you have a Date field, also insert a Timeline (PivotTable Analyze > Insert Timeline) for Date.
Now connect slicers to all PivotTables: 1) Click a slicer. 2) Slicer > Report Connections (or PivotTable Connections). 3) Check every PivotTable that should respond. Repeat for each slicer and the timeline.
This is the most important reliability step in a Pivot-based dashboard. If one pivot is not connected, you will show contradictory numbers on the same page.
Slicer design rules for management use
- Put slicers in a dedicated control area (top or left) and keep them aligned.
- Use 1–2 columns in slicers to reduce scrolling.
- Turn on “Hide items with no data” where appropriate to prevent dead-end selections.
- Use a Timeline for Date rather than a date slicer; it is faster for executives to understand.
- Provide a visible “Clear Filters” instruction via a small shape or note near slicers (not as an image text requirement; this is in-sheet text).
KPI Cards: Turning Pivot Outputs into Executive-Friendly Metrics
Leaders often want “big numbers” (KPI cards) plus a small set of supporting trends. PivotTables do not natively create KPI cards, but you can build them reliably using GETPIVOTDATA so the cards always pull the correct filtered values.
Step-by-step: Build a KPI card using GETPIVOTDATA
1) Create a Dashboard sheet. 2) Decide where the KPI card will sit (e.g., cell B3 for the number, B4 for the label). 3) Click the PivotTable cell that contains the value you want (e.g., total WorkItems count). 4) Type = and click that pivot value cell. Excel will generate a GETPIVOTDATA formula.
Example (your field names will differ):
=GETPIVOTDATA("Count of WorkItemID",Pivot!$A$3)Format the KPI number (large font, bold). Then build the rate KPI similarly, either pulling a pivot-calculated rate or dividing two GETPIVOTDATA results:
=GETPIVOTDATA("Sum of IsWithinSLA",Pivot!$H$3)/GETPIVOTDATA("Count of WorkItemID",Pivot!$H$3)Format as percentage with one decimal or zero decimals depending on how the KPI is used in meetings.
Make KPI cards resilient to layout changes
GETPIVOTDATA references a pivot anchor cell (like Pivot!$A$3). If you move the pivot, the formula can break. Two practical patterns reduce risk:
- Keep pivots on a dedicated sheet and do not rearrange them after dashboard wiring is complete.
- Name the pivot table (PivotTable Analyze > PivotTable Name) and keep a stable anchor cell. Even if you add fields, avoid shifting the pivot start cell.
Add variance-to-target and status color
A KPI without a target is just a number. Store targets in a small table (e.g., KPI_Targets with columns KPIName, TargetValue, RedThreshold, AmberThreshold). Then compute variance and status next to the KPI card.
Example logic for SLA compliance status (conceptual):
- Green if SLA% >= Target
- Amber if SLA% between AmberThreshold and Target
- Red if SLA% < AmberThreshold
Apply conditional formatting to the KPI card cell based on the computed status. Keep the color semantics consistent across the dashboard (red = needs attention, amber = watch, green = on track).
Building a Coherent Dashboard Layout (So It Survives Meetings)
Management dashboards are judged in live conversations. Layout must support scanning and drill-down without hunting.
A practical layout blueprint
- Row 1–3: Title area (dashboard name), “As of” date, refresh timestamp, and key slicers.
- Row 4–8: KPI cards (3–6 KPIs max), each with target and variance.
- Middle section: Trend chart (weekly throughput, backlog, SLA rate).
- Right or lower section: Exceptions chart (top delay reasons, top defect types) and a small table for “Top 10” items.
Keep whitespace and alignment. Use consistent fonts and number formats. Avoid heavy gridlines; let the visuals carry structure.
PivotTable Techniques That Improve Trust and Auditability
Use explicit time grouping (and verify it)
If you group dates in a PivotTable (right-click a date > Group), verify the grouping matches your KPI definition (weeks starting Monday vs Sunday, fiscal months vs calendar months). If your organization uses fiscal periods, consider adding a FiscalPeriod column in the data and using that instead of grouping.
Show both rate and volume
Rates can hide scale. A 90% SLA on 10 items is different from 90% on 10,000. For every rate KPI, display a companion volume KPI (e.g., Total Items, Total Orders, Total Lines). This is easy with PivotTables: add both metrics to Values and pull both into KPI cards.
Use “Show Values As” carefully
PivotTables offer “Show Values As” (e.g., % of Grand Total, Difference From, Running Total). These are useful for management views, but they can confuse audits if not documented. If you use them, reflect it in the KPI definition (e.g., “Backlog growth is week-over-week difference in open items”).
Control blanks and “(blank)” categories
Executives will ask what “(blank)” means. Decide whether blanks are valid (e.g., missing DelayReason) or errors. If blanks represent missing data, treat them as an exception category and show them explicitly in the Exceptions pivot so the data quality issue is visible.
Common Dashboard KPIs and How to Implement Them with Pivots
Backlog (open items)
Definition example: count of items where Status is not Completed/Cancelled as of the selected date range. Implementation: use Status in Filters or Rows and include only open statuses. If you need “as of today” backlog regardless of date range, you may need a dedicated snapshot date field or a separate pivot that ignores the timeline; be explicit about which view you are presenting.
Throughput (completed items)
Definition example: count of items completed in the selected period, based on CompletedDate. Implementation: ensure the pivot uses CompletedDate (or a CompletedWeek field) as the time axis, not CreatedDate.
SLA compliance
Definition example: % of completed items within SLA threshold, measured on CompletedDate. Implementation: store IsWithinSLA as 1/0 and compute Sum(IsWithinSLA)/Count(CompletedItems). Always show the denominator (completed count).
Cycle time
Definition example: average days from CreatedDate to CompletedDate for completed items. Implementation: compute CycleTimeDays in the data, then use Average in the pivot. Consider also showing median cycle time if outliers are common; if you cannot compute median in a standard pivot, provide a separate summary method and document it clearly.
Step-by-Step: Create a Drill-Down Experience Without Complex Tools
Management often wants to click from a KPI to “what’s behind it.” You can provide a simple drill-down path using PivotTables and a detail sheet.
Step 1: Enable double-click drill-down to rows
By default, double-clicking a PivotTable value creates a new sheet with the underlying rows. This is useful but can create many temporary sheets. Set expectations with users: drill-down is for investigation, not for routine navigation.
Step 2: Build a controlled “Detail View” using a PivotTable filter
Create a PivotTable that lists individual items (e.g., WorkItemID, Customer, AgeDays, Owner) and place it on a “Detail” sheet. Use the same slicers connected to it. Then, when a leader filters Site/Team/Week on the dashboard, the Detail sheet automatically shows the corresponding list. This provides a stable drill-down without generating new sheets.
To make the detail list readable:
- Rows: WorkItemID (or OrderID)
- Values: Max of AgeDays (or show as a value), Sum of Quantity, etc.
- Additional row fields: Customer, Owner, Status (keep to 2–4 fields to avoid overly wide pivots)
KPI Governance: Keeping Definitions Stable as the Dashboard Evolves
Operations dashboards tend to accumulate “just one more metric.” Without governance, definitions drift and meetings become debates about numbers. Use a lightweight governance approach:
- KPI Dictionary table lives in the workbook and is reviewed when changes occur.
- Change log: record what changed, why, and when (e.g., “Exclude internal transfers from On-Time metric starting 2026-01-01”).
- Owner and approver: each KPI has a business owner and a reporting owner.
- Versioning: if a KPI definition changes materially, consider showing a note or splitting historical reporting to avoid misleading comparisons.
When KPIs are defined and governed, PivotTables and slicers become a reliable delivery mechanism rather than a fragile spreadsheet artifact.