Why Lighthouse matters for PWA quality gates
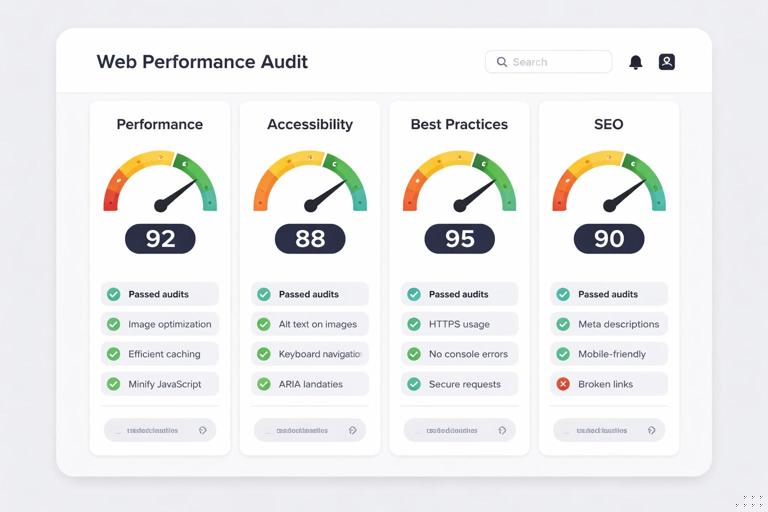
Lighthouse is an automated auditing tool that produces measurable scores and diagnostics for key user-facing qualities: performance, accessibility, best practices, SEO, and (when applicable) progressive web app readiness. In a PWA workflow, Lighthouse is most valuable when you treat it as a repeatable “quality gate”: a set of numeric thresholds and required checks that must pass before a build can be merged, released, or promoted to production.
A “quality gate” is not just a score target. It is a contract: which audits must pass, which scores must meet minimums, which pages must be tested, under what device/network conditions, and how failures are handled. The goal is to prevent regressions (for example, a new dependency increasing JavaScript payload) and to make improvements visible over time.
Two practical principles make Lighthouse effective as a gate: (1) run it consistently (same URLs, same configuration, same environment), and (2) gate on stable metrics and pass/fail audits rather than chasing a single overall score.
What Lighthouse measures (and what it does not)
Scores vs. audits vs. opportunities
Lighthouse reports categories with scores from 0–100. Under each category are individual audits. Some audits are binary (pass/fail), others are numeric (e.g., “Largest Contentful Paint”), and some are informational. “Opportunities” estimate potential savings (e.g., “Reduce unused JavaScript”). “Diagnostics” explain issues without a direct score impact.
For quality gates, prefer: (a) Core Web Vitals and other lab metrics as numeric thresholds, and (b) critical pass/fail audits that represent user harm or policy requirements (e.g., accessibility basics, HTTPS, no mixed content, correct viewport).
- Listen to the audio with the screen off.
- Earn a certificate upon completion.
- Over 5000 courses for you to explore!

Download the app
Lab data vs. field data
Lighthouse runs in a controlled environment and produces lab metrics. This is excellent for catching regressions during development and CI. However, lab results are not the same as real-user field data. A robust gate strategy uses Lighthouse to prevent regressions and uses real-user monitoring (RUM) separately to validate outcomes in production. In this chapter, the focus is on Lighthouse as the automated gate in development and CI.
Key performance metrics you will see
- Largest Contentful Paint (LCP): how quickly the main content appears.
- Cumulative Layout Shift (CLS): visual stability; unexpected layout movement.
- Total Blocking Time (TBT): lab proxy for interactivity problems caused by long tasks on the main thread.
- First Contentful Paint (FCP): time until the first text/image is painted.
- Speed Index: how quickly content is visually displayed.
For gating, LCP, CLS, and TBT are typically the most actionable and stable indicators of user impact.
Defining measurable PWA quality gates
Choose what to gate: categories, metrics, and critical audits
A practical gate definition usually includes:
- Minimum category scores (Performance, Accessibility, Best Practices, SEO). These are easy to communicate but can be noisy because a single audit can shift the score.
- Explicit metric thresholds (e.g., LCP ≤ 2.5s, CLS ≤ 0.1, TBT ≤ 200ms). These are more stable and map to user experience.
- Required pass/fail audits (e.g., “Document has a meta viewport tag”, “Uses HTTPS”, “Avoids deprecated APIs”).
- Scope of pages: not just the home page. Include representative routes: a listing page, a detail page, an authenticated page (if possible), and a heavy interaction page.
- Test conditions: device emulation, CPU throttling, network throttling, and whether you test cold vs. warm cache.
For PWAs, ensure your gate covers installability-related checks and offline readiness checks where applicable, but avoid relying on a single “PWA score” as the only gate. Instead, gate on the underlying audits that matter to your product.
Example gate policy (starter)
Use this as a starting point and adjust to your app’s reality:
- Performance: score ≥ 80; LCP ≤ 2.5s; CLS ≤ 0.1; TBT ≤ 300ms.
- Accessibility: score ≥ 90; no failures for color contrast, form labels, and document title.
- Best Practices: score ≥ 90; no mixed content; no console errors; uses HTTPS.
- SEO: score ≥ 90; indexable; valid robots directives.
- PWA-related audits: correct viewport; content sized correctly; fast enough for offline/poor network scenarios (as defined by your routes); installability checks pass where applicable.
Make the gate explicit in your repository (e.g., a JSON config file) so it can be reviewed like code.
Set thresholds based on baselines, not wishes
If you set thresholds far above your current baseline, the gate will block everything and people will disable it. Instead:
- Run Lighthouse on your current main branch for several representative pages.
- Record median values across 3–5 runs per page (to reduce noise).
- Set initial thresholds slightly better than the baseline (e.g., 10–15% improvement target) or enforce “no regression” first.
- Increase thresholds gradually as you ship improvements.
Running Lighthouse locally with consistent settings
Use Lighthouse in Chrome DevTools for quick iteration
DevTools Lighthouse is ideal for interactive debugging: you can run an audit, click into failing audits, and inspect the page. For consistent results:
- Use an incognito window to reduce extension interference.
- Close other tabs and heavy apps to reduce CPU noise.
- Run multiple times and look at trends, not a single run.
- Test the same URL with the same settings each time.
DevTools is not a quality gate by itself; it is the fastest way to understand why a gate fails.
Use Lighthouse CLI for repeatability
The Lighthouse CLI is better for scripting and for matching CI behavior. A typical command looks like:
npx lighthouse https://localhost:4173/ --output html --output json --viewKey options you will commonly use:
- --output: generate JSON for automation and HTML for human review.
- --preset: choose a preset (e.g., “desktop” or “mobile”).
- --throttling and --throttling-method: control network/CPU simulation.
- --chrome-flags: run Chrome headless, disable GPU, set window size, etc.
For local development, you can run against a local server. For CI, you typically run against a preview deployment or a locally started server within the pipeline.
Stabilize runs: multiple iterations and medians
Lighthouse results vary due to timing, CPU scheduling, and network simulation. A practical approach is to run each URL 3–5 times and take the median for key metrics. Some tooling does this for you; if you script it yourself, store each run’s JSON and compute medians for LCP/CLS/TBT.
Automating gates with Lighthouse CI (LHCI)
What LHCI adds
Lighthouse CI (often abbreviated LHCI) wraps Lighthouse to make it CI-friendly: it can run audits on multiple URLs, assert thresholds, store results, and compare runs over time. It is designed for “quality gate” workflows: fail the build when assertions fail.
Step-by-step: add LHCI to a project
The exact commands vary by stack, but the workflow is consistent.
1) Install and initialize configuration
npm install --save-dev @lhci/cliCreate a configuration file (commonly lighthouserc.json) to define URLs and assertions. Example:
{ "ci": { "collect": { "numberOfRuns": 3, "url": [ "http://localhost:4173/", "http://localhost:4173/products", "http://localhost:4173/products/123" ] }, "assert": { "assertions": { "categories:performance": ["error", {"minScore": 0.8}], "categories:accessibility": ["error", {"minScore": 0.9}], "categories:best-practices": ["error", {"minScore": 0.9}], "categories:seo": ["error", {"minScore": 0.9}], "largest-contentful-paint": ["error", {"maxNumericValue": 2500}], "cumulative-layout-shift": ["error", {"maxNumericValue": 0.1}], "total-blocking-time": ["error", {"maxNumericValue": 300}] } }, "upload": { "target": "temporary-public-storage" } }}This example gates on category scores and on explicit metrics. It also audits multiple routes, which is critical because a PWA can be fast on the home page but slow on a detail page with heavy rendering.
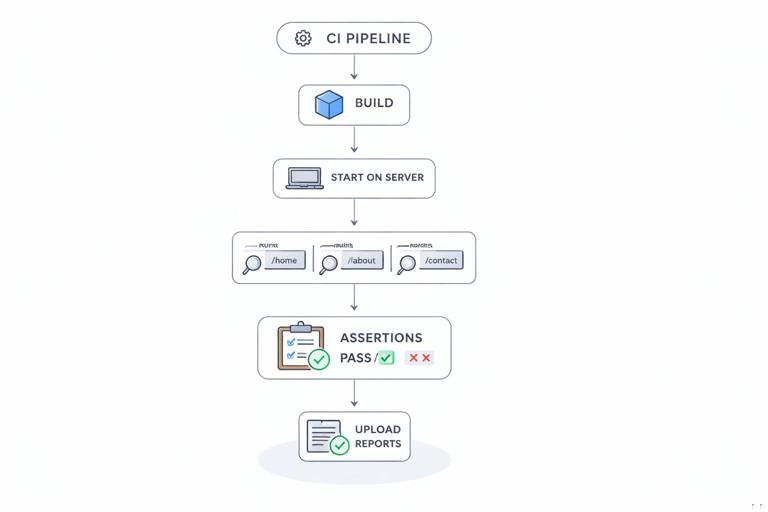
2) Ensure CI can start the app and serve stable URLs
LHCI needs URLs to test. In CI you typically:
- Install dependencies
- Build the app
- Start a local server on a known port
- Run LHCI against that server
- Stop the server
Example scripts:
{ "scripts": { "build": "your-build-command", "start:ci": "your-static-server-command", "lhci": "lhci autorun" }}lhci autorun will run collect + assert (and upload if configured). If your app requires environment variables (API base URL, feature flags), set them in CI so the audited pages represent real behavior.
3) Run in CI with deterministic settings
To reduce variance:
- Prefer headless Chrome with consistent flags.
- Pin Node and Chrome versions in CI if possible.
- Use the same LHCI config across branches.
- Audit against production-like builds (minified, code-split, same CDN settings if applicable).
If you see flaky failures, increase numberOfRuns, gate on medians, and consider slightly looser thresholds while you stabilize the pipeline.
Choosing the right pages and scenarios for PWA gates
Route selection strategy
Pick URLs that represent distinct performance and UX profiles:
- Entry route: the first page users land on (often “/”).
- Content-heavy route: a list or feed with images/cards.
- Detail route: a page with dynamic data and interaction.
- Critical flow route: checkout, booking, or form submission page (if it can be tested safely).
Include at least one route that exercises your heaviest UI components. If you only test the home page, you will miss regressions in the pages users spend time on.
Authenticated pages and test accounts
Lighthouse can audit authenticated pages, but you must provide a way to reach them in CI. Common approaches include:
- Use a dedicated test environment with a stable test account.
- Use a pre-authenticated URL if your system supports it safely.
- Use scripted login with a tool that can set cookies before Lighthouse runs (advanced).
If authentication is complex, start by gating public routes and add authenticated routes later. The key is to avoid “pretend coverage” where important pages are excluded indefinitely.
Cold vs. warm cache runs
Performance can differ dramatically between a cold start (first visit) and a repeat visit. Decide what you want to gate:
- Cold start gate: ensures first-time users get acceptable performance.
- Repeat visit gate: ensures returning users benefit from caching and don’t regress due to cache-busting or oversized updates.
In practice, many teams gate on cold start in CI because it is easier to standardize. If repeat-visit performance is a key product promise, add a second run that simulates a warm cache by re-auditing the same URL without clearing storage (requires careful setup to avoid inconsistent state).
Interpreting failures: turning audits into fixes
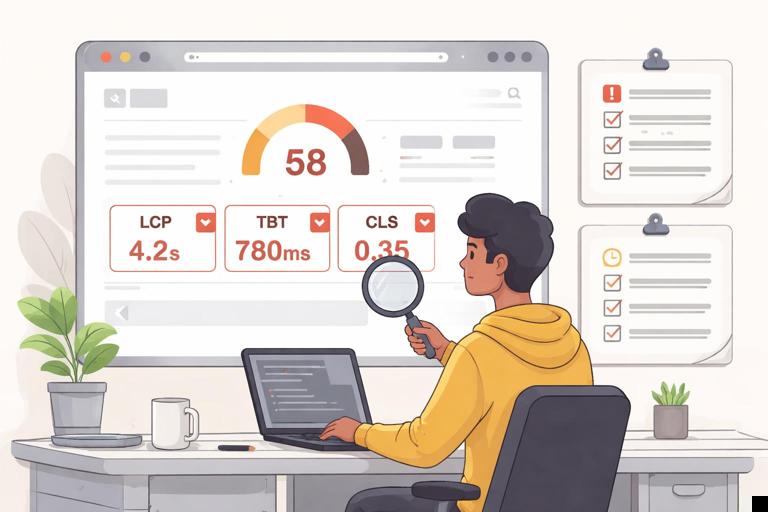
Read the audit details, not just the score
When a gate fails, focus on the specific failing audits and metrics. A performance score drop could be caused by one large long task, a new third-party script, or a layout shift introduced by an image without dimensions. The Lighthouse report links each issue to evidence (e.g., which element was the LCP candidate, which scripts caused main-thread blocking).
Common failure patterns and how to respond
- LCP regression: often caused by slower server response, render-blocking resources, large hero images, or heavy client rendering. Action: identify the LCP element in the report and optimize its delivery path (reduce size, preload critical resource, simplify render work).
- High TBT: usually due to heavy JavaScript execution and long tasks. Action: inspect the “Main-thread work” and “Long tasks” diagnostics; reduce bundle size, defer non-critical work, split code, or remove expensive libraries.
- CLS issues: caused by late-loading images, fonts, or injected UI. Action: reserve space (width/height), avoid inserting content above existing content, and manage font loading behavior.
- Accessibility failures: missing labels, low contrast, incorrect heading structure. Action: treat these as correctness bugs; fix the underlying markup and re-run.
- Best Practices failures: console errors, deprecated APIs, insecure requests. Action: fix errors first; they can mask other issues and reduce trust in the audit.
For gating, it helps to classify failures into “must fix now” (e.g., accessibility violations, console errors) and “improvement backlog” (e.g., an opportunity suggesting a small saving). Your assertions should reflect that classification.
Making gates developer-friendly
Fail with actionable output
A gate that fails without context wastes time. Ensure your CI artifacts include:
- The Lighthouse HTML report for each URL (easy to read).
- The JSON output (for deeper analysis and trend tracking).
- A short summary in CI logs: which assertions failed and by how much.
If your CI system supports it, upload reports as build artifacts and link them directly from the failing job.
Use budgets to prevent slow creep
Many regressions are gradual: a few kilobytes here, a new script there. Add “budgets” that cap key resources and metrics. Budgets can include:
- Maximum JavaScript total size for initial load
- Maximum number of network requests
- Maximum image bytes on key routes
Even if you do not enforce strict budgets immediately, tracking them helps you spot trends before they become emergencies.
Separate “merge gate” from “release gate”
Not every branch needs the strictest thresholds. A practical setup is:
- Merge gate: faster, fewer URLs, moderate thresholds, focuses on preventing regressions.
- Release gate: more URLs, more runs, stricter thresholds, possibly different device profiles.
This keeps developer feedback loops fast while still enforcing high standards before production.
Advanced: controlling variability and avoiding flaky gates
Pin the environment
Variability often comes from changing runtime conditions. Reduce it by:
- Using dedicated CI runners (or at least consistent machine types).
- Pinning versions of Node, dependencies, and Chrome where possible.
- Ensuring the audited server is not doing extra work (e.g., debug logging, source maps served to the browser).
Use consistent throttling and device profiles
Lighthouse can emulate mobile/desktop and apply CPU/network throttling. Decide which profile matches your users. If most users are on mid-range mobile devices, a mobile profile with CPU throttling is more realistic. Keep the profile consistent across runs so comparisons are meaningful.
Handle third-party scripts explicitly
Third-party tags can cause unpredictable performance. Options include:
- Audit with third-party scripts enabled (realistic, but noisier).
- Provide a “test mode” build that disables non-essential third-party scripts for merge gates, while keeping them enabled for release gates.
- Gate on metrics less sensitive to third-party variance (e.g., CLS and accessibility) while monitoring performance separately.
If you choose to disable scripts in test mode, document it clearly so the gate does not create a false sense of production performance.
Tracking progress over time: trends and regressions
Store results and compare builds
Quality gates answer “pass/fail now,” but teams also need trend visibility. Store Lighthouse results per build and compare against a baseline. Useful practices include:
- Keep a baseline from the main branch and compare pull requests against it.
- Track medians for LCP/CLS/TBT per route over time.
- Annotate changes (e.g., “new image carousel shipped”) to correlate with metric shifts.
When you can see trends, you can prioritize work: for example, a steady increase in TBT on the product detail page might indicate a growing component complexity that needs refactoring.
Define ownership and response time
A gate is only effective if failures are acted on. Define:
- Who owns the gate configuration and thresholds.
- What happens when the gate fails (block merge, require approval, or allow override with justification).
- How quickly regressions must be fixed.
This turns Lighthouse from a report into an operational practice.
Practical workflow: from local audit to CI gate
Step-by-step checklist
- Step 1: Pick routes: choose 3–6 URLs representing key experiences.
- Step 2: Establish baseline: run 3–5 Lighthouse audits per route and record medians.
- Step 3: Write assertions: set minimum category scores and explicit metric thresholds; add required pass/fail audits.
- Step 4: Automate with LHCI: add
@lhci/cli, createlighthouserc.json, and runlhci autorun. - Step 5: Add CI artifacts: upload HTML/JSON reports so failures are easy to diagnose.
- Step 6: Stabilize: tune number of runs, pin environment, and adjust thresholds to reduce flakiness.
- Step 7: Tighten gates over time: raise thresholds gradually and expand route coverage.
Example: tightening a gate without blocking all work
Suppose your baseline LCP on “/products” is 3.2s. You want 2.5s eventually, but you cannot reach it immediately. A staged approach:
- Stage A (now): gate LCP ≤ 3.3s (no regression) and require CLS ≤ 0.1.
- Stage B (after first optimization): gate LCP ≤ 3.0s.
- Stage C (after image and rendering improvements): gate LCP ≤ 2.7s.
- Stage D (target): gate LCP ≤ 2.5s.
This keeps the gate credible and prevents backsliding while you improve.