Why debugging service workers feels different
Service workers run in a separate execution context from your page. They can intercept network requests, serve responses from Cache Storage, and keep running briefly even after a tab is closed. This separation is great for reliability, but it changes how you debug: you often need to inspect three things at once—(1) the page, (2) the service worker, and (3) the caches and network layer the worker is manipulating.
Chrome DevTools provides dedicated tooling for this: a Service Worker panel, cache inspection, request-level visibility, and controls to simulate update and offline scenarios. The goal of this chapter is to make you comfortable answering questions like: “Which service worker is controlling this tab?”, “Why is my new code not taking effect?”, “Which cache entry is being used for this request?”, and “Why is this request never hitting the network?”
Finding the right DevTools panels
Application panel: the hub for service workers and storage
Open DevTools and go to Application. This is where you can inspect:
- Service Workers: registration, status, scope, and controls like update/unregister.
- Cache Storage: cache names and individual request/response entries.
- Storage: clear site data, view quotas, and inspect other storage types.
If you are debugging a service worker, start here to confirm you are looking at the correct origin and the correct registration.
Network panel: verify what actually happened
The Network panel is still essential. Even when a service worker serves a response from cache, the request will appear in the Network panel. Chrome annotates requests that were handled by a service worker, and you can inspect headers, timing, and response bodies. This helps you distinguish “served from memory cache,” “served from disk cache,” “served by service worker,” and “fetched from network.”
- Listen to the audio with the screen off.
- Earn a certificate upon completion.
- Over 5000 courses for you to explore!

Download the app
Sources panel: debugging the worker like a script
Service workers can be debugged with breakpoints, stepping, and console logs. In DevTools, you can open the service worker script in Sources and set breakpoints in event handlers (for example, fetch). You can also view the worker’s dedicated console output.
Confirming control: is the service worker actually in charge?
Step-by-step: verify control and scope
Many “it doesn’t work” issues are simply that the page is not controlled by the expected service worker. Use this checklist:
- Open Application > Service Workers.
- Find your registration and confirm the scope matches the pages you are testing.
- In the same section, check whether the current tab is listed as a client (controlled page).
- Reload the page and watch the registration status change (installing/activated/running).
If the tab is not controlled, you may be testing a page outside the scope, or you may need a reload after activation. DevTools makes this visible so you don’t guess.
Common symptom: “My fetch handler never runs”
If your fetch handler doesn’t run, first confirm the page is controlled. Next, confirm the request is within scope (same origin and path under scope). Finally, check the Network panel: if the request is cross-origin, the service worker can still see it, but caching and response handling may differ depending on request mode and CORS headers.
Forcing updates and avoiding “stale worker” confusion
Understanding what DevTools can force
Service worker updates are intentionally conservative. Chrome may keep an older worker active until all tabs using it are closed. During development, this can make it seem like your changes are ignored. DevTools provides controls to speed up iteration.
Step-by-step: use “Update” and “Skip waiting” safely during debugging
- Open Application > Service Workers.
- Click Update to force Chrome to check for an updated service worker script.
- If a new worker is installed but waiting, you may see a waiting state. If your code supports it, trigger skipWaiting from your app UI or via a message.
- Reload the page to ensure the new worker controls the tab.
DevTools can also show a checkbox like Update on reload. When enabled, each reload checks for an updated worker script. This is convenient for development but can mask real-world update behavior, so use it intentionally.
Step-by-step: “Bypass for network” to isolate issues
When you suspect the service worker is causing a bug (for example, serving an old cached asset), temporarily bypass it:
- Open Application > Service Workers.
- Enable Bypass for network.
- Reload and verify the issue disappears (meaning the worker/caches are involved).
- Disable bypass and continue debugging with a narrower hypothesis.
This is one of the fastest ways to determine whether you are dealing with a caching bug or an application bug unrelated to the service worker.
Inspecting Cache Storage: what’s in there, exactly?
Viewing caches and entries
In Application > Cache Storage, you can expand each cache and see individual entries. Clicking an entry shows request URL, response headers, and sometimes a preview of the response body. This is invaluable for answering: “Is the asset cached?”, “Which version is cached?”, and “Did I accidentally cache an HTML error page?”
Step-by-step: verify a specific URL is cached and correct
- Reproduce the behavior in the page (load the route or asset).
- Open Application > Cache Storage and select the cache you expect.
- Use the filter box to search for the URL path (for example,
/app.css). - Click the entry and inspect Response Headers (especially
content-type,cache-control, and any custom version headers). - If the response looks wrong, delete the entry or the entire cache and retest.
Deleting a cache entry in DevTools is a controlled way to test “first load” behavior without clearing all site data.
Common caching mistake: caching redirects or opaque responses
Sometimes a request is cached as a redirect response (for example, HTTP 302) or as an opaque response (common with cross-origin requests without proper CORS). In Cache Storage, these can look “present” but not usable the way you expect. If you see unexpected status codes or missing headers, verify the request in the Network panel and confirm the response type and status.
Debugging fetch handling with Network + Sources
Recognizing “from ServiceWorker” in the Network panel
When a service worker intercepts a request, Chrome indicates it in the Network panel (often in a “Size” or “Initiator” style annotation depending on Chrome version). Use this to confirm whether the worker handled the request at all. If a request is not intercepted, you may be outside scope, or the request may be initiated before the worker controls the page.
Step-by-step: trace a single request end-to-end
- Open Network and enable Preserve log.
- Reload the page.
- Click the request you care about (for example, a JSON API call or a JS bundle).
- Check the request headers and response headers.
- Look for indicators that it was handled by a service worker.
- Switch to Timing to see if it was fast (cache) or slow (network).
Then correlate with Cache Storage: if Network shows the request was served quickly and the cache contains an entry for that URL, you have strong evidence it was served from cache. If Network shows a network fetch but the cache still changes, your worker may be updating the cache in the background.
Step-by-step: set breakpoints in the service worker fetch event
To debug logic errors (wrong cache chosen, wrong fallback, unexpected cloning issues), use breakpoints:
- Open Application > Service Workers and click the link to the service worker script (it opens in Sources).
- In Sources, find your
fetchevent handler. - Set a breakpoint inside the handler where you decide between cache and network.
- Trigger the request in the page (reload or navigate).
- When execution pauses, inspect variables like request URL, method, headers, and which cache name you’re using.
While paused, you can step through asynchronous code, inspect promise chains, and verify that you are returning the response you think you are returning.
Logging from the worker: where to see it
console.log inside a service worker does not always appear in the same console as the page. In Application > Service Workers, there is typically a way to open an inspect window for the worker. That inspector has its own Console and Sources context. Use it to view logs that are specific to the worker lifecycle and fetch events.
Simulating offline and poor connectivity
Offline mode in DevTools
To validate offline behavior, you need to simulate network loss. In Chrome DevTools, you can do this via the Network panel throttling controls.
Step-by-step: test offline responses without changing your OS network
- Open Network.
- Find the throttling dropdown and select Offline.
- Reload the page and observe which requests fail and which succeed.
- Check the Network panel for failed requests and confirm whether the service worker attempted to handle them.
- Inspect Cache Storage to confirm the resources required for offline use are present.
When offline, a common bug is that the worker tries to fetch and doesn’t provide a fallback, resulting in failed navigations or broken UI. DevTools helps you see exactly which request failed and whether it was intercepted.
Throttling for “slow network” cache race conditions
Some bugs only appear on slow connections: a request might time out, or your code might update caches in an order you didn’t expect. Use throttling presets (for example, “Fast 3G” or “Slow 3G”) to reproduce these timing-sensitive issues. Then watch the Network waterfall and compare it to what is stored in Cache Storage after the load completes.
Clearing and resetting state: targeted vs. nuclear options
Clear site data
When debugging, you often need to return to a known state. In Application > Storage, Chrome provides Clear site data options. This can remove Cache Storage, service worker registrations, and other storage in one action. It’s useful when you suspect multiple caches or an old worker is interfering.
Step-by-step: reset only what you need
Prefer targeted resets to avoid hiding bugs:
- To test a fresh cache population: delete a specific cache under Cache Storage.
- To test first install behavior: unregister the service worker under Service Workers, then reload.
- To test how your app behaves with existing caches but a new worker: keep caches, click Update, then reload.
Being deliberate about what you clear helps you reproduce real user states (for example, “user has old caches and gets an update”).
Debugging common cache-related problems
Problem: old CSS/JS keeps loading after deployment
This is typically a mismatch between what the page references and what the cache contains. DevTools workflow:
- In Network, click the CSS/JS request and confirm whether it is served by the service worker.
- In Application > Cache Storage, locate that URL and inspect the cached response.
- If the cached response is old, delete the entry and reload to see if it repopulates with the new version.
- If it repopulates with the old version again, the worker is likely fetching an old URL (for example, due to a build artifact or a hardcoded path). Use a breakpoint in fetch to inspect the request URL being cached.
Problem: HTML route returns the wrong content offline
Sometimes an offline navigation fallback is cached incorrectly, or an HTML response is cached under an API URL. DevTools workflow:
- In Network, identify the request URL that returns unexpected HTML.
- Inspect the response preview to confirm it is HTML.
- In Cache Storage, search for that URL and inspect the cached response headers (
content-typeshould match expectations). - Set a breakpoint where you decide what to cache; verify you are not caching navigations into the same cache as API responses.
Problem: cache grows unexpectedly
If you see many entries accumulating, you may be caching URLs with query strings or version parameters you didn’t intend. DevTools workflow:
- In Cache Storage, sort mentally by patterns: repeated URLs with different query strings.
- In the worker debugger, inspect the request URL and decide whether you should normalize it (for example, ignore tracking parameters) before caching.
- Use the Network panel to see which requests are being made repeatedly and why.
Using DevTools to debug service worker messaging
Inspecting messages and events
Many apps use postMessage between the page and the service worker (for example, to trigger cache cleanup, request a skip-waiting action, or report status). Debugging this is easier when you can see both sides.
Step-by-step: verify a message reaches the worker
- Open the worker’s inspector (from Application > Service Workers).
- In the worker Console, add temporary logs in the
messageevent handler. - Trigger the message from the page (button click or programmatic call).
- Confirm the log appears in the worker console and inspect the message payload.
If the message doesn’t arrive, check that the page is controlled and that you are messaging the correct registration/controller. DevTools helps by showing the active worker and its clients.
Advanced: request/response inspection tricks for cache debugging
Compare cached response vs network response
A powerful debugging technique is to compare what’s in Cache Storage with what the network would return.
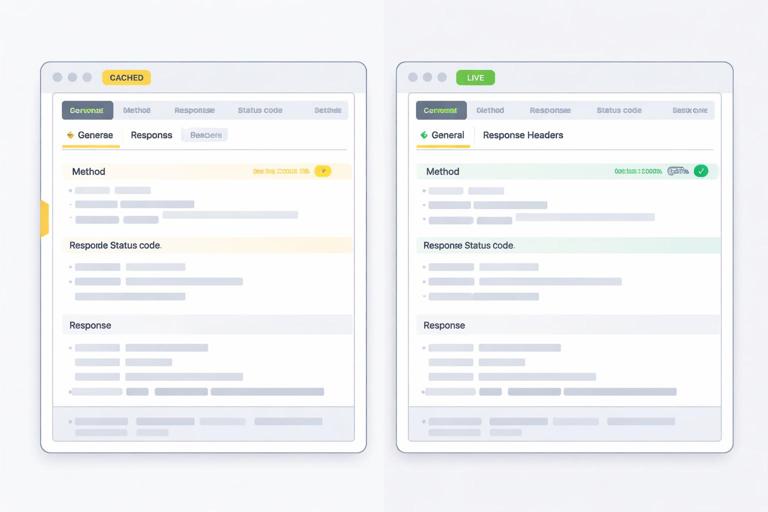
Step-by-step: compare versions
- Temporarily enable Bypass for network to fetch directly from the server.
- In Network, open the response body and headers for the resource.
- Disable bypass and reload to let the service worker handle it.
- Now inspect the cached entry in Cache Storage and compare headers/body.
This isolates whether the server is serving the wrong content or the service worker is caching/serving incorrectly.
Watch for Vary and content negotiation pitfalls
If your server uses Vary headers (for example, varying by Accept-Encoding or Accept), caching can behave unexpectedly if you treat different variants as the same. In DevTools, inspect response headers for Vary and confirm that the cached response matches the request headers you’re making. If you see mismatches, you may need to adjust how you cache or which requests you cache.
Practical debugging playbook: isolate, observe, then change one thing
1) Isolate the layer
- Use Bypass for network to see if the bug disappears.
- Use Offline throttling to force fallback paths.
- Use Update and reload to ensure you’re testing the latest worker.
2) Observe with the right tool
- Application > Service Workers: status, scope, clients, update/unregister.
- Application > Cache Storage: what is cached, response headers, unexpected entries.
- Network: whether requests are intercepted, response preview, timing.
- Sources: breakpoints in fetch/message handlers, step through logic.
3) Change one variable and retest
When debugging caching issues, small changes can have large effects. Prefer controlled experiments: delete one cache entry, reload once, verify; then delete the whole cache, reload, verify; then unregister the worker, reload, verify. This approach prevents you from “fixing” the issue by wiping everything and losing the ability to reproduce it.
// Example: minimal debug logging pattern inside a fetch handler (for development only) self.addEventListener('fetch', (event) => { const url = new URL(event.request.url); if (url.origin === location.origin) { console.log('[SW fetch]', event.request.method, url.pathname); } });Use logs like this temporarily to correlate Network requests with your fetch logic. Then remove or gate them behind a debug flag to avoid noisy production logs.