What a Kubernetes Troubleshooting Playbook Is
A troubleshooting playbook is a repeatable, time-bounded procedure for diagnosing and mitigating a specific failure mode in Kubernetes. It is not a generic “check the logs” list. A good playbook is scenario-driven: it starts from a symptom (what users and alerts report), narrows to likely causes, and provides concrete commands, expected outputs, decision points, and safe mitigations. In practice, playbooks reduce mean time to recovery (MTTR) by removing guesswork and by standardizing how engineers collect evidence, communicate status, and apply fixes.
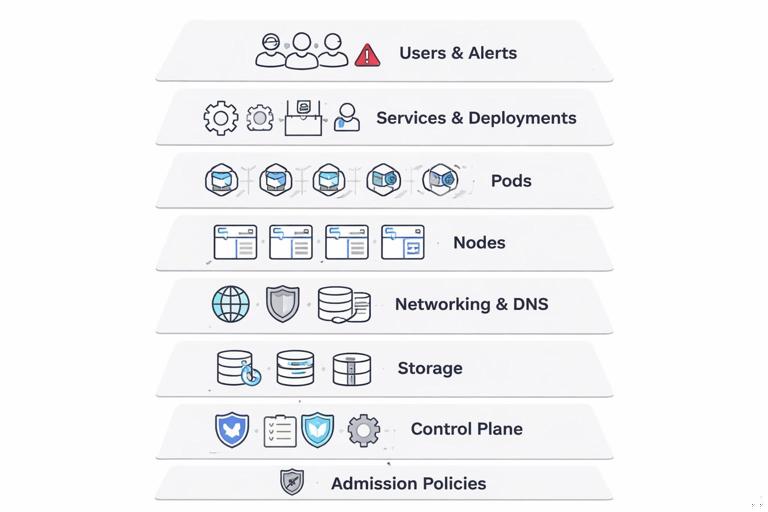
In Kubernetes, many failures look similar at the surface (timeouts, 5xx, pods restarting), but the root causes can be in different layers: workload configuration, node health, DNS, storage, the control plane, or admission policies. Playbooks help you avoid “random walk debugging” by enforcing a consistent flow: confirm scope, identify the failing component, inspect Kubernetes state, validate dependencies, and apply the smallest safe change to restore service.
Reusable playbook template
- Trigger/Symptom: what you see (alert, user report, error message).
- Impact/Scope: which namespaces, services, or clusters are affected.
- Fast triage: 3–5 commands to classify the failure (pod vs node vs control plane vs dependency).
- Deep diagnosis: targeted checks with decision points.
- Mitigation: safe actions to restore service (rollback, scale, cordon/drain, restart).
- Verification: how to confirm recovery.
- Evidence to capture: events, describe output, logs, timestamps.
Commands below assume you have cluster access via kubectl. Replace placeholders like $NS, $DEPLOY, $POD, $NODE, $SVC, and $PVC.
Global Fast Triage: Classify the Failure in 2 Minutes
When an incident starts, run a short set of commands to quickly decide which playbook to use. The goal is classification, not root cause.
1) Is the control plane reachable and responding?
kubectl version --shortkubectl get --raw='/readyz?verbose'If these hang or fail, skip workload debugging and jump to the control plane playbook.
- Listen to the audio with the screen off.
- Earn a certificate upon completion.
- Over 5000 courses for you to explore!

Download the app
2) What is failing: pods, nodes, or a specific namespace?
kubectl get nodeskubectl get pods -A | headkubectl get events -A --sort-by=.lastTimestamp | tail -n 30Events often reveal the category immediately: scheduling failures, image pulls, volume mounts, admission denials, or node not ready.
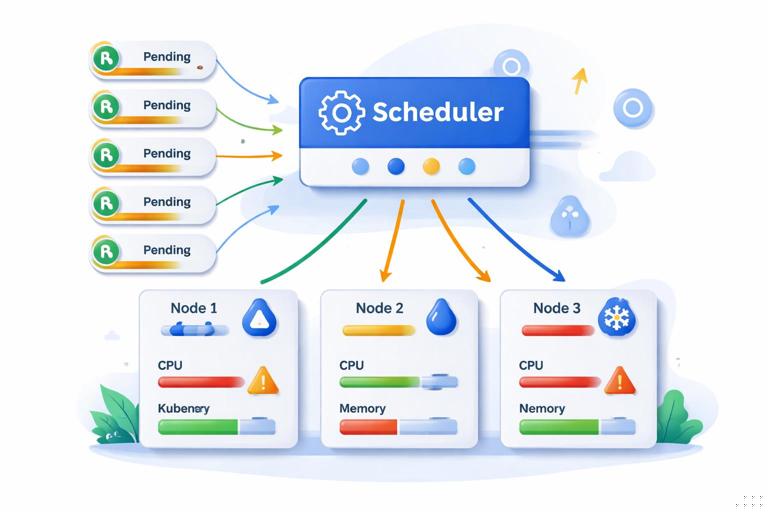
Playbook 1: Pods Stuck in Pending (Scheduling Failures)
Symptom: new pods never start; kubectl get pods shows Pending. Deployments stall and capacity drops.
Step-by-step
1) List all pending pods and pick one representative
kubectl get pods -A --field-selector=status.phase=Pending2) Describe the pod and read the scheduler events
kubectl -n $NS describe pod $PODLook under Events for messages such as:
insufficient cpu/insufficient memorynode(s) had taint ... NoSchedulepod has unbound immediate PersistentVolumeClaimsdidn't match Pod's node affinity/selectorpreemption is not helpful
3) Confirm whether the issue is cluster-wide or node-pool specific
kubectl get nodes -o widekubectl describe node $NODE | sed -n '/Allocated resources:/,/Events:/p'Decision points and mitigations
A) Insufficient CPU/Memory
- Confirm: node
Allocated resourcesshows requests near allocatable, or nodes show pressure conditions. - Mitigate: add capacity (scale node pool), or temporarily scale down non-critical workloads, or reduce requests for the affected workload only if you understand the risk.
B) Taints/Tolerations mismatch
- Confirm: pod events mention taints; node
Taints:includesNoSchedule. - Mitigate: add toleration (if intended), or move workload to the correct node pool by adjusting node selectors/affinity, or remove an accidental taint.
C) Node affinity/selector mismatch
- Confirm: events mention affinity mismatch; check pod spec for
nodeSelectorandaffinity. - Mitigate: relax constraints or label nodes correctly.
D) Unbound PVC
- Confirm: events mention unbound PVC; PVC shows
Pending. - Mitigate: fix StorageClass/provisioner issues or topology constraints; see the storage playbook below.
Verification
kubectl -n $NS get pods -wCapture evidence: describe pod output and the last 20 namespace events.
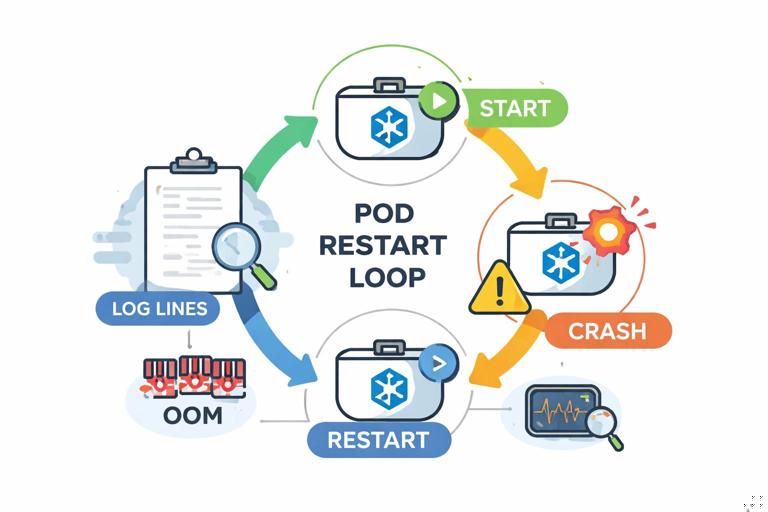
Playbook 2: CrashLoopBackOff and Repeated Restarts
Symptom: pods start and then restart; status shows CrashLoopBackOff or restarts increase rapidly. Users see intermittent errors or reduced throughput.
Step-by-step
1) Identify which container is failing and why
kubectl -n $NS get pod $POD -o widekubectl -n $NS describe pod $PODKey fields to read:
StateandLast State(Terminated reason, exit code)Restart Count- Events mentioning probes or OOM
2) Get logs from the previous crash
kubectl -n $NS logs $POD -c $CONTAINER --previous3) Check if it is one pod, one node, or all replicas
kubectl -n $NS get pods -l app=$APP -o wideDecision points and mitigations
A) OOMKilled
- Confirm:
Reason: OOMKilledinLast State. - Mitigate: increase memory limit (and usually request), or reduce memory usage via configuration. If many pods OOM simultaneously, also check node memory pressure.
kubectl describe node $NODE | grep -i -E 'MemoryPressure|Allocatable|Allocated'B) Liveness probe killing the container
- Confirm: events show
Liveness probe failedand container restarts. - Mitigate: increase initial delay/timeouts, or use a startup probe for slow boot. As an emergency mitigation, you can temporarily disable liveness (not readiness) to stop the restart storm while you investigate, but document and revert quickly.
C) App exits due to runtime/config error
- Confirm: logs show missing file, invalid flag, permission denied, or inability to connect to a required dependency.
- Mitigate: fix the deployment spec and redeploy, or roll back to last known good revision if the change is recent and urgent.
Verification
kubectl -n $NS get pods -l app=$APPCapture: previous logs, exit code, and the pod describe events section.
Playbook 3: ImagePullBackOff / ErrImagePull
Symptom: pods cannot start because the image cannot be pulled. This often follows a release that references a wrong tag or a registry/auth change.
Step-by-step
1) Describe the pod and read the exact pull error
kubectl -n $NS describe pod $PODCommon errors and meanings:
manifest unknown: tag/digest does not exist in the registry.unauthorized: missing/incorrect registry credentials.x509: certificate signed by unknown authority: TLS trust issue to registry.i/o timeout/connection refused: network path or registry outage.
2) Confirm what image the workload is trying to run
kubectl -n $NS get deploy $DEPLOY -o jsonpath='{.spec.template.spec.containers[*].image}'3) Check whether the issue affects all nodes or only some
kubectl -n $NS get pod $POD -o jsonpath='{.spec.nodeName}{"\n"}'If only certain nodes fail to pull, suspect node egress, DNS, or node-level trust store differences.
Mitigations
- Wrong tag/digest: update to a known-good tag or roll back the deployment.
- Auth issue: ensure the service account used by the pod has the correct image pull secret, and that the secret is valid in the namespace.
- Registry outage: temporarily pin to an image already present on nodes (if you have a fallback), or shift traffic to another cluster/region if applicable.
Verification
kubectl -n $NS get pods -l app=$APP -wCapture: the exact error string from events; it is usually the fastest path to the fix.
Playbook 4: Rollout Stuck (ProgressDeadlineExceeded)
Symptom: deployment rollout does not complete; kubectl rollout status reports ProgressDeadlineExceeded or hangs. Users may see partial outage if old replicas are reduced while new ones are not ready.
Step-by-step
1) Inspect rollout status and ReplicaSets
kubectl -n $NS rollout status deployment/$DEPLOYkubectl -n $NS get rs -l app=$APP2) Compare old vs new pods and their readiness
kubectl -n $NS get pods -l app=$APP -o wide3) Describe a new pod to see why it is not becoming ready
kubectl -n $NS describe pod $NEW_PODDecision points and mitigations
A) New pods are pending
- Likely causes: capacity, taints, affinity, PVC binding.
- Mitigate: use the Pending playbook; consider temporarily adding capacity.
B) New pods are running but not ready
- Likely causes: readiness probe failing, app not serving, dependency down.
- Mitigate: fix readiness/app issue; if impact is high, pause rollout to stop further changes.
kubectl -n $NS rollout pause deployment/$DEPLOYC) New pods crash looping or cannot pull images
- Mitigate: use CrashLoopBackOff or ImagePull playbooks.
Emergency mitigation: rollback
kubectl -n $NS rollout undo deployment/$DEPLOYVerification
kubectl -n $NS rollout status deployment/$DEPLOYCapture: deployment describe, ReplicaSet list, and new pod events.
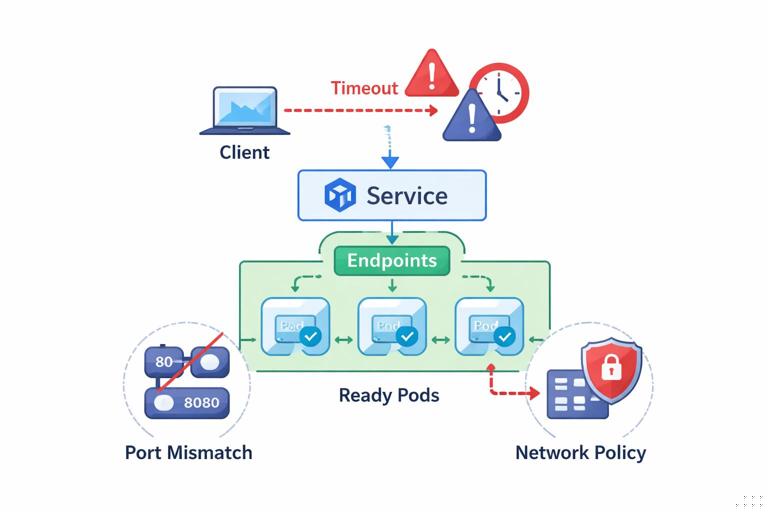
Playbook 5: Service Has Endpoints but Requests Time Out
Symptom: clients time out; the Service exists and endpoints are present; pods appear ready. This often indicates port mismatch, application not actually listening, or node-level networking issues.
Step-by-step
1) Confirm Service ports and endpoint ports match
kubectl -n $NS get svc $SVC -o yamlkubectl -n $NS get endpoints $SVC -o yaml2) Test from inside the cluster using a temporary debug pod
kubectl -n $NS run net-debug --rm -it --image=curlimages/curl:8.5.0 -- shcurl -sv http://$SVC.$NS.svc.cluster.local:$PORT/health3) Test direct pod IP connectivity
kubectl -n $NS get pod -l app=$APP -o widecurl -sv http://$POD_IP:$CONTAINER_PORT/healthDecision points and mitigations
A) Pod IP works, Service fails
- Likely cause: Service
targetPortmismatch or wrong selector. - Mitigate: fix Service selector/ports; verify endpoints update.
B) Both Service and Pod IP fail
- Likely cause: app not listening, readiness too permissive, or network policy blocking (if used).
- Mitigate: exec into the pod and check listening ports; tighten readiness to reflect real serving; validate policies if applicable.
C) Failures correlate with a specific node
- Mitigate: cordon the node to stop new scheduling; drain if safe to move pods away while investigating node networking/CNI.
kubectl cordon $NODEkubectl drain $NODE --ignore-daemonsets --delete-emptydir-dataVerification
kubectl -n $NS get endpoints $SVCCapture: service YAML, endpoints YAML, and node correlation notes.
Playbook 6: DNS Failures Inside the Cluster
Symptom: pods cannot resolve service names; errors like no such host, SERVFAIL, or long lookup delays. DNS issues often appear as “random” dependency failures across many apps.
Step-by-step
1) Reproduce from a debug pod in the affected namespace
kubectl -n $NS run dns-debug --rm -it --image=busybox:1.36 -- shnslookup kubernetes.default.svc.cluster.localnslookup $SVC.$NS.svc.cluster.local2) Inspect DNS config inside the pod
cat /etc/resolv.conf3) Check CoreDNS pods and logs
kubectl -n kube-system get pods -l k8s-app=kube-dns -o widekubectl -n kube-system logs -l k8s-app=kube-dns --tail=200Decision points and mitigations
A) CoreDNS pods unhealthy
- Mitigate: restart CoreDNS deployment (safe if multiple replicas exist).
kubectl -n kube-system rollout restart deployment/corednsB) CoreDNS healthy but overloaded
- Mitigate: scale CoreDNS replicas up temporarily.
kubectl -n kube-system scale deployment/coredns --replicas=4C) Node-local issue
- Confirm: DNS failures only for pods on certain nodes.
- Mitigate: cordon/drain affected nodes to reduce blast radius while investigating node networking.
Verification
kubectl -n $NS run dns-verify --rm -it --image=busybox:1.36 -- sh -c 'nslookup kubernetes.default; nslookup $SVC.$NS.svc.cluster.local'Capture: CoreDNS logs around the incident window and /etc/resolv.conf from affected pods.
Playbook 7: PersistentVolumeClaim Attach/Mount Failures
Symptom: pods stuck in ContainerCreating or init; events show volume attach/mount errors. Stateful rollouts may block entirely.
Step-by-step
1) Describe the pod and focus on volume-related events
kubectl -n $NS describe pod $POD2) Inspect PVC and PV status and events
kubectl -n $NS get pvc $PVC -o widekubectl -n $NS describe pvc $PVCkubectl get pv $PV -o wide3) Review recent namespace events for attach/detach messages
kubectl -n $NS get events --sort-by=.lastTimestamp | tail -n 50Decision points and mitigations
A) Multi-attach error
- Confirm: event contains
Multi-Attach error. - Mitigate: ensure the old pod is terminated; if stuck, force delete carefully to release attachment.
kubectl -n $NS delete pod $OLD_POD --grace-period=0 --forceB) Provisioning failure (PVC pending)
- Confirm: PVC shows
Pendingand events mention provisioning errors. - Mitigate: validate StorageClass name and parameters; check infrastructure quota; if urgent, switch to a known-good StorageClass for this workload.
C) Mount permission issues
- Confirm: events mention
permission deniedor filesystem errors. - Mitigate: validate security context assumptions (UID/GID) and any recent changes; roll back if a change introduced incompatibility.
Verification
kubectl -n $NS get pod $POD -wCapture: pod events, PVC events, PV details.
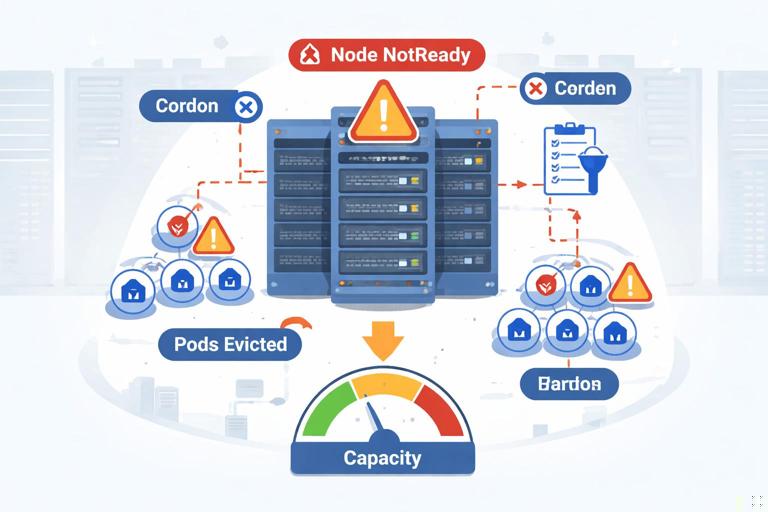
Playbook 8: Node NotReady and Mass Pod Evictions
Symptom: one or more nodes become NotReady; pods are evicted or stuck terminating; service capacity drops suddenly.
Step-by-step
1) Identify affected nodes and how widespread it is
kubectl get nodes2) Describe the node to see conditions and last transitions
kubectl describe node $NODELook for:
Readycondition falseDiskPressure,MemoryPressure,PIDPressure- Events indicating kubelet issues or runtime failures
3) List pods on the node and their states
kubectl get pods -A -o wide --field-selector spec.nodeName=$NODEMitigations
A) Node is flapping or unhealthy
- Mitigate: cordon to stop new scheduling.
kubectl cordon $NODEB) Need to move workloads off the node
- Mitigate: drain the node (be mindful of disruption to stateful workloads and PodDisruptionBudgets).
kubectl drain $NODE --ignore-daemonsets --delete-emptydir-dataC) DiskPressure (common cause)
- Confirm: node condition shows
DiskPressure=True. - Mitigate: free disk on the node (often container image garbage collection is blocked), or replace the node. From Kubernetes side, the safe action is usually to drain and recycle the node via your infrastructure tooling.
Verification
kubectl get nodeskubectl get pods -A -o wide --field-selector spec.nodeName=$NODECapture: node describe output and the timestamp when it became NotReady.
Playbook 9: API Server Slow/Unavailable (kubectl Hangs)
Symptom: kubectl commands time out or hang; controllers stop reconciling; deployments and autoscaling may stall. This is a control plane incident, not a workload incident.
Step-by-step
1) Confirm it is not local kubeconfig/network
kubectl cluster-infokubectl get --raw='/livez?verbose'2) Check whether reads fail or only writes fail
kubectl get nskubectl auth can-i create pods -n $NS3) Look for symptoms of etcd or admission pressure (via events if accessible)
kubectl get events -A --sort-by=.lastTimestamp | tail -n 30Mitigations
- Reduce load: stop high-frequency automation temporarily (scripts that spam the API, runaway controllers, aggressive CI loops).
- Fail over: if you have multiple clusters/regions, shift traffic away while the control plane recovers.
- Coordinate with platform team/provider: managed control planes often require provider-side action; your best mitigation is reducing API load and avoiding repeated retries that amplify the outage.
Verification
kubectl get --raw='/readyz'kubectl get nodesCapture: exact error messages and timestamps; note whether reads or writes were impacted.
Playbook 10: Admission Denied (Policy or Webhook Failures)
Symptom: creates/updates fail with errors like admission webhook ... denied the request or failed calling webhook. Deployments may fail even though the cluster is otherwise healthy.
Step-by-step
1) Reproduce the error and capture the full message
kubectl -n $NS apply -f workload.yaml2) Identify whether it is a denial (policy) or a webhook availability issue
- Denial: message includes a clear reason (e.g., forbidden field, missing label).
- Webhook failure: message includes timeouts, connection refused, or service not found.
3) If webhook failure, find the webhook configuration and its service
kubectl get validatingwebhookconfigurationskubectl get mutatingwebhookconfigurationskubectl describe validatingwebhookconfiguration $NAME4) Check the webhook service endpoints
kubectl -n $WEBHOOK_NS get svc $WEBHOOK_SVCkubectl -n $WEBHOOK_NS get endpoints $WEBHOOK_SVCMitigations
A) Policy denial (expected behavior)
- Mitigate: adjust the workload to comply (add required labels/annotations, set security context, disallow privileged settings).
- Mitigate for urgent production restore: use an approved break-glass process (separate namespace or exception mechanism) rather than editing policies ad hoc.
B) Webhook is down (availability issue)
- Mitigate: restore the webhook deployment/service so it has endpoints. If the webhook is non-critical and configured with a fail-open policy (
failurePolicy: Ignore), it may not block; if it is fail-closed, it will block all matching operations until restored. - Mitigate (high risk): temporarily change webhook
failurePolicytoIgnoreto unblock the API, only with explicit approval and a plan to revert.
Verification
kubectl -n $NS apply -f workload.yamlCapture: the full admission error, the webhook configuration snippet, and endpoint status.
Operational Habits That Make Playbooks Work During Incidents
Use consistent evidence capture
During an incident, collect the same artifacts every time so later analysis is possible. For a pod-level issue, a minimal evidence bundle is: pod YAML, describe output, last 50 events, and logs (including --previous for crashes).
kubectl -n $NS get pod $POD -o yaml > pod.yamlkubectl -n $NS describe pod $POD > pod.describe.txtkubectl -n $NS get events --sort-by=.lastTimestamp | tail -n 50 > events.tail.txtkubectl -n $NS logs $POD -c $CONTAINER --previous > logs.previous.txtPrefer reversible mitigations
When you must act quickly, choose mitigations that are easy to revert and have predictable blast radius: pausing a rollout, rolling back, cordoning a node, scaling a stateless deployment, restarting a controller with multiple replicas. Avoid “mystery edits” that permanently change behavior without tracking (for example, tweaking multiple fields at once).
Time-box deep dives
Playbooks should include a time limit for each phase. For example: 2 minutes to classify, 10 minutes to identify the failing layer, 15 minutes to apply a mitigation. If you cannot identify the cause quickly, switch to a mitigation-first approach (rollback, shift traffic, add capacity) and continue diagnosis after stability returns.