What “Reusable Data Modeling” Means in Power BI
Definition and goal. Reusable data modeling is the practice of designing a Power BI semantic model (tables, relationships, measures, and metadata) so it can be safely reused across multiple reports, pages, and audiences without rewriting logic or risking inconsistent numbers. The goal is trust: the same business question should produce the same answer regardless of which report is opened, who filters it, or which visual is used.
Reuse is not only copying. Reuse is not “copy a .pbix and tweak it.” That approach multiplies logic, creates drift (slightly different measures), and makes governance difficult. Reuse means centralizing business logic in a model that is stable, documented, and designed to support many report layouts.
Trustworthiness is a modeling outcome. When stakeholders say “I don’t trust the dashboard,” the root cause is often modeling: ambiguous relationships, inconsistent grain, measures that behave differently under filters, or multiple definitions of the same KPI. A reusable model reduces these risks by standardizing definitions and enforcing consistent filter behavior.
Design Principles for a Reusable, Trustworthy Model
Principle 1: One fact, one grain. Each fact table should represent a single business process at a single level of detail (grain). For example, a Sales fact might be at the order line level, while an Inventory fact might be at the daily SKU level. Mixing grains in one table (e.g., order lines plus monthly targets) leads to double counting and confusing measures.
Principle 2: Conformed dimensions. Dimensions like Date, Product, Customer, Region should be shared across facts and have consistent keys and attributes. “Conformed” means the same Product table filters Sales, Returns, and Targets in the same way. This is the backbone of reuse: once dimensions are standardized, you can add new facts without redesigning every report.
- Listen to the audio with the screen off.
- Earn a certificate upon completion.
- Over 5000 courses for you to explore!

Download the app
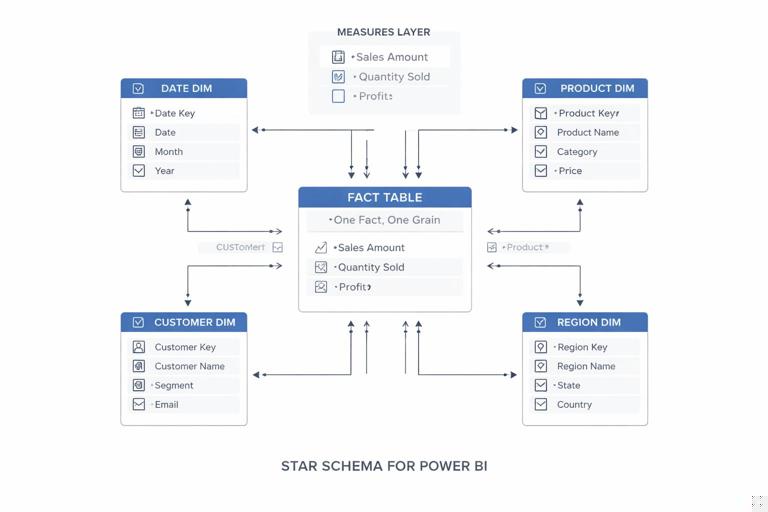
Principle 3: Star schema first. A star schema (facts in the center, dimensions around) is easier to understand, performs well, and makes DAX more predictable. Snowflaking (splitting dimensions into many related tables) can be valid, but it increases relationship complexity and can reduce reusability unless carefully managed.
Principle 4: Measures, not calculated columns, for business logic. Reusable logic should live in measures because measures respond to filter context and can be centrally governed. Calculated columns are evaluated at refresh time and can lock in assumptions that don’t generalize across reports.
Principle 5: Separate “data shape” from “presentation.” The model should provide clean tables and measures; the report should handle layout, formatting, and storytelling. When presentation logic leaks into the model (or vice versa), reuse becomes harder.
Step-by-Step: Build a Reusable Semantic Model Structure
Step 1: Identify business processes and map them to fact tables. List the core analytical questions and the processes behind them. Example: “Revenue and margin” (Sales fact), “Customer retention” (Customer activity fact), “Budget vs actual” (Budget fact). For each process, define the grain explicitly: “one row per order line,” “one row per customer per month,” etc.
Step 2: Define shared dimensions and their keys. Create a checklist of dimensions used across processes: Date, Product, Customer, Geography, Channel, Salesperson. For each dimension, define: the primary key, the natural key (if different), and the attributes you expect to slice by (Category, Subcategory, Segment, Country, etc.). Ensure keys are stable and unique.
Step 3: Create relationships with predictable filter paths. In a reusable model, relationships should be easy to reason about. Prefer one-to-many from dimension to fact, single-direction filtering from dimension to fact. Avoid bi-directional relationships unless you can justify them and test them thoroughly, because they can create ambiguous filter propagation and inconsistent results across visuals.
Step 4: Add a dedicated Date table and standardize time intelligence. Use a single Date dimension that covers the full range of your facts. Include common attributes (Year, Quarter, Month, Month Name, Week, Fiscal periods if needed). Mark it as the Date table. This enables consistent time calculations across all reports that reuse the model.
Step 5: Create a measure layer with naming conventions. Build measures in a dedicated “Measures” table (a table created solely to store measures). Use consistent naming such as: [Sales Amount], [Sales Amount LY], [Gross Margin %]. Group measures by subject area using display folders (e.g., Sales, Profitability, Customer). This makes the model self-explanatory and safer to reuse.
Modeling Patterns That Improve Trust
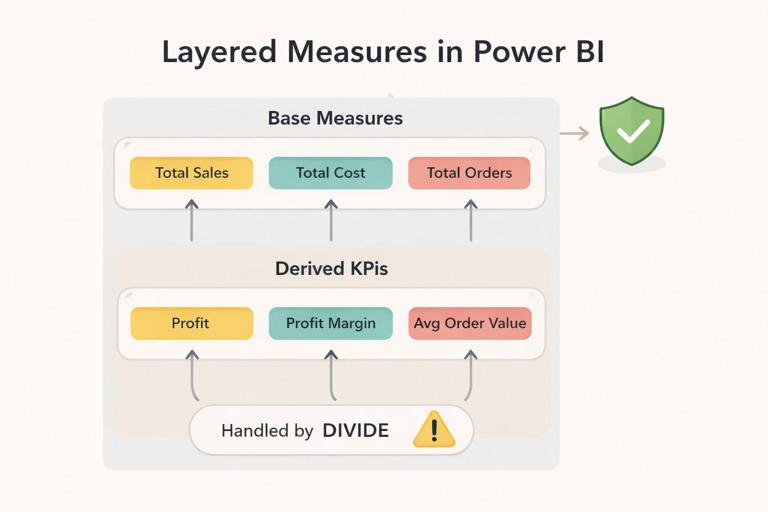
Pattern: Base measures + derived measures. Start with simple, auditable base measures and build more complex KPIs on top. This reduces errors and makes it easier to validate. Example base measures: [Total Sales], [Total Cost], [Total Quantity]. Derived measures: [Gross Profit], [Gross Margin %], [Average Selling Price].
// Base measures (auditable) Total Sales = SUM ( 'FactSales'[SalesAmount] ) Total Cost = SUM ( 'FactSales'[CostAmount] ) Total Qty = SUM ( 'FactSales'[Quantity] ) // Derived measures (reusable) Gross Profit = [Total Sales] - [Total Cost] Gross Margin % = DIVIDE ( [Gross Profit], [Total Sales] ) ASP = DIVIDE ( [Total Sales], [Total Qty] )Pattern: Explicit measures for “distinct count” logic. Distinct counts can change dramatically depending on the grain and filters. Make them explicit and name them clearly, such as [Distinct Customers] or [Active Customers], and define “active” precisely (e.g., purchased in the last 90 days). Avoid relying on visuals to infer distinct counts.
Pattern: KPI measures that handle blanks and edge cases. Trustworthy reports avoid surprising spikes caused by divide-by-zero or missing data. Use DIVIDE and explicit blank handling. Decide whether a KPI should show blank, zero, or “not applicable” behavior and implement it consistently.
Conversion Rate = VAR Visits = [Website Visits] VAR Orders = [Orders] RETURN IF ( Visits = 0, BLANK(), DIVIDE ( Orders, Visits ) )Pattern: Standardized “as of” logic for snapshots. If you report inventory, pipeline, or headcount, you often need “as of date” logic. Put this in measures so every report uses the same definition. For example, “Inventory as of selected date” should consistently pick the latest snapshot on or before the selected date.
Handling Multiple Facts Without Breaking Reuse
Use shared dimensions to connect facts. When you add a new fact table (e.g., Returns), connect it to the same Date, Product, and Customer dimensions. This allows cross-analysis (Sales vs Returns) without custom bridging logic in each report.
Avoid fact-to-fact relationships. Direct relationships between fact tables often create ambiguity and unexpected filter behavior. If you must relate facts, do it through a dimension or a bridge table designed for that purpose.
Be explicit about grain mismatches. A common reuse problem is comparing facts at different grains, such as daily Sales vs monthly Budget. The model can still be reusable if you handle it intentionally: connect Budget to Date at the month level (or to a Month dimension), and write measures that align the comparison. The key is to prevent accidental multiplication of budget values when slicing by day or product if budget is not defined at that level.
Practical technique: “Allocation only when defined.” If budget is only by month and region, do not let users slice budget by product unless you implement a documented allocation rule. Otherwise, the model will produce misleading numbers that look precise but are not defined.
Step-by-Step: Create a Robust KPI Definition That Works Everywhere
Scenario. You need a reusable KPI: “On-time delivery rate” that should work by customer, by region, by month, and for any filter combination.
Step 1: Define the event and the grain. Decide what counts as a delivery event: one row per shipment? per order? per order line? Write it down. Assume one row per shipment in FactShipments.
Step 2: Create base measures. Create measures for total shipments and on-time shipments. Ensure “on-time” is defined by a clear rule (e.g., DeliveredDate <= PromisedDate and shipment not canceled).
Total Shipments = COUNTROWS ( 'FactShipments' ) On-Time Shipments = CALCULATE ( [Total Shipments], 'FactShipments'[IsOnTime] = TRUE() )Step 3: Create the KPI measure with safe division.
On-Time Delivery % = DIVIDE ( [On-Time Shipments], [Total Shipments] )Step 4: Validate filter behavior using a test matrix. In a simple table visual, put Region, Month, and Customer on rows (one at a time), and add the three measures. Confirm that: totals equal the sum of shipments, the on-time count never exceeds total, and the percentage is consistent at each level.
Step 5: Add a “definition tooltip” measure for reuse. To reduce confusion across reports, create a text measure that can be used in tooltips or a KPI info panel.
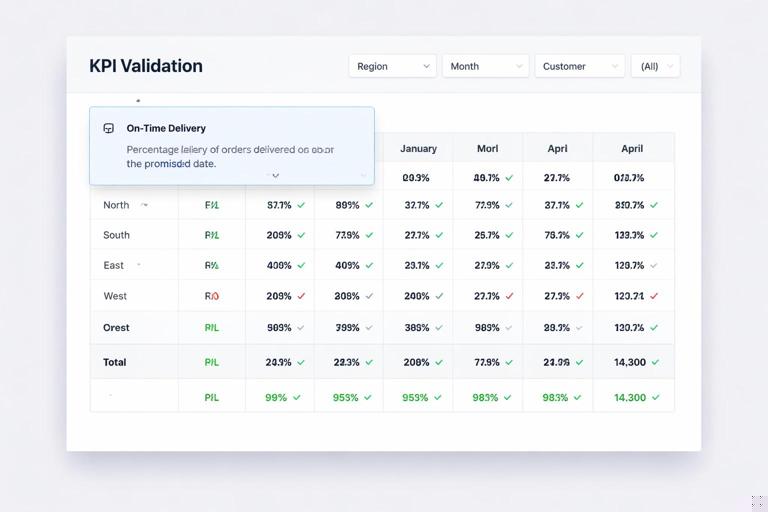
KPI Definition - OTD = "On-Time Delivery % = On-time shipments / total shipments. On-time means DeliveredDate <= PromisedDate, excluding canceled shipments."Preventing Ambiguity: Relationship and Filter Context Controls
Single-direction filters as default. Use single-direction filters from dimensions to facts to keep filter propagation predictable. This is especially important when multiple facts share dimensions; bi-directional filters can create circular paths and inconsistent totals.
Use role-playing dimensions intentionally. Many facts have multiple dates (Order Date, Ship Date, Invoice Date). A reusable model should avoid multiple active relationships to the same Date table. Common approach: keep one active relationship (e.g., Order Date) and use inactive relationships for others, activated in measures when needed.
Sales Amount (Ship Date) = CALCULATE ( [Total Sales], USERELATIONSHIP ( 'Date'[Date], 'FactSales'[ShipDate] ) )Document the “default date.” If the model’s default is Order Date, make that explicit in measure names or descriptions. Otherwise, two reports might appear to disagree while actually using different date contexts.
Use calculation groups carefully (optional). Calculation groups can standardize time intelligence (YTD, YoY, rolling 12) across many measures. They improve reuse but require discipline: test interactions with format strings, KPI measures, and report-level filters. If your organization is not ready for them, a curated set of time measures can still be reusable.
Reusable Security and Trust: Modeling for Consistent Access
Row-level security (RLS) belongs in the model. If different audiences need different data access, implement RLS rules in the semantic model so every report inherits the same access logic. Avoid implementing “security” by hiding pages or relying on report filters, which can be bypassed or misapplied.
Use a security dimension pattern. A common reusable approach is a User/Permissions table that maps users (or roles) to allowed regions, departments, or customers, then relates that table to the corresponding dimension. This keeps security logic centralized and consistent across all reports using the model.
Test security with the same validation mindset as measures. Create a small set of test users/roles and verify that totals, drilldowns, and cross-filtering behave correctly. Trust is lost quickly if a user sees data they shouldn’t or if their totals don’t match a colleague’s due to inconsistent security filters.
Metadata That Makes Models Reusable by Other People
Descriptions and synonyms. Add descriptions to measures and key columns so report authors understand intended use. For example, describe whether [Total Sales] includes tax, discounts, returns, or canceled orders. If Q&A is used, synonyms help users find the right fields without creating duplicate measures.
Hide what should not be used. Hide surrogate keys, technical columns, and intermediate tables from the report view. Reusability improves when authors choose from a curated set of fields and measures rather than raw columns that invite inconsistent calculations.
Use consistent formatting at the measure level. Apply formats (currency, percentage, decimal places) to measures so every report displays them consistently. This prevents “same number, different formatting” confusion that can undermine trust.
Organize with display folders. Display folders create a navigable measure library. A reusable model should feel like an API: users can quickly find “Sales > Revenue,” “Sales > Discounts,” “Profitability > Margin,” “Customer > Active Customers.”
Step-by-Step: Turn a One-Off Report Model into a Reusable Model
Step 1: Inventory measures and remove duplicates. List all measures and group them by meaning. If you find multiple versions of the same KPI (e.g., [Revenue], [Total Revenue], [Revenue $]), pick one canonical measure name and refactor visuals to use it. Keep deprecated measures temporarily but mark them clearly (e.g., prefix with ZZ_OLD) and hide them.
Step 2: Normalize dimensions and keys. Check each dimension for uniqueness of the key and completeness of attributes. Ensure the same Customer ID means the same customer across all facts. If you have multiple customer tables, consolidate into one conformed Customer dimension or create a clear master dimension with mapping.
Step 3: Fix relationship ambiguity. Use the model view to identify many-to-many relationships, bi-directional filters, and multiple paths between tables. Replace many-to-many with bridge tables where appropriate, and prefer single-direction filters. Validate that slicers filter the intended facts without unexpected side effects.
Step 4: Create a measure layer and apply naming standards. Move measures into a dedicated Measures table, apply display folders, and add descriptions. Rename measures to be business-friendly and consistent. This is one of the highest-impact changes for reuse because it turns the model into a shared library.
Step 5: Build a validation page inside the report file (for model authors). Create a hidden page with matrix visuals that test totals, reconciliation checks, and key KPIs by major dimensions. This page is not for executives; it is for maintaining trust as the model evolves. Examples: Sales by Month should equal the grand total; Gross Margin % should be within expected bounds; Distinct Customers should not exceed total customers in the dimension.
Practical Examples of Reusable Measures That Reduce Disputes
Example: “Net Sales” with a single definition. If different teams subtract different components (returns, discounts, rebates), you get conflicting dashboards. Create one canonical measure and reuse it everywhere.
Net Sales = [Total Sales] - [Returns Amount] - [Discount Amount]Example: “Current Period” selector behavior. Executives often want “current month to date” or “last complete month.” Implement these as measures (or a calculation group) rather than hardcoding filters in each report. This ensures every report answers “current” the same way.
Example: Reconciliation measure for trust. Add measures that help reconcile to a known source (e.g., GL total). Even if the GL table is not in the model, you can create internal checks like “Sales = sum of line amounts” and “Sales = sum by product equals sum by region” to detect modeling issues early.
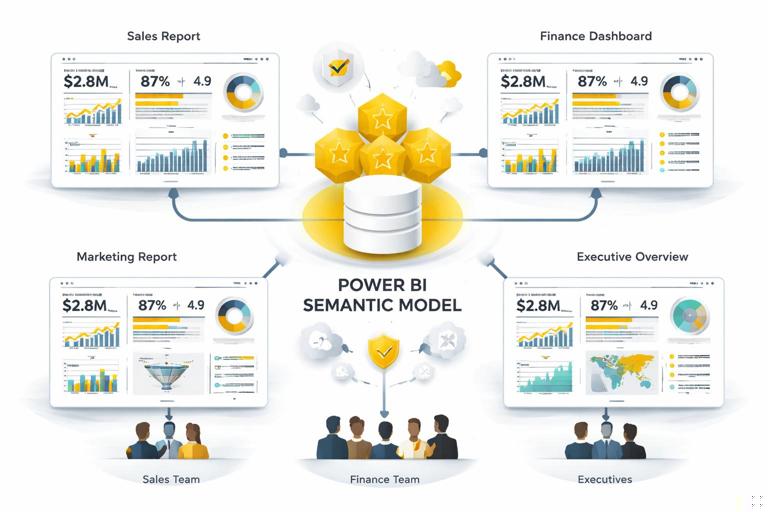
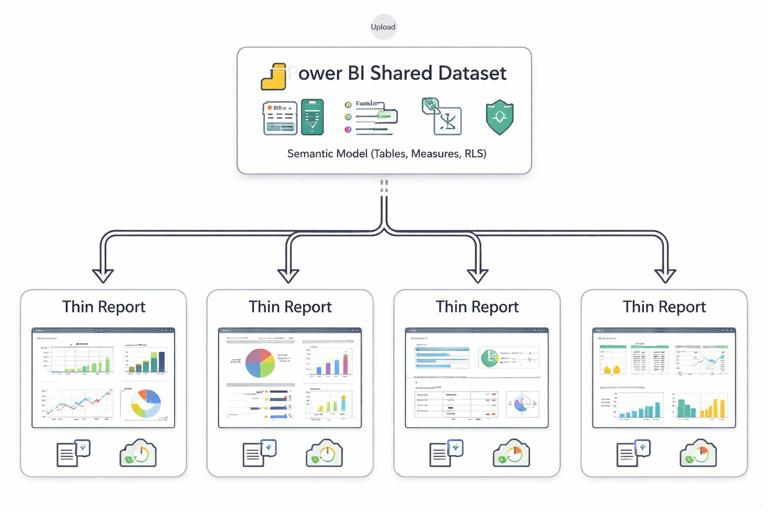
Operationalizing Reuse: Shared Datasets and Thin Reports
Separate the semantic model from report files. A common reusable architecture is a shared semantic model (dataset) that contains tables, relationships, measures, and security, and multiple “thin reports” that connect to it. Thin reports focus on visuals and storytelling while inheriting the same definitions and governance.
Versioning and change control. Reuse requires stability. Treat measure changes like API changes: avoid breaking renames, document changes in descriptions, and test downstream reports. When you must change a KPI definition, consider adding a new measure (e.g., [Net Sales v2]) and deprecating the old one with a clear timeline.
Performance is part of trust. Slow reports feel unreliable. A reusable model should prioritize efficient relationships, avoid unnecessary columns, and keep measures optimized. When performance is consistent, users are more likely to rely on the numbers and explore confidently.