Why resource management and scheduling controls matter
Kubernetes is a shared-systems scheduler: it decides where Pods run, how much compute they can consume, and how failures are handled. If you leave these decisions implicit, you often get one of two outcomes: noisy-neighbor behavior (one workload starves others) or fragile reliability (a single node failure takes out too much capacity). This chapter focuses on three connected areas you use daily as a developer/operator: (1) resource management (requests/limits and quotas), (2) scheduling controls (placement rules and disruption handling), and (3) reliability guardrails (health probes, disruption budgets, and safe eviction behavior).
Resource requests and limits: the scheduler’s contract
Kubernetes schedules Pods based on requests, not limits. Requests are what a container is guaranteed (subject to node capacity), and they are the primary input to bin-packing. Limits are enforcement boundaries: the container cannot exceed them (CPU is throttled; memory overage triggers OOM kill). Understanding this contract helps you avoid both overprovisioning and instability.
CPU: throttling vs. fairness
CPU is a compressible resource. If a container hits its CPU limit, it is throttled, which can increase latency but usually does not crash the process. Requests influence CPU shares under contention. A common pattern is to set CPU requests near typical usage and CPU limits somewhat higher to allow bursts, but not so high that a single Pod can monopolize a node.
Memory: OOM kills are reliability events
Memory is not compressible. If a container exceeds its memory limit, the kernel OOM killer terminates it. This can cause restarts, cascading failures, and thundering herds. Memory requests should reflect steady-state usage plus headroom for spikes (caches, JVM heap growth, traffic bursts). Memory limits should be set carefully; too low causes frequent OOM kills, too high reduces packing efficiency.
Ephemeral storage: the often-forgotten third resource
Pods also consume node disk via container layers, logs, and emptyDir volumes. If you ignore ephemeral storage, nodes can fill up and start evicting Pods. Kubernetes supports ephemeral-storage requests/limits to make this visible to the scheduler and to eviction logic.
- Listen to the audio with the screen off.
- Earn a certificate upon completion.
- Over 5000 courses for you to explore!

Download the app
Example: setting requests/limits for a web API
The following Deployment shows a pragmatic baseline. Adjust values after observing real usage (see later sections on guardrails and tuning).

apiVersion: apps/v1
kind: Deployment
metadata:
  name: api
spec:
  replicas: 3
  selector:
    matchLabels:
      app: api
  template:
    metadata:
      labels:
        app: api
    spec:
      containers:
      - name: api
        image: example.com/api:1.0.0
        ports:
        - containerPort: 8080
        resources:
          requests:
            cpu: "250m"
            memory: "512Mi"
            ephemeral-storage: "256Mi"
          limits:
            cpu: "1000m"
            memory: "1Gi"
            ephemeral-storage: "1Gi"
Interpretation: the scheduler reserves 250 millicores and 512Mi per replica, so three replicas reserve 750m CPU and 1.5Gi memory cluster-wide. The container can burst up to 1 core, but if it tries to exceed 1Gi memory it will be killed and restarted.
Quality of Service (QoS) classes and eviction priority
Kubernetes assigns Pods a QoS class based on requests and limits. This affects eviction order during node pressure (memory, disk). The three classes are:
- Guaranteed: every container has requests == limits for CPU and memory. Highest priority; evicted last.
- Burstable: at least one request is set, but requests != limits (or some limits missing). Middle priority; common for most services.
- BestEffort: no requests/limits set. Lowest priority; evicted first and most likely to suffer from contention.
As a reliability guardrail, avoid BestEffort for production workloads. Even small requests dramatically improve stability because the scheduler can make informed placement decisions and the kubelet can prioritize correctly under pressure.
Namespace-level guardrails: ResourceQuota and LimitRange
Even with per-Pod resources, teams can accidentally over-consume a cluster. Namespace-level controls provide a safety net.
ResourceQuota: cap total consumption
ResourceQuota limits aggregate usage in a namespace: total CPU/memory requests and limits, number of Pods, Services, PVCs, etc. This prevents runaway scaling or misconfigured Deployments from exhausting the cluster.
apiVersion: v1
kind: ResourceQuota
metadata:
  name: team-a-quota
  namespace: team-a
spec:
  hard:
    requests.cpu: "8"
    requests.memory: "16Gi"
    limits.cpu: "16"
    limits.memory: "32Gi"
    pods: "50"
Practical effect: if a new Deployment would push the namespace above 8 CPU requested, it will be rejected at admission time, forcing a deliberate capacity discussion.
LimitRange: enforce defaults and min/max
LimitRange can set default requests/limits and enforce minimums/maximums per container. This is useful when developers forget to specify resources or choose unrealistic values.
apiVersion: v1
kind: LimitRange
metadata:
  name: default-limits
  namespace: team-a
spec:
  limits:
  - type: Container
    defaultRequest:
      cpu: "100m"
      memory: "256Mi"
    default:
      cpu: "500m"
      memory: "512Mi"
    min:
      cpu: "50m"
      memory: "128Mi"
    max:
      cpu: "2"
      memory: "4Gi"
With this in place, a container without explicit resources will still get reasonable defaults (and thus avoid BestEffort).
Step-by-step: right-sizing a workload safely
Right-sizing is iterative. The goal is to set requests close to typical usage (for efficient packing) and limits to protect the node and neighbors (for safety). A practical workflow:
Step 1: start with conservative requests and limits
Pick initial values based on local profiling, staging load tests, or known runtime characteristics. For JVM services, consider heap + native memory + overhead; for Go/Node, consider peak allocations and concurrency.
Step 2: observe real usage over time
Use your metrics stack to view per-container CPU and memory usage percentiles (p50/p90/p99) over representative periods (business hours, batch windows). Focus on:
- CPU usage vs. CPU request (are you requesting 10x what you use?)
- Memory usage high-water marks vs. memory limit (are you close to OOM?)
- Restart counts and OOMKilled events
Step 3: adjust requests to match steady-state
Set CPU requests near p50–p90 depending on latency sensitivity and contention risk. Set memory requests near p90 of steady-state plus a buffer for spikes. If you run multiple replicas, remember that synchronized spikes can happen (e.g., cache warmups after deploy).
Step 4: set limits as a guardrail, not a target
CPU limits can be omitted for some latency-sensitive services to avoid throttling, but that requires strong cluster governance and careful node sizing. Memory limits should usually exist to prevent node-wide OOM scenarios, but they must be high enough to avoid frequent kills.
Step 5: validate under failure and load
Test behavior when a node is drained, when a Pod is evicted, and when traffic spikes. Ensure your autoscaling and disruption controls (below) keep availability within SLOs.
Scheduling controls: placing Pods intentionally
Scheduling is not just “find any node with capacity.” You often need to encode constraints: run on specific hardware, spread replicas, avoid co-locating risky workloads, or keep stateful components near storage.
Node labels and nodeSelector
Nodes can be labeled (e.g., cpu-optimized, gpu, zone). A simple nodeSelector pins Pods to nodes with matching labels.
apiVersion: v1
kind: Pod
metadata:
  name: cpu-bound-worker
spec:
  nodeSelector:
    nodepool: compute
  containers:
  - name: worker
    image: example.com/worker:1.0.0
Use this for coarse placement. For more complex rules, prefer node affinity.
Node affinity: expressive placement rules
Node affinity supports required and preferred rules. Required rules are hard constraints; preferred rules influence scoring.
apiVersion: apps/v1
kind: Deployment
metadata:
  name: api
spec:
  replicas: 3
  selector:
    matchLabels:
      app: api
  template:
    metadata:
      labels:
        app: api
    spec:
      affinity:
        nodeAffinity:
          requiredDuringSchedulingIgnoredDuringExecution:
            nodeSelectorTerms:
            - matchExpressions:
              - key: kubernetes.io/arch
                operator: In
                values: ["amd64"]
          preferredDuringSchedulingIgnoredDuringExecution:
          - weight: 50
            preference:
              matchExpressions:
              - key: nodepool
                operator: In
                values: ["general"]
      containers:
      - name: api
        image: example.com/api:1.0.0
This ensures the Pod only runs on amd64 nodes, and prefers the “general” pool when possible.
Taints and tolerations: keep the wrong Pods out
Taints mark nodes as special; Pods must have matching tolerations to land there. This is ideal for dedicated nodes (e.g., batch, GPU, infra add-ons) or for protecting critical system nodes from random workloads.
apiVersion: apps/v1
kind: Deployment
metadata:
  name: gpu-inference
spec:
  replicas: 1
  selector:
    matchLabels:
      app: gpu-inference
  template:
    metadata:
      labels:
        app: gpu-inference
    spec:
      tolerations:
      - key: "nvidia.com/gpu"
        operator: "Exists"
        effect: "NoSchedule"
      containers:
      - name: inference
        image: example.com/inference:2.1.0
Without the toleration, the Pod will remain Pending if only GPU-tainted nodes have capacity.
Pod affinity/anti-affinity: co-locate or separate replicas
Anti-affinity is a key reliability tool: it prevents replicas from landing on the same node (or same zone), reducing correlated failures.
apiVersion: apps/v1
kind: Deployment
metadata:
  name: api
spec:
  replicas: 3
  selector:
    matchLabels:
      app: api
  template:
    metadata:
      labels:
        app: api
    spec:
      affinity:
        podAntiAffinity:
          requiredDuringSchedulingIgnoredDuringExecution:
          - labelSelector:
              matchLabels:
                app: api
            topologyKey: kubernetes.io/hostname
      containers:
      - name: api
        image: example.com/api:1.0.0
This forces replicas onto different nodes. If the cluster is small, this can make Pods unschedulable; in that case, switch to preferred anti-affinity or increase node count.
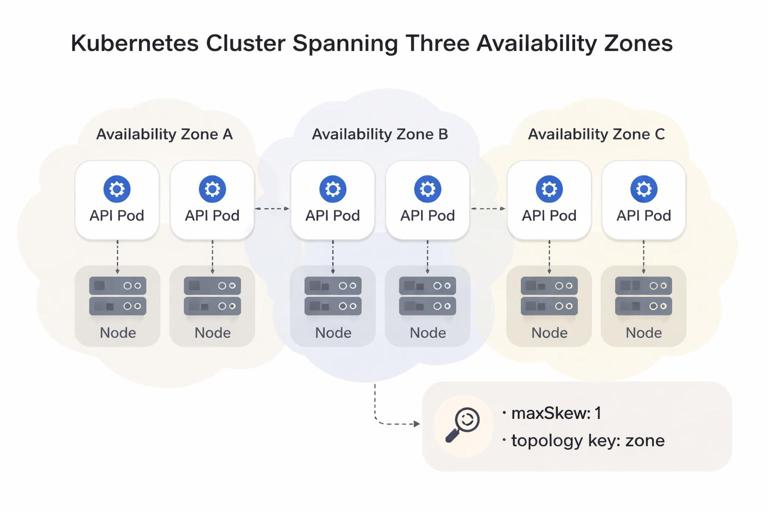
Topology spread constraints: even distribution across zones
Topology spread constraints are often easier to reason about than anti-affinity for multi-zone clusters. They aim for balanced placement across a topology domain (zone, node, etc.).
apiVersion: apps/v1
kind: Deployment
metadata:
  name: api
spec:
  replicas: 6
  selector:
    matchLabels:
      app: api
  template:
    metadata:
      labels:
        app: api
    spec:
      topologySpreadConstraints:
      - maxSkew: 1
        topologyKey: topology.kubernetes.io/zone
        whenUnsatisfiable: DoNotSchedule
        labelSelector:
          matchLabels:
            app: api
      containers:
      - name: api
        image: example.com/api:1.0.0
With three zones and six replicas, the scheduler tries to keep the difference between zones at most 1 replica.
Reliability guardrails: health probes and safe rollouts under pressure
Even with perfect scheduling, Pods will crash, hang, or become unhealthy. Probes provide automated detection and recovery, and they interact with resource pressure (CPU throttling can delay readiness; memory pressure can cause slow responses).
Startup, readiness, and liveness probes
- Startup probe: for slow-starting apps. It disables liveness failures until startup succeeds.
- Readiness probe: controls whether the Pod receives traffic. Use it to remove Pods from Service endpoints during warmup or dependency outages.
- Liveness probe: restarts the container if it is stuck. Use carefully; a too-aggressive liveness probe can cause restart loops during transient load.
apiVersion: apps/v1
kind: Deployment
metadata:
  name: api
spec:
  replicas: 3
  selector:
    matchLabels:
      app: api
  template:
    metadata:
      labels:
        app: api
    spec:
      containers:
      - name: api
        image: example.com/api:1.0.0
        ports:
        - containerPort: 8080
        startupProbe:
          httpGet:
            path: /health/startup
            port: 8080
          failureThreshold: 30
          periodSeconds: 2
        readinessProbe:
          httpGet:
            path: /health/ready
            port: 8080
          periodSeconds: 5
          timeoutSeconds: 2
          failureThreshold: 3
        livenessProbe:
          httpGet:
            path: /health/live
            port: 8080
          periodSeconds: 10
          timeoutSeconds: 2
          failureThreshold: 3
Practical tip: make readiness reflect “can serve requests now” (dependencies reachable, caches warmed enough), and make liveness reflect “process is irrecoverably stuck.” If your app can self-heal without restart, keep liveness conservative.
Disruption management: PodDisruptionBudget and graceful termination
Not all failures are crashes. Nodes are drained for maintenance, clusters autoscale, and workloads are rescheduled. Kubernetes calls these voluntary disruptions. Without guardrails, a drain can evict too many replicas at once.
PodDisruptionBudget (PDB): keep enough replicas available
A PDB limits how many Pods can be unavailable during voluntary disruptions. It does not prevent involuntary disruptions (node crash), but it strongly improves safety during drains and upgrades.
apiVersion: policy/v1
kind: PodDisruptionBudget
metadata:
  name: api-pdb
spec:
  minAvailable: 2
  selector:
    matchLabels:
      app: api
With three replicas, this allows at most one unavailable Pod during a drain. If you scale down to two replicas, the PDB becomes stricter; plan PDBs alongside replica counts and maintenance procedures.
Graceful termination: terminationGracePeriodSeconds and preStop
When a Pod is terminated, Kubernetes sends SIGTERM and waits for the grace period before SIGKILL. For HTTP services, you want enough time to stop accepting new requests and finish in-flight work.
apiVersion: apps/v1
kind: Deployment
metadata:
  name: api
spec:
  replicas: 3
  selector:
    matchLabels:
      app: api
  template:
    metadata:
      labels:
        app: api
    spec:
      terminationGracePeriodSeconds: 30
      containers:
      - name: api
        image: example.com/api:1.0.0
        lifecycle:
          preStop:
            exec:
              command: ["/bin/sh", "-c", "sleep 10"]
The preStop hook is a simple way to delay termination so load balancers and Service endpoints have time to stop routing traffic. Prefer implementing proper shutdown in the app (stop accepting connections, drain requests) and use preStop as a buffer.
Node pressure, evictions, and priority
When nodes run low on memory or disk, the kubelet may evict Pods to protect node stability. Your resource settings influence who gets evicted first (QoS), but you can also use PriorityClass to ensure critical workloads survive longer during pressure.
PriorityClass: define what is most important
Priority affects scheduling order and eviction preference. Higher-priority Pods can preempt lower-priority Pods if the cluster is full (depending on configuration). Use this sparingly and only for truly critical components.
apiVersion: scheduling.k8s.io/v1
kind: PriorityClass
metadata:
  name: production-critical
value: 100000
globalDefault: false
description: "Critical production workloads"
apiVersion: apps/v1
kind: Deployment
metadata:
name: api
spec:
replicas: 3
selector:
matchLabels:
app: api
template:
metadata:
labels:
app: api
spec:
priorityClassName: production-critical
containers:
- name: api
image: example.com/api:1.0.0Combine priority with sane quotas; otherwise, everything becomes “critical,” defeating the purpose.
Step-by-step: designing a resilient placement strategy
Use this checklist when you want predictable availability during node failures and maintenance.
Step 1: decide your failure domains
Identify what you want to survive: a single Pod crash, a node loss, or a zone loss. This determines whether you need anti-affinity by hostname, topology spread across zones, or both.
Step 2: set replica count to match the failure domain
To tolerate one node loss with strict anti-affinity across nodes, you need at least two nodes and at least two replicas. To tolerate a zone loss, you typically need at least three replicas spread across three zones (or more, depending on capacity and SLO).
Step 3: encode placement rules
- Use topology spread constraints across zones for balanced distribution.
- Use required pod anti-affinity across hostnames for strict separation when replica count and node count allow it.
- Use node affinity to keep workloads on the right node pools (e.g., ARM vs amd64, SSD vs HDD).
- Use taints/tolerations to isolate special nodes.
Step 4: add disruption protection
Create a PDB that matches your minimum safe capacity. For example, if your service can handle traffic with 2 replicas, set minAvailable: 2. If you run 10 replicas and can lose 2 during maintenance, set maxUnavailable: 2.
Step 5: validate with a controlled drain
In a non-production environment (or a controlled window), cordon and drain a node and observe:
- Do Pods reschedule quickly, or do placement rules make them Pending?
- Does the PDB block eviction as expected?
- Do readiness probes prevent traffic to warming Pods?
- Do termination settings prevent dropped requests?
Common failure patterns and how to prevent them
Pattern: Pending Pods due to over-constrained scheduling
Symptoms: Pods stuck in Pending with events mentioning affinity/anti-affinity or insufficient resources. Fixes:
- Switch required anti-affinity to preferred when cluster size is small.
- Reduce requests if they exceed node capacity, or use larger nodes.
- Ensure node labels match what your affinity expects.
- Use topology spread with
whenUnsatisfiable: ScheduleAnywayif strictness is too high for normal operations.
Pattern: frequent OOMKilled restarts
Symptoms: container restarts with reason OOMKilled, increased latency, cascading retries. Fixes:
- Increase memory limit and request; verify the app’s memory behavior (caches, heap sizing).
- Reduce concurrency or batch sizes to cap peak allocations.
- Ensure probes are not triggering restarts during GC pauses or load spikes.
Pattern: CPU throttling causes timeouts
Symptoms: high request latency, probe failures, timeouts under load, CPU usage near limit. Fixes:
- Increase CPU limit or remove CPU limit for latency-critical services (with governance).
- Increase CPU request so the Pod gets more guaranteed share under contention.
- Scale out replicas if the service is horizontally scalable.
Pattern: maintenance drains take down too much capacity
Symptoms: node drain evicts many Pods, traffic errors spike. Fixes:
- Add or tighten PDBs.
- Ensure readiness probes are correct so new Pods only receive traffic when ready.
- Use topology spread/anti-affinity so replicas are not concentrated on one node.