Why Autoscaling Exists: Matching Capacity to Real Demand
Autoscaling is the practice of adjusting compute capacity automatically so your application can handle changing load without constant manual intervention. In Kubernetes, autoscaling typically means changing either the number of Pods (horizontal scaling) or the CPU/memory requests of Pods (vertical scaling). These two approaches solve different problems and have different trade-offs.
Two core autoscalers you will use are:
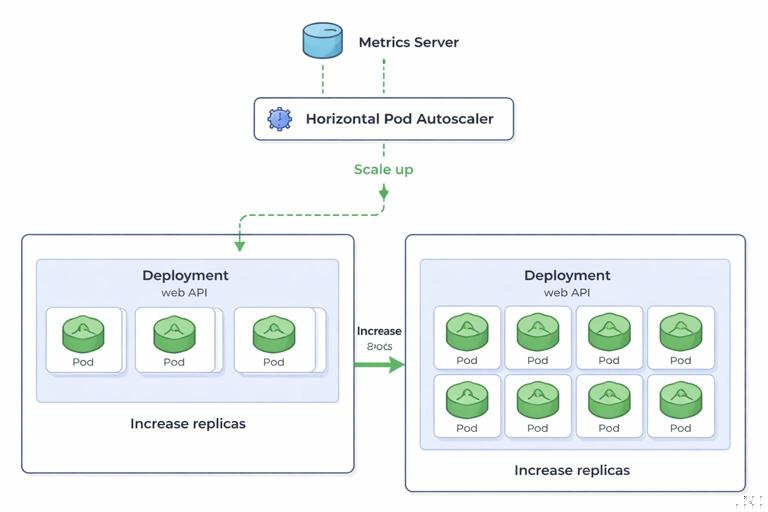
- Horizontal Pod Autoscaler (HPA): changes the number of replicas for a workload (usually a Deployment). It reacts to metrics such as CPU utilization, memory utilization, or custom metrics (like requests per second).
- Vertical Pod Autoscaler (VPA): changes the resource requests (and optionally limits) for containers in a Pod. It recommends or applies new requests based on observed usage, typically requiring Pod restarts to take effect.
In practice, HPA is often used to absorb traffic spikes by adding replicas, while VPA is used to right-size containers over time so they request what they actually need. You can use both, but you must understand how they interact to avoid conflicting behavior.
HPA Fundamentals: Scaling Out with Metrics
What HPA Actually Controls
HPA targets a scalable resource (most commonly a Deployment) and adjusts its spec.replicas based on observed metrics. HPA does not directly “add CPU” to a Pod; it adds or removes Pods. This works best when your application is stateless or can scale horizontally (for example, web APIs, workers pulling from a queue, or event handlers).
How HPA Computes Desired Replicas
At a high level, HPA compares a current metric value to a target and computes a desired replica count. For CPU utilization, the classic formula is conceptually:
- Listen to the audio with the screen off.
- Earn a certificate upon completion.
- Over 5000 courses for you to explore!

Download the app
desiredReplicas = currentReplicas * ( currentMetric / targetMetric )For example, if you have 4 replicas and CPU utilization is 80% while your target is 50%, HPA will aim for roughly 4 * (0.8/0.5) = 6.4, rounding up to 7 replicas (subject to min/max and stabilization rules).
Important nuance: CPU utilization in HPA is based on requests, not limits. If a container requests 200m CPU and is using 100m, that is 50% utilization. This is why accurate requests matter for predictable HPA behavior, even if you are not focusing on resource management details in this chapter.
Prerequisites: Metrics Availability
HPA needs metrics. For CPU and memory utilization, Kubernetes typically relies on the Metrics API (commonly provided by a metrics server). For custom metrics (like QPS, queue depth, or latency), you need a custom metrics pipeline (often via Prometheus adapters). Conceptually, your cluster must be able to answer: “What is the current value of metric X for these Pods?”
When metrics are missing or delayed, HPA may not scale as expected. You should treat metrics availability as part of the autoscaling feature, not an optional add-on.
Creating an HPA: Step-by-Step
This section walks through a practical HPA setup for a typical HTTP API Deployment. The focus is on the autoscaling objects and behavior rather than on how to build the app image or expose it via Ingress (covered elsewhere).
Step 1: Start with a Deployment that Can Scale
Assume you already have a Deployment named api in namespace prod. It should be safe to run multiple replicas (no reliance on local disk state, no singleton assumptions, etc.).
Check current replicas:
kubectl -n prod get deploy apiStep 2: Decide on a Scaling Signal and Target
Common choices:
- CPU utilization: good default for compute-bound services.
- Memory utilization: sometimes useful, but memory can be “sticky” and not drop quickly after load decreases.
- Custom metrics: best when CPU is not correlated with load (for example, I/O-bound services) or when you want to scale on business signals (queue depth, request rate).
For a first HPA, CPU utilization is a reasonable starting point. Pick a target that leaves headroom. Many teams start around 50–70% average CPU utilization and adjust based on latency and cost goals.
Step 3: Create an HPA Manifest (autoscaling/v2)
Use autoscaling/v2 so you can define richer behavior controls. Example:
apiVersion: autoscaling/v2
kind: HorizontalPodAutoscaler
metadata:
  name: api-hpa
  namespace: prod
spec:
  scaleTargetRef:
    apiVersion: apps/v1
    kind: Deployment
    name: api
  minReplicas: 3
  maxReplicas: 20
  metrics:
  - type: Resource
    resource:
      name: cpu
      target:
        type: Utilization
        averageUtilization: 60
  behavior:
    scaleUp:
      stabilizationWindowSeconds: 0
      policies:
      - type: Percent
        value: 100
        periodSeconds: 60
      - type: Pods
        value: 4
        periodSeconds: 60
      selectPolicy: Max
    scaleDown:
      stabilizationWindowSeconds: 300
      policies:
      - type: Percent
        value: 20
        periodSeconds: 60
      selectPolicy: Max
What this does:
minReplicasensures baseline capacity (and avoids scaling to 1 when you need redundancy).maxReplicascaps cost and prevents runaway scaling if metrics go wrong.averageUtilization: 60targets 60% CPU utilization averaged across Pods.behavior.scaleUpallows aggressive scale-up (up to 100% per minute or 4 Pods per minute, whichever is larger).behavior.scaleDownis conservative (stabilization window of 5 minutes and max 20% reduction per minute) to avoid flapping.
Step 4: Apply and Inspect
kubectl apply -f api-hpa.yaml
kubectl -n prod get hpa api-hpa
kubectl -n prod describe hpa api-hpa
In describe, look for:
- Current metrics vs target
- Conditions such as
AbleToScale,ScalingActive,ScalingLimited - Events indicating scale decisions
Step 5: Generate Load and Observe Scaling
Use a load generator from inside the cluster (so you avoid external network variability). For example, run a temporary Pod that repeatedly calls your service. The exact command depends on your service address, but the workflow is:
- Start load
- Watch HPA and Deployment replicas
- Stop load
- Watch scale-down behavior (which should be slower and stabilized)
kubectl -n prod get hpa api-hpa -wkubectl -n prod get deploy api -wIf scaling does not occur, the most common causes are missing metrics, a target that is too high, or an application that is not actually consuming CPU under load (for example, it is I/O-bound and waiting on a database).
HPA Design Choices and Common Pitfalls
Pick Metrics that Correlate with User Experience
CPU is easy to start with but does not always correlate with latency. If your service spends time waiting on downstream dependencies, CPU may stay low while latency rises. In those cases, consider custom metrics such as:
- Requests per second per Pod
- Queue depth (for worker systems)
- In-flight requests
- Latency SLO burn rate (advanced and requires careful design)
When using custom metrics, ensure you understand the aggregation: are you scaling on an average across Pods, a sum, or a per-Pod value? A mismatch can lead to over-scaling or under-scaling.
Avoid Scaling on Memory Unless You Understand the Dynamics
Memory usage can remain high due to caching, fragmentation, or runtime behavior. If you scale down based on memory, you may keep replicas high long after load drops. If you scale up based on memory, you may add replicas when the real issue is a memory leak. Memory-based HPA can be useful, but treat it as a deliberate choice with monitoring and testing.
Stabilization and Flapping
Without stabilization, HPA can oscillate: scale up quickly, then scale down quickly, then scale up again. The behavior field in autoscaling/v2 is your main tool to control this. A common pattern is:
- Fast scale-up to protect latency and availability
- Slow scale-down to avoid churn and cold-start penalties
Cold Starts and Readiness
HPA assumes that new replicas become ready quickly enough to help. If your Pods take 2–3 minutes to start, HPA may always be “behind” traffic spikes. In that case, you can:
- Increase
minReplicasto keep warm capacity - Scale on predictive signals (queue depth) rather than reactive CPU
- Reduce startup time (application and initialization work)
Multiple Metrics and the “Max” Effect
HPA can use multiple metrics. In general, it computes a desired replica count for each metric and chooses the highest. This is useful (it scales when any important signal indicates pressure), but it can surprise you if one metric is noisy. If you add a second metric, validate it under load tests and consider stabilization policies.
VPA Fundamentals: Right-Sizing Pods Over Time
What VPA Controls
VPA focuses on adjusting container resource requests (and sometimes limits) based on observed usage. It answers: “How much CPU and memory should this container request so it is scheduled appropriately and has enough headroom?”
VPA is especially useful when:
- You have many services and manual right-sizing is not scalable
- Workloads change behavior over time (new features, new traffic patterns)
- You want to reduce waste from over-requesting resources
VPA Modes: Off, Initial, Auto
VPA typically operates in one of these modes:
- Off: VPA only provides recommendations; it does not change Pods.
- Initial: VPA sets requests when Pods are created, but does not update running Pods.
- Auto: VPA can update requests over time, which usually requires evicting Pods so they restart with new requests.
Because applying new requests often requires Pod restarts, VPA is not a “free” optimization. You must ensure your workload can tolerate restarts and that disruption is acceptable.
How VPA Makes Recommendations
VPA collects historical usage and computes recommended requests. It typically provides:
- Lower bound: a conservative minimum
- Target: a balanced recommendation
- Upper bound: a safe maximum
You can use these recommendations to tune your workloads, or let VPA apply them automatically depending on your chosen mode.
Creating a VPA: Step-by-Step
VPA requires a VPA controller installed in the cluster. The exact installation method depends on your environment, but from a user perspective, you create a VerticalPodAutoscaler object targeting your workload.
Step 1: Start in Recommendation-Only Mode
Begin with updateMode: Off to observe recommendations without changing running Pods.
apiVersion: autoscaling.k8s.io/v1
kind: VerticalPodAutoscaler
metadata:
  name: api-vpa
  namespace: prod
spec:
  targetRef:
    apiVersion: apps/v1
    kind: Deployment
    name: api
  updatePolicy:
    updateMode: "Off"
  resourcePolicy:
    containerPolicies:
    - containerName: "*"
      controlledResources: ["cpu", "memory"]
      controlledValues: RequestsOnly
This configuration tells VPA to compute CPU and memory request recommendations for all containers in the Pod and to focus on requests (not limits).
Step 2: Apply and Read Recommendations
kubectl apply -f api-vpa.yaml
kubectl -n prod describe vpa api-vpa
In the output, look for a section like Recommendation per container, showing target/lower/upper values. If you do not see recommendations yet, it may need time to observe usage under real traffic.
Step 3: Use Recommendations to Adjust Safely
A practical workflow is:
- Run VPA in
Offmode for a few days to capture typical and peak usage patterns. - Compare recommended target to current requests.
- Manually update your Deployment requests to match a chosen point (often between target and upper bound for safety).
- Continue observing and iterate.
This approach gives you the benefits of VPA’s analysis without surprise evictions.
Step 4: Move to Initial or Auto (When Appropriate)
If your workload tolerates restarts and you want automation:
- Initial is a safer step than Auto. It improves sizing for new Pods without evicting existing ones.
- Auto provides continuous right-sizing but introduces controlled disruption.
Example switching to Initial:
spec:
  updatePolicy:
    updateMode: "Initial"
Example switching to Auto:
spec:
  updatePolicy:
    updateMode: "Auto"
If you enable Auto, ensure your application and rollout strategy can handle periodic restarts and that you have appropriate disruption controls (for example, PodDisruptionBudgets) so VPA cannot evict too many Pods at once.
Using HPA and VPA Together: Compatibility Rules
The Core Conflict: CPU Requests vs CPU Utilization
HPA CPU utilization is calculated relative to CPU requests. VPA changes CPU requests. If both are active and VPA adjusts CPU requests, the HPA’s computed utilization changes even if actual CPU usage stays the same. This can cause unexpected scaling behavior.
Common strategies:
- HPA on custom metrics + VPA on CPU/memory: avoids the CPU-request coupling. For example, scale replicas on requests-per-second, while VPA right-sizes CPU/memory.
- HPA on CPU + VPA memory-only: configure VPA to control memory requests but not CPU requests.
- Use VPA in Off/Initial mode with HPA on CPU: you still get recommendations or initial sizing without continuous request changes.
Example VPA policy to control only memory requests:
resourcePolicy:
  containerPolicies:
  - containerName: "*"
    controlledResources: ["memory"]
    controlledValues: RequestsOnly
When HPA Is Not Enough
If your Pods are consistently CPU-throttled or OOM-killed, adding replicas may not fix the problem if each replica is under-provisioned. That is where VPA recommendations can reveal that each Pod needs more memory or CPU request to be stable. Conversely, if each Pod is over-provisioned, VPA can reduce requests so the cluster can schedule more replicas efficiently.
Operational Tuning: Making Autoscaling Predictable
Choose Min/Max Replicas Based on Failure and Cost Boundaries
minReplicas should reflect redundancy needs and cold-start realities. For example, if you need to survive a node failure without losing too much capacity, you may want at least 2–3 replicas spread across nodes. maxReplicas should reflect budget and downstream limits (databases, third-party APIs). Autoscaling can amplify load on dependencies; scaling your API to 50 replicas can overwhelm a database that cannot scale similarly.
Use Behavior Policies to Match Your Traffic Pattern
For spiky traffic, allow faster scale-up. For steady traffic, you can be more conservative. A useful exercise is to write down:
- How quickly does traffic spike (seconds, minutes)?
- How quickly do new Pods become ready?
- How expensive is over-scaling vs under-scaling?
Then tune scaleUp and scaleDown policies accordingly.
Validate Autoscaling with Load Tests
Autoscaling is a control loop. You should test it like any other system behavior:
- Run a baseline load and confirm no unnecessary scaling occurs.
- Introduce a step increase in load and measure time-to-scale and latency impact.
- Introduce a step decrease and confirm scale-down is stable and not oscillating.
- Repeat with different targets (e.g., 50%, 60%, 70% CPU) to find the best trade-off.
Know What HPA and VPA Do Not Solve
Autoscaling does not fix:
- Slow downstream dependencies (it may worsen them by increasing concurrency)
- Global rate limits (you may need backpressure or client-side throttling)
- Stateful singletons that cannot scale horizontally
- Memory leaks (VPA may keep increasing requests, masking the issue)
Use autoscaling as a capacity tool, but keep performance and correctness work separate: if latency rises due to a database bottleneck, scaling the API may not help.
Hands-On Troubleshooting Checklist
HPA Troubleshooting
- HPA shows “unknown” metrics: verify metrics API availability and that Pods are reporting CPU/memory usage.
- No scaling under load: check whether the metric actually increases; confirm the target is reachable; inspect
describe hpaevents. - Scaling too aggressively: reduce scale-up policies, increase stabilization, or adjust target utilization upward.
- Scaling too slowly: increase scale-up limits, reduce stabilization, or increase
minReplicasto keep warm capacity.
VPA Troubleshooting
- No recommendations: ensure VPA components are installed and running; allow time and traffic for data collection.
- Recommendations seem too high: check for periodic spikes, batch jobs, or memory growth patterns; consider setting container policies or using upper bounds.
- Auto mode causes disruption: consider switching to Initial, tightening eviction behavior, or limiting which resources VPA controls.