What Prometheus and Grafana Do in a Kubernetes Monitoring Stack
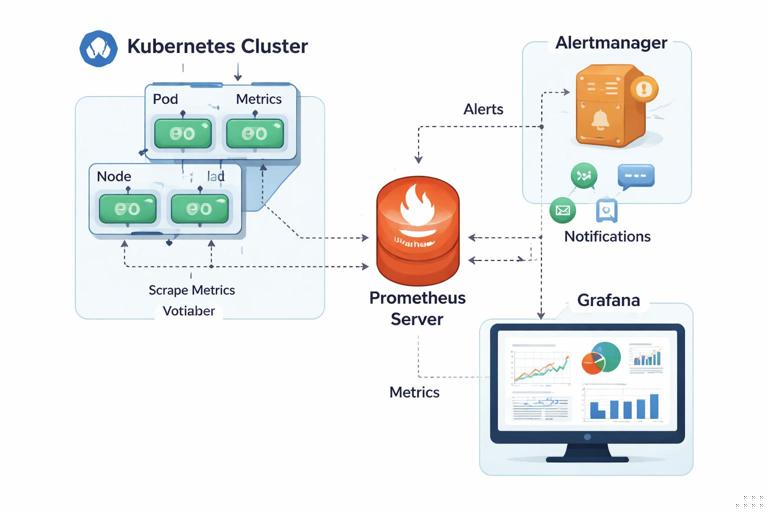
Prometheus and Grafana are commonly paired to deliver a practical monitoring and alerting workflow in Kubernetes. Prometheus is the metrics database and query engine: it scrapes metrics endpoints, stores time series, and evaluates alert rules. Grafana is the visualization layer: it queries Prometheus (and other sources) to render dashboards, explore metrics, and support on-call troubleshooting.
In Kubernetes, the key idea is that you do not manually configure every scrape target. Instead, you rely on Kubernetes-native discovery and custom resources (when using the Prometheus Operator) to select which Pods/Services to scrape and how. This chapter focuses on the basics you need as a developer: what gets scraped, how to query it, how to build dashboards, and how to create actionable alerts.
Core components you will encounter
- Prometheus server: scrapes metrics, stores them, runs PromQL queries, evaluates alert rules.
- Alertmanager: receives alerts from Prometheus, groups/deduplicates, routes notifications (Slack, email, PagerDuty, etc.).
- Grafana: dashboards, ad-hoc exploration, alerting (optional; many teams still use Prometheus+Alertmanager for rule evaluation and routing).
- kube-state-metrics: exposes Kubernetes object state as metrics (Deployments, Pods, Nodes, etc.).
- node-exporter: exposes node-level CPU/memory/disk/network metrics.
- application metrics endpoint: your service exposes metrics (often at
/metrics) in Prometheus format.
Installing a Baseline Stack with kube-prometheus-stack
The most common “batteries included” installation is the Helm chart kube-prometheus-stack (from the Prometheus Community). It installs Prometheus (via the Operator), Alertmanager, Grafana, and a set of default dashboards and rules. The Operator introduces CRDs like ServiceMonitor, PodMonitor, and PrometheusRule so you can configure monitoring declaratively.
Step-by-step: install into a monitoring namespace
Assuming you already have Helm available and a cluster context selected:
kubectl create namespace monitoringhelm repo add prometheus-community https://prometheus-community.github.io/helm-chartshelm repo updatehelm install monitoring prometheus-community/kube-prometheus-stack -n monitoringAfter installation, verify the main Pods:
- Listen to the audio with the screen off.
- Earn a certificate upon completion.
- Over 5000 courses for you to explore!

Download the app
kubectl get pods -n monitoringYou should see Pods for Prometheus, Alertmanager, Grafana, and exporters. If you want quick local access for learning, use port-forwarding:
kubectl -n monitoring port-forward svc/monitoring-kube-prometheus-stack-prometheus 9090:9090kubectl -n monitoring port-forward svc/monitoring-grafana 3000:80Grafana credentials are typically stored in a Secret created by the chart. Retrieve the admin password:
kubectl -n monitoring get secret monitoring-grafana -o jsonpath='{.data.admin-password}' | base64 -dLog in to Grafana at http://localhost:3000 with username admin and the decoded password.
How Prometheus Finds Targets in Kubernetes
Prometheus can scrape targets via static configs, but in Kubernetes you usually rely on service discovery. With the Prometheus Operator, you define ServiceMonitor or PodMonitor resources that select Services/Pods via labels and specify which port/path to scrape. This keeps monitoring configuration close to the workload and makes it easy to review in Git.
ServiceMonitor vs PodMonitor
- ServiceMonitor: selects a Kubernetes Service and scrapes the endpoints behind it. This is common when you already expose a stable Service port for metrics.
- PodMonitor: scrapes Pods directly. Useful when you do not want a Service, or when you need per-Pod scraping behavior.
In both cases, the Prometheus instance must be configured to watch the namespace where the monitor object lives (or be cluster-wide). The kube-prometheus-stack defaults typically watch many namespaces, but you should confirm your chart values if you run a restricted setup.
Exposing Application Metrics for Scraping
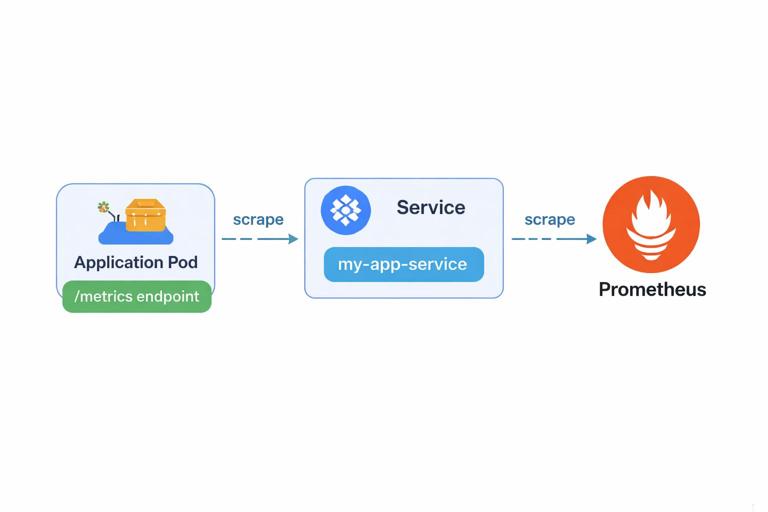
From a developer perspective, the most important requirement is: your app must expose a Prometheus-format endpoint. Many libraries do this automatically (for example, client libraries in Go, Java, Python, Node.js). The endpoint usually returns plain text with metric names, labels, and values.
Assume you have a Service named orders in namespace apps, and it exposes metrics on port name http at path /metrics. You can define a ServiceMonitor like this:
apiVersion: monitoring.coreos.com/v1
kind: ServiceMonitor
metadata:
  name: orders
  namespace: apps
  labels:
    release: monitoring
spec:
  selector:
    matchLabels:
      app: orders
  namespaceSelector:
    matchNames:
    - apps
  endpoints:
  - port: http
    path: /metrics
    interval: 30s
Notes that matter in real clusters:
- Label matching: the
selector.matchLabelsmust match labels on the Service (not the Deployment). Ensure your Service hasapp: ordersor adjust the selector. - Release label: many kube-prometheus-stack installs configure Prometheus to only pick up monitors with a specific label (often
release: monitoring). If your ServiceMonitor is ignored, check this first. - Port selection: using a named port is more stable than numeric ports when charts evolve.
Apply it:
kubectl apply -f servicemonitor-orders.yamlThen verify in Prometheus UI (Targets page) that the scrape is up. If it is down, check:
- NetworkPolicy blocking Prometheus from reaching the Pod/Service.
- Wrong port name or path.
- Service selector not matching Pods.
- Metrics endpoint requires auth (Prometheus scraping is usually unauthenticated inside the cluster; if you need auth, plan for it explicitly).
PromQL Basics You Actually Use Day-to-Day
PromQL is Prometheus’s query language. As a developer, you do not need to memorize every function, but you should be comfortable with a few patterns: selecting series, aggregating, rates for counters, and percentiles/histograms (if your app exports them).
Metric types and how they change your queries
- Counter: monotonically increasing (resets on restart). Use
rate()orincrease()over a time window. - Gauge: can go up/down (e.g., memory usage). Query directly, aggregate with
avg/max. - Histogram/Summary: for latency distributions. Histograms are preferred for aggregation across instances.
Common PromQL patterns
1) Request rate (per second) for an HTTP counter like http_requests_total:
sum(rate(http_requests_total{namespace="apps", app="orders"}[5m]))2) Error ratio (example assumes label code exists):
sum(rate(http_requests_total{app="orders", code=~"5.."}[5m]))
/
sum(rate(http_requests_total{app="orders"}[5m]))
3) P95 latency from histogram (example metric http_request_duration_seconds_bucket):
histogram_quantile(0.95,
  sum by (le) (rate(http_request_duration_seconds_bucket{app="orders"}[5m]))
)
4) CPU usage for a Pod (container CPU seconds counter from cAdvisor):
sum by (pod) (
  rate(container_cpu_usage_seconds_total{namespace="apps", pod=~"orders-.*", container!=""}[5m])
)
5) Memory working set (gauge):
sum by (pod) (
  container_memory_working_set_bytes{namespace="apps", pod=~"orders-.*", container!=""}
)
Practical tip: always start with a narrow selector (namespace/app/pod) and then add aggregation. This prevents accidentally querying the entire cluster and makes dashboards faster.
Grafana: Building Useful Dashboards (Not Just Pretty Ones)

Grafana dashboards are most valuable when they help you answer operational questions quickly: “Is the service healthy?”, “What changed?”, “Is it a dependency?”, “Is it capacity?”, “Is it an error spike or a slow-down?”
Step-by-step: add Prometheus as a data source (if not already)
kube-prometheus-stack usually preconfigures this. If you need to do it manually:
- Open Grafana → Connections/Data sources → Add data source → Prometheus.
- Set URL to the in-cluster service, typically
http://monitoring-kube-prometheus-stack-prometheus.monitoring:9090. - Save & test.
Step-by-step: create a minimal “service overview” dashboard
Create a new dashboard and add panels with these queries (adapt labels to your metrics):
- Traffic (RPS):
sum(rate(http_requests_total{app="orders"}[5m])) - Error rate (5xx):
sum(rate(http_requests_total{app="orders", code=~"5.."}[5m])) - Error ratio: 5xx / total (as shown earlier)
- P95 latency: histogram quantile query
- CPU by pod: container CPU rate
- Memory by pod: working set bytes
- Restarts:
sum(increase(kube_pod_container_status_restarts_total{namespace="apps", pod=~"orders-.*"}[15m]))
Then add variables so the same dashboard works across environments and services:
- $namespace variable: query
label_values(kube_pod_info, namespace) - $app variable: query
label_values(kube_pod_labels{namespace="$namespace"}, label_app)(depends on how labels are exposed; you may needlabel_app_kubernetes_io_nameor similar)
Update panel queries to use variables, for example:
sum(rate(http_requests_total{namespace="$namespace", app="$app"}[5m]))This approach prevents dashboard sprawl and encourages consistent labeling.
Reading dashboards during an incident
- Correlate: check traffic, errors, and latency together. A latency spike with stable traffic often indicates dependency slowness or resource contention.
- Slice by dimension: break down by
pod,route,method, orstatusto find the “hot” series. - Look for step changes: abrupt shifts often align with deploys, config changes, or node events.
Alerting Basics: What to Alert On (and What Not to)
Alerts should be actionable and tied to user impact or imminent failure. Avoid alerting on every spike; instead, use time windows, ratios, and “for” durations to reduce noise. In Prometheus, alerts are defined as rules; Prometheus evaluates them and sends firing alerts to Alertmanager.
Key alert design principles for developers
- Prefer symptoms over causes: alert on elevated error ratio or high latency rather than CPU alone. CPU can be a useful secondary alert if it predicts failure.
- Use burn-rate style thinking: if you have SLOs, alert when you are consuming error budget too fast. Even without formal SLOs, you can approximate with error ratio thresholds over multiple windows.
- Include context in annotations: what to check, links to dashboards, runbook hints.
- Set a “for” duration: require the condition to persist (e.g., 5–10 minutes) to avoid flapping.
Creating Prometheus Alert Rules with PrometheusRule
With the Operator, you define alert rules using the PrometheusRule CRD. These rules are grouped and labeled, and they become part of the Prometheus configuration automatically.
Step-by-step: create a basic alert rule file
The following example defines three alerts for a service: high error ratio, high latency, and crash looping. Adjust label selectors to match your metrics and naming.
apiVersion: monitoring.coreos.com/v1
kind: PrometheusRule
metadata:
  name: orders-alerts
  namespace: apps
  labels:
    release: monitoring
spec:
  groups:
  - name: orders.rules
    rules:
    - alert: OrdersHighErrorRatio
      expr: |
        (
          sum(rate(http_requests_total{namespace="apps", app="orders", code=~"5.."}[5m]))
          /
          sum(rate(http_requests_total{namespace="apps", app="orders"}[5m]))
        ) > 0.02
      for: 10m
      labels:
        severity: page
        service: orders
      annotations:
        summary: "High 5xx ratio for orders"
        description: "5xx ratio > 2% for 10m. Check recent deploys, dependency health, and pod logs."

    - alert: OrdersHighP95Latency
      expr: |
        histogram_quantile(0.95,
          sum by (le) (rate(http_request_duration_seconds_bucket{namespace="apps", app="orders"}[5m]))
        ) > 0.5
      for: 10m
      labels:
        severity: page
        service: orders
      annotations:
        summary: "High p95 latency for orders"
        description: "p95 > 500ms for 10m. Break down by route and check CPU/memory throttling."

    - alert: OrdersCrashLooping
      expr: |
        sum(increase(kube_pod_container_status_restarts_total{namespace="apps", pod=~"orders-.*"}[15m])) > 3
      for: 5m
      labels:
        severity: ticket
        service: orders
      annotations:
        summary: "Orders pods restarting frequently"
        description: "More than 3 restarts in 15m. Inspect pod events and container exit codes."
Apply it:
kubectl apply -f orders-alerts.yamlVerify the rule is loaded in Prometheus (Rules page). If it does not appear, check:
- The
releaselabel matches what your Prometheus instance selects. - The namespace is watched by Prometheus for rules.
- The Prometheus Operator is healthy and has permissions to read the rule.
Routing Notifications with Alertmanager (Basic Mental Model)
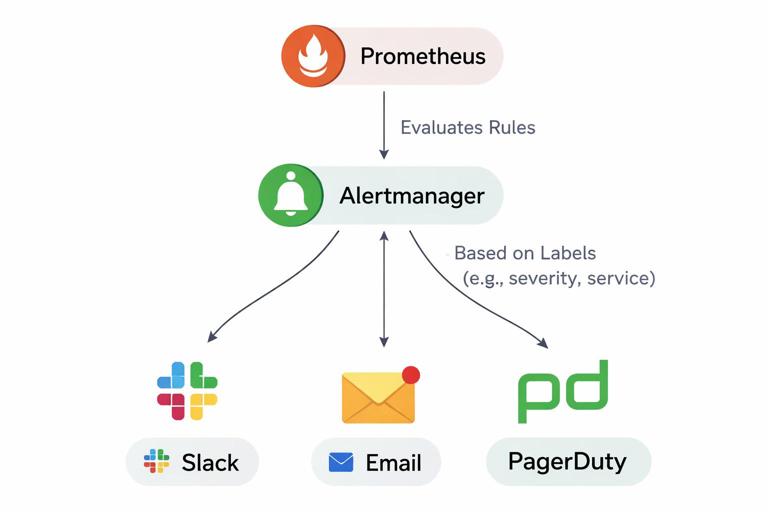
Alertmanager is responsible for turning “an alert is firing” into “a human gets notified in the right place.” It groups similar alerts, deduplicates repeats, and routes based on labels like severity, team, or service. Even if you do not manage Alertmanager configuration as a developer, you should understand how labels on your alerts influence routing.
Labels and annotations: how they are used
- Labels: used for routing and grouping (e.g.,
severity=page,service=orders,team=payments). - Annotations: used for human-readable context (summary, description, dashboard links, runbook URLs).
A practical pattern is to standardize labels across services so routing rules can be generic. For example, always include service and severity, and optionally team.
Debugging “Why Am I Not Seeing Metrics or Alerts?”
When metrics or alerts do not show up, the fastest path is to validate each link in the chain: endpoint → Service/Pod selection → scrape target → stored series → query → rule evaluation → Alertmanager routing.
Step-by-step checklist
- 1) Is the metrics endpoint reachable? Port-forward to a Pod and curl the endpoint (or exec into a debug Pod in the namespace). Confirm it returns Prometheus text format.
- 2) Does Prometheus have a target? In Prometheus UI → Status → Targets. Look for your job and endpoint; check last scrape and error messages.
- 3) Are series being ingested? In Prometheus UI, run a simple selector query for a known metric name and label filter.
- 4) Are labels what you expect? Use Prometheus’s “Graph” tab and inspect series; mismatched labels are a common reason dashboards show “No data.”
- 5) Is the alert rule loaded? Prometheus UI → Status → Rules. Confirm the rule group exists and the expression evaluates.
- 6) Is the alert firing? Prometheus UI → Alerts. If it is pending, check the
forduration; if it is inactive, check thresholds and selectors. - 7) Did Alertmanager receive it? Alertmanager UI shows active alerts and routing status. If received but not notified, routing config may filter it.
Practical Tips for Sustainable Monitoring as a Developer
Keep metric cardinality under control
Prometheus performance and cost are heavily influenced by the number of time series. Avoid unbounded labels (user IDs, request IDs, full URLs with IDs). Prefer templated route labels (e.g., /orders/:id) and bounded dimensions (status code, method, handler).
Use recording rules for expensive queries
If a dashboard panel uses a heavy query (multiple sum by, histogram_quantile across many pods), consider a recording rule to precompute it. This reduces dashboard latency and Prometheus CPU usage. Recording rules are also defined in PrometheusRule resources.
Align dashboards and alerts
Every page-level alert should have a corresponding dashboard panel (or a dashboard link) that helps you validate and triage quickly. A common annotation pattern is to include a Grafana URL with variables pre-filled for the service and namespace.
Prefer multi-window alerting for noisy signals
Single-window thresholds can be noisy. A simple improvement is to require both a short window and a longer window to be bad. For example, error ratio > 5% over 5m AND > 2% over 30m. This catches sustained issues while still reacting quickly to major incidents.
(sum(rate(http_requests_total{app="orders", code=~"5.."}[5m])) / sum(rate(http_requests_total{app="orders"}[5m])) > 0.05)
and
(sum(rate(http_requests_total{app="orders", code=~"5.."}[30m])) / sum(rate(http_requests_total{app="orders"}[30m])) > 0.02)
Using Built-in Kubernetes Metrics Effectively
Even without custom application metrics, kube-prometheus-stack provides a lot of value via kube-state-metrics and node-exporter. As a developer, these are especially useful for detecting rollout and runtime issues.
Examples of Kubernetes-focused queries
- Pods not ready:
sum by (namespace, pod) (kube_pod_status_ready{condition="true"} == 0) - Deployment unavailable replicas:
kube_deployment_status_replicas_unavailable{namespace="apps", deployment="orders"} - OOM kills (via restarts + exit reason): use restart metrics plus events/logs; you can also explore container termination reasons if exported in your setup.
- Node disk pressure: depends on node condition metrics; many stacks expose node conditions via kube-state-metrics.
These metrics help you distinguish “the app is failing” from “the platform is preventing the app from running” (unschedulable, crash looping, not ready, etc.).