Why Progress Measurement Matters (and Why “We’re About 80% Done” Isn’t Enough)
Progress measurement is the bridge between a schedule that looked good on paper and a schedule you can manage in the field. When progress is measured consistently, you can forecast finish dates, validate pay applications, detect productivity problems early, and make recovery decisions based on evidence rather than opinions. The challenge is that construction work is not naturally “percent-based.” Crews install pieces, complete areas, pass inspections, and close punch items—often in a non-linear way. That is why you need explicit rules for how percent complete is earned and, when possible, a quantity-based method that ties progress to measurable production.
This chapter focuses on two complementary approaches: (1) percent complete rules (also called “earning rules”) and (2) quantity tracking. Percent complete rules define when progress can be claimed. Quantity tracking defines how much progress has been achieved based on installed quantities. Used together, they reduce subjectivity and make schedule updates more reliable.
Key Definitions You’ll Use in the Field
Percent Complete (PC)
Percent complete is the portion of an activity’s planned work that has been earned as of the status date. In scheduling software, percent complete typically drives remaining duration, earned value (if used), and forecast dates. The critical point: percent complete should be based on a rule that is consistent across updates.
Actual Start / Actual Finish
These are dates you record when work truly begins and truly completes. Percent complete should never be used as a substitute for actual start/finish. If an activity started, record the actual start even if progress is small.
Remaining Duration
Remaining duration is your best estimate of how much working time is left to finish the activity. Some teams update percent complete and let software calculate remaining duration; other teams update remaining duration directly. Either can work, but you must be consistent and understand the math behind your method.
- Listen to the audio with the screen off.
- Earn a certificate upon completion.
- Over 5000 courses for you to explore!

Download the app
Progress “Earning”
Earning is the act of claiming progress according to a predefined rule. For example, under a 0/100 rule, you earn 0% until the activity is finished, then you earn 100% at completion.
Percent Complete Rules (Earning Rules): What They Are and When to Use Them
Percent complete rules are templates for how progress is credited. They are especially useful when quantities are hard to measure daily, when work is discrete, or when you want to avoid the noise of subjective mid-activity estimates.
Common Percent Complete Rules
- 0/100: Earn 0% until complete, then 100% at finish. Best for short activities or tasks where partial completion is not meaningful (e.g., “Inspection Passed,” “Permit Approved,” “Energize Panel”).
- 50/50: Earn 50% at start, 50% at finish. Useful for medium-length activities where you want some credit once work is truly underway, but you still want strong emphasis on finishing.
- 20/80 or 25/75: Earn a smaller portion at start and most at finish. Useful when starting is easy but finishing requires coordination, testing, punch, or inspections (e.g., “Rough-in Complete” vs. “Trim and Test Complete”).
- Units/Incremental: Earn progress in fixed increments (e.g., 10% per floor, 5% per room group, 1% per unit). This is a hybrid between percent rules and quantity tracking.
- Milestone-weighted: Earn progress when internal checkpoints are met (e.g., “Layout complete,” “Rough complete,” “Pressure test passed,” “Insulation inspection passed”). This is often the most practical for MEP and finishes when you can define objective checkpoints.
Choosing the Right Rule: Practical Guidance
Use 0/100 when partial progress does not reduce risk to the finish date. Use 50/50 or 20/80 when you want to reflect that mobilization and setup have occurred, but you still want to prevent “progress inflation.” Use milestone-weighted when the work has clear internal acceptance points. Avoid pure “subjective percent” (someone guessing 63%) unless you have no alternative and you can validate it with quantities, areas, or installed counts.
Step-by-Step: Implementing Percent Complete Rules in a Schedule Update Process
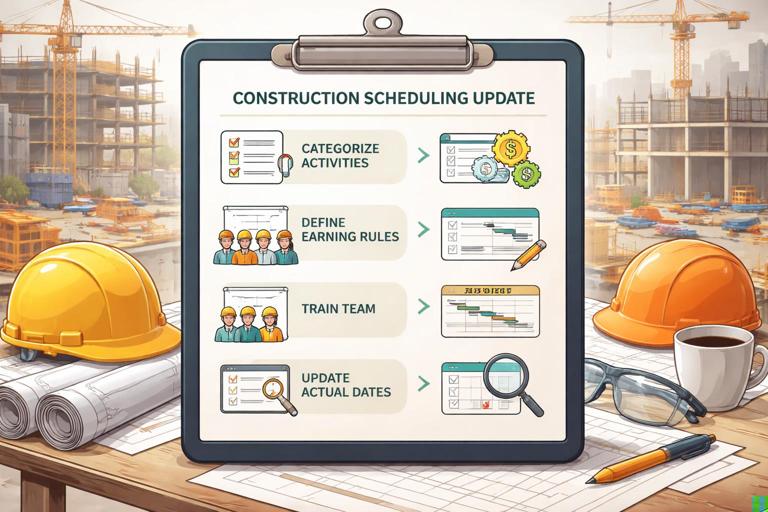
Step 1: Categorize Activities by Measurability and Risk
Before the first update cycle, group activities into categories such as:
- Discrete approvals/inspections (best: 0/100)
- Short field tasks (1–3 days) (best: 0/100 or 50/50)
- Medium tasks (4–10 days) (best: 50/50 or 20/80)
- Long production tasks (best: quantity tracking or milestone-weighted)
- Commissioning/testing (best: milestone-weighted or 0/100 per test)
This categorization prevents you from applying one rule to everything, which usually leads to distorted progress.
Step 2: Define the Earning Rule for Each Activity Type
Create a simple “progress measurement matrix” that your team can follow. Example:
Activity Type Rule Evidence Required (Minimum) Update Owner Frequency NotesInspection/Approval 0/100 Passed/issued date PM Weekly No partial creditShort field install (≤3 days) 0/100 Foreman confirms complete Supt Weekly Use actual finishMedium install (4–10 days) 50/50 Start: crew mobilized + work begun; Finish: area complete Supt Weekly Avoid “started” without laborLong production (e.g., drywall) Quantity Daily installed quantities Foreman Daily Convert to %MEP rough-in by area Milestones Layout/Rough/Test/Inspect Supt/Foreman Weekly Earn by checkpointThe “evidence required” column is what keeps percent complete from becoming a negotiation.
Step 3: Train the Team on What Counts as “Started” and “Finished”
Many progress disputes come from vague definitions. Make them explicit:
- Started means labor has been applied to the activity scope in the field (not just material delivered, not just layout planned, not just “we’re ready”).
- Finished means the defined scope is complete and ready for the next trade or acceptance step (including cleanup, required tests, and internal punch for that activity).
If you use 50/50 or 20/80, the “start” credit must be protected. A common rule is: you only claim “start” credit if the activity has an actual start date and at least one full shift of labor has been spent on it (or another objective threshold you define).
Step 4: Update Actual Dates First, Then Apply the Earning Rule
In each update cycle:
- Record actual starts and finishes based on field verification.
- Apply the earning rule to calculate percent complete.
- Review remaining duration for in-progress activities (especially those on or near the driving path).
This order matters. If you adjust percent complete without capturing actual dates, you lose the ability to analyze production trends and you risk hiding delays.
Step 5: Validate the Output with a “Reality Check”
After the update, compare the schedule’s implied progress to what you can see:
- Does the percent complete align with installed quantities or completed areas?
- Do in-progress activities show reasonable remaining durations given crew size and access?
- Are there activities showing progress even though prerequisites are not met (a sign of bad earning rules or bad field reporting)?
If the schedule says 90% complete but the area is not ready for the next trade, your rule is too generous or your evidence is too weak.
Quantity Tracking: Turning Production into Percent Complete
Quantity tracking ties progress to measurable units: linear feet, square feet, cubic yards, counts, or rooms/zones. It is the most objective method for long, repetitive work. It also supports productivity analysis because you can compare planned production rates to actual rates.
When Quantity Tracking Works Best
- Work that is repetitive and measurable (drywall, painting, flooring, earthwork, paving, conduit, pipe, duct, rebar, formwork).
- Work with clear installed units and defined total quantities.
- Work where partial completion truly reduces remaining effort (unlike approvals).
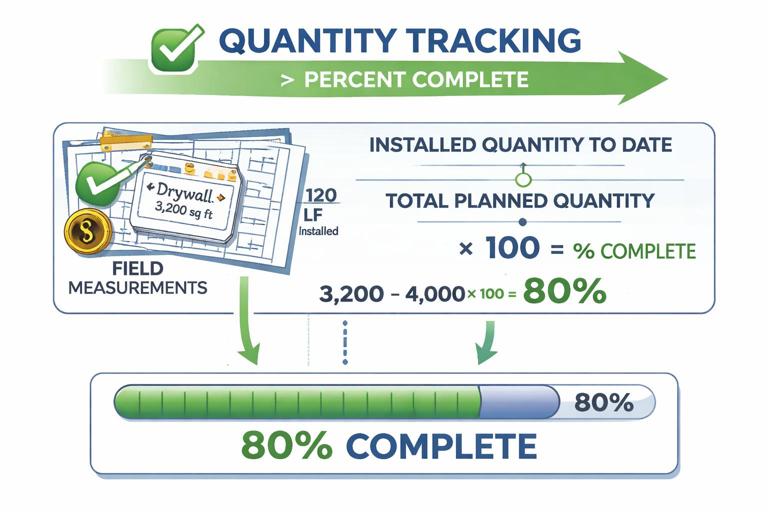
Core Formula
At its simplest:
Percent Complete = (Installed Quantity to Date / Total Planned Quantity) × 100Example: If a drywall activity includes 12,000 SF and you have hung 3,000 SF, then percent complete is 25%.
Step-by-Step: Setting Up Quantity Tracking
Step 1: Define the Measurement Unit and Total Quantity
Pick a unit that matches how the field thinks and how production happens. Examples:
- Drywall hang: square feet (SF)
- Baseboard: linear feet (LF)
- Lighting fixtures: each (EA)
- Concrete slab: cubic yards (CY) or SF with thickness standardized
- Asphalt paving: tons or SF
Set the total planned quantity from takeoff, estimate, BIM quantities, or subcontractor schedule of values. The total must be stable; if scope changes, update the total quantity and document the change so percent complete remains meaningful.
Step 2: Break Work into Trackable Segments (If Needed)
Quantity tracking can be done at one big activity level, but it is often more controllable when segmented by area, floor, or zone. Segmentation helps when access constraints or sequencing cause uneven progress.
Example segmentation for painting:
- Paint Level 1 – Walls (SF)
- Paint Level 2 – Walls (SF)
- Paint Common Areas – Walls (SF)
This avoids a situation where one small area is complete but the overall activity still looks barely started, or vice versa.
Step 3: Establish a Field Data Capture Method
Choose a method that your team will actually use:
- Daily installed quantities from foreman reports
- Area-based checklists (room/zone complete counts)
- Marked-up drawings with measured runs installed
- Photo logs paired with measured quantities (useful for validation)
Keep it simple: one unit, one total, one daily/weekly installed number. Complexity kills consistency.
Step 4: Convert Quantities to Percent Complete and Remaining Duration
Once you have installed quantity, you can compute percent complete. For remaining duration, you have two practical options:
- Option A: Remaining duration from remaining quantity and expected production rate. This is the most “field-realistic.”
- Option B: Let the schedule calculate remaining duration from percent complete, but only if original duration and production assumptions are still valid.
Option A example:
Total drywall SF = 12,000 SFInstalled to date = 3,000 SFRemaining = 9,000 SFExpected production = 1,500 SF/day (based on crew and constraints)Remaining duration = 9,000 / 1,500 = 6 daysThis method forces a conversation about whether the crew can actually maintain that rate given access, inspections, stacking of trades, and rework.
Step 5: Reconcile Quantity Progress with “Definition of Done”
Quantity installed does not always equal “complete” in the schedule sense. For example, 100% of conduit installed may still require pull wire, terminations, labeling, testing, and inspection. To avoid overstating progress, either:
- Track separate activities for install vs. test/inspect, or
- Use weighted milestones within one activity (e.g., install 70%, test 20%, inspect 10%).
The goal is that 100% in the schedule means the successor can truly start without hidden work remaining.
Combining Percent Complete Rules and Quantity Tracking: A Practical Hybrid
Many projects use a hybrid approach:
- Use quantity tracking for long production installs.
- Use milestone-weighted percent complete for work that has distinct acceptance steps.
- Use 0/100 for approvals, inspections, and discrete handoffs.
Example: Electrical rough-in for a floor might be measured as:
- 40% earned by installed conduit and boxes (quantity-based)
- 30% earned by wire pull complete (units or milestone)
- 20% earned by terminations and labeling complete (milestone)
- 10% earned by rough inspection passed (0/100 milestone)
This prevents the common problem where “rough-in is 90%” for weeks because the last 10% includes the hardest coordination and inspection.
Worked Examples You Can Apply Immediately
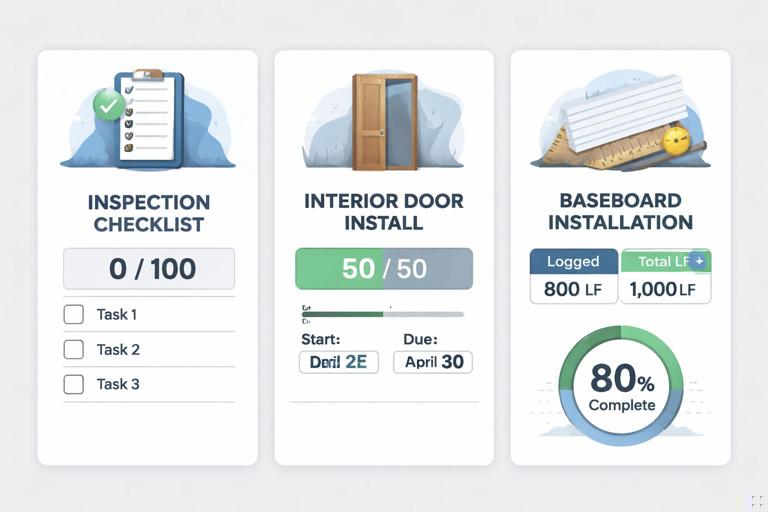
Example 1: 0/100 for an Inspection
Activity: “Framing Inspection Passed.” Rule: 0/100. Evidence: inspection sign-off date.
- Status date: Wednesday
- Inspection scheduled for Friday
- Even if framing is “ready,” percent complete remains 0% until Friday when it passes.
This avoids false confidence and keeps the schedule honest about risk.
Example 2: 50/50 for a Medium-Length Task
Activity: “Install Interior Doors – Level 2.” Duration: 6 days. Rule: 50/50.
- Day 1: Crew starts hanging doors in the east wing. Record actual start. Earn 50%.
- Day 4: Work pauses due to missing hardware. Percent complete stays 50% (not 80%). Remaining duration is updated based on what is truly left.
- Day 8: All doors installed, adjusted, and ready for punch. Record actual finish. Earn remaining 50% (now 100%).
The 50/50 rule prevents the “creeping percent” problem where progress inches up without meaningful reduction in remaining work.
Example 3: Quantity Tracking for Baseboard
Activity: “Install Baseboard – Units 101–120.” Total planned: 2,400 LF.
- Week 1 installed: 600 LF → 25% complete
- Week 2 installed: 900 LF (cumulative 1,500) → 62.5% complete
- Week 3 installed: 700 LF (cumulative 2,200) → 91.7% complete
- Week 4 installed: 200 LF (cumulative 2,400) → 100% complete
If the crew’s planned rate was 800 LF/week but actual was 600 LF in Week 1, you can immediately see a productivity gap and adjust staffing, access, or sequencing.
Common Pitfalls (and How to Prevent Them)
Pitfall: Percent Complete Doesn’t Match Remaining Duration
Example: An activity shows 80% complete but still has 8 days remaining on a 10-day task. That implies the last 20% takes 80% of the time, which might be true (finishing work often takes longer) but should be intentional, not accidental. Fix by:
- Using milestone-weighted rules that reflect finishing effort, or
- Switching to quantity tracking, or
- Updating remaining duration based on realistic production rather than letting percent drive it automatically.
Pitfall: Over-crediting Stored Materials or Offsite Work
Material delivered is not installed progress. If you want to recognize offsite fabrication, do it explicitly with separate activities (e.g., “Fabricate Ductwork Offsite”) and apply an appropriate earning rule with evidence (shop release, fabrication logs, delivery tickets). Do not inflate installation percent complete because materials are on site.
Pitfall: “Almost Done” Activities That Never Finish
This happens when the rule allows frequent small increases without a clear definition of completion. Fix by:
- Using 0/100 for short tasks and inspections
- Using 50/50 or 20/80 for medium tasks
- Defining “done” with acceptance criteria (ready for successor, tested, cleaned, internal punch complete)
Pitfall: Quantity Tracking Without a Stable Total Quantity
If the total quantity is wrong or changes without documentation, percent complete becomes misleading. Fix by:
- Establishing the quantity source (estimate, takeoff, BIM) and version
- Updating totals only through a controlled change process
- Keeping a log of quantity revisions and why they changed
Field-Friendly Tools: Simple Templates You Can Use
Weekly Progress Measurement Sheet (Percent Rule-Based)
Activity | Rule | Actual Start | Actual Finish | Evidence | % Earned This Week | Total % | Remaining Duration | Notes/ConstraintsUse this for inspections, approvals, and medium tasks where quantity tracking is not practical.
Daily Quantity Log (Quantity-Based)
Date | Area/Zone | Activity | Unit | Installed Today | Cumulative Installed | Total Quantity | % Complete | Crew Size | IssuesThis log supports both schedule updates and productivity conversations. The “issues” column is critical: it explains why production changed (access, rework, waiting on other trades, missing material, inspection delays).
Making Progress Measurement Actionable: Turning Numbers into Decisions
Progress measurement is not just reporting; it is a control system. Once percent complete and quantities are reliable, you can use them to:
- Forecast realistic finish dates by updating remaining durations based on production.
- Identify bottlenecks when quantities stall in a zone even though the schedule assumed continuous flow.
- Detect hidden work when quantities show install complete but milestones (test/inspect) are not earned.
- Support coordination by showing which areas are truly ready for successors.
- Improve accountability because progress is tied to evidence and measurable output.
The most important discipline is consistency: apply the same earning rules every update, capture quantities the same way each time, and require the same level of evidence. That consistency is what makes trends visible and makes the schedule a dependable management tool rather than a weekly argument.