Why Observability Matters in Kubernetes
In Kubernetes, your application is not a single process on a single machine. It is a set of containers, pods, services, and supporting components that can move, restart, scale, and change over time. When something breaks (or slows down), you need to answer questions quickly: What is failing? Where is it failing? When did it start? Who is affected? Observability is the discipline and tooling that lets you answer those questions from the outside by collecting and correlating signals produced by the system.
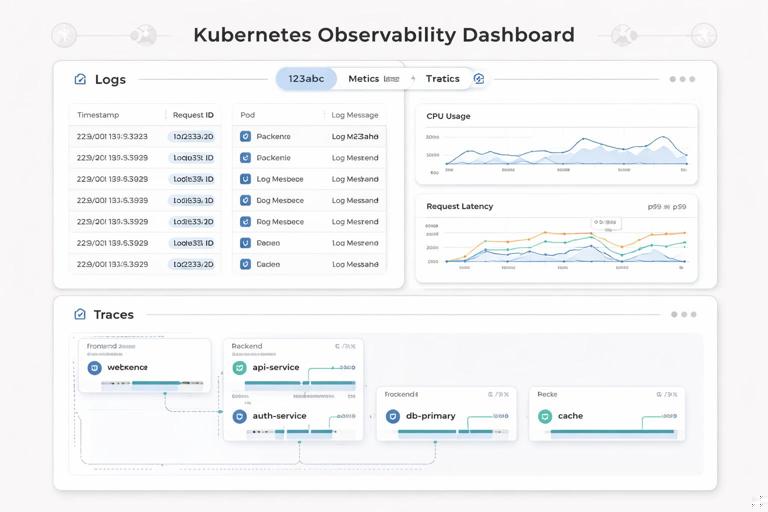
Observability is commonly described through three primary signal types: logs, metrics, and traces. Each signal answers different questions and has different strengths and costs. In practice, you get the best results when you design your system so these signals can be correlated (for example, by sharing a request ID across logs and traces, and by attaching consistent labels to metrics).
The Three Pillars: What Each Signal Is For
Logs: Discrete events with context
Logs are timestamped records of events. They are best for understanding what happened and why, especially when you need detailed context (inputs, decisions, errors). Logs are typically high-cardinality and high-volume, which makes them expensive to store and search if you are not careful.
- Best for: debugging errors, investigating unexpected behavior, auditing significant events, understanding edge cases.
- Weak for: fast aggregation over time (you can do it, but it’s often slower and costlier than metrics).
- Typical questions: “Why did this request fail?”, “What exception was thrown?”, “What did the service decide to do?”
Metrics: Numeric time series for trends and alerting
Metrics are numeric measurements sampled over time (time series). They are best for dashboards, alerting, capacity planning, and spotting regressions. Metrics are designed to be aggregated efficiently, but they can become expensive or unusable if you attach too many unique labels (high cardinality).
- Best for: SLOs/SLIs, alerting, performance trends, saturation signals (CPU/memory), request rates and error rates.
- Weak for: deep per-request debugging (metrics summarize; they don’t show the full story of one request).
- Typical questions: “Is latency increasing?”, “Are errors above threshold?”, “Is the database saturated?”
Traces: End-to-end request journeys
Distributed tracing represents a single request as it flows through multiple services. A trace is composed of spans; each span represents a timed operation (an HTTP call, a database query, a cache lookup). Tracing is best for understanding where time is spent and which dependency caused a slowdown or error.
- Listen to the audio with the screen off.
- Earn a certificate upon completion.
- Over 5000 courses for you to explore!

Download the app
- Best for: pinpointing latency sources, understanding service dependencies, debugging complex multi-service paths.
- Weak for: long-term trend analysis at very high volume unless you sample aggressively.
- Typical questions: “Which downstream call is slow?”, “Where did the error originate?”, “What is the critical path?”
Correlation: Turning Three Signals into One Story
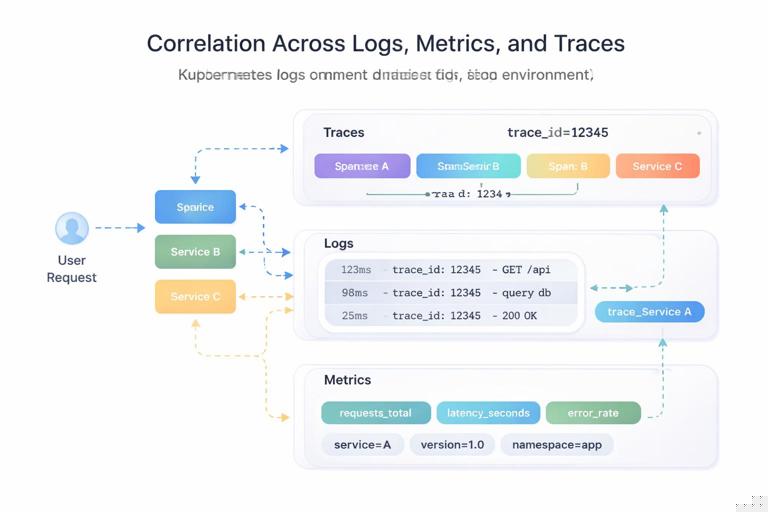
Collecting logs, metrics, and traces separately is useful, but the real power comes from correlation. Correlation means you can pivot from one signal to another using shared identifiers and consistent metadata.
- Trace ID in logs: include
trace_idandspan_idin structured logs so you can jump from an error log line to the exact trace. - Service identity: ensure logs/metrics/traces all carry the same service name, environment, and version.
- Kubernetes context: attach pod name, namespace, node, and container name so you can connect symptoms to runtime placement.
In Kubernetes, correlation often relies on a combination of application-level context (request IDs, user IDs) and platform-level context (pod labels, annotations, namespace). The goal is to make it easy to answer: “Is this issue isolated to one version, one node pool, one region, or one dependency?”
Foundational Concepts for Logs
Structured vs. unstructured logs
Unstructured logs are free-form strings. They are easy to write but hard to query reliably. Structured logs are emitted as JSON (or another structured format) with consistent fields. In Kubernetes, structured logs are strongly preferred because you can filter and aggregate by fields without brittle text parsing.
Example structured log event:
{"timestamp":"2026-01-09T12:34:56.789Z","level":"error","service":"checkout","env":"prod","version":"1.8.2","trace_id":"4bf92f3577b34da6a3ce929d0e0e4736","span_id":"00f067aa0ba902b7","http":{"method":"POST","path":"/pay","status":502},"message":"payment gateway timeout","error":"context deadline exceeded"}Log levels and what they should mean
Define log levels consistently across services. A practical baseline:
- DEBUG: verbose internal state; usually disabled in production or sampled.
- INFO: normal business events and lifecycle events (startup, config loaded).
- WARN: unexpected but recoverable situations (retrying, degraded dependency).
- ERROR: request failed or operation failed; requires attention if frequent.
Avoid logging sensitive data. In Kubernetes, logs often flow to centralized systems; treat them as potentially widely accessible.
Where logs come from in Kubernetes
Most containerized apps write logs to stdout/stderr. Kubernetes captures these streams and stores them on the node, and log collectors ship them to a backend. This model encourages stateless containers and avoids writing logs to local files that disappear when pods reschedule.
Important implication: if your application writes to files inside the container, you must explicitly handle collection (sidecar, agent, or volume). For most apps, stdout/stderr is the simplest and most portable approach.
Practical step-by-step: Make application logs correlation-friendly
This is a platform-agnostic checklist you can apply to any service:
- Step 1: Switch to structured JSON logs (library support exists for most languages).
- Step 2: Standardize core fields:
timestamp,level,service,env,version. - Step 3: Add request context fields for HTTP/gRPC: method, route, status, duration.
- Step 4: Propagate a request ID and/or trace context and include
trace_idin every log line produced during a request. - Step 5: Ensure errors include an error type/class and a message; avoid multi-line stack traces when possible (or encode them as a single field) to reduce parsing issues.
Foundational Concepts for Metrics
Types of metrics: counter, gauge, histogram, summary
Choosing the right metric type matters because it affects how you interpret and aggregate data.
- Counter: monotonically increasing value (e.g., total requests). Use for rates and totals. Reset on restart is expected.
- Gauge: value that can go up or down (e.g., current in-flight requests, memory usage).
- Histogram: buckets observations (e.g., request duration). Great for latency percentiles when used with a Prometheus-style backend.
- Summary: calculates quantiles on the client side; can be harder to aggregate across instances. Many teams prefer histograms for distributed systems.
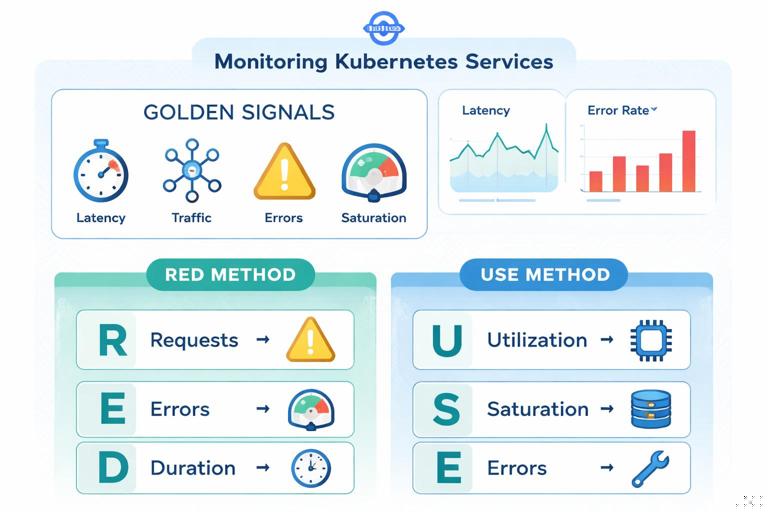
Golden signals and RED/USE methods
To avoid drowning in metrics, start with a small set that provides high diagnostic value.
- Golden signals: latency, traffic, errors, saturation.
- RED method (request-driven services): Rate, Errors, Duration.
- USE method (resource-driven components): Utilization, Saturation, Errors.
For a typical HTTP service, a minimal set might include: request rate, error rate, latency distribution (p50/p95/p99), and resource saturation (CPU throttling, memory pressure), plus dependency health metrics.
Labels, cardinality, and cost
Metrics become powerful when you can slice by labels (service, route, status code). But labels can also explode the number of time series. High cardinality labels (user ID, order ID, full URL, trace ID) should almost never be used in metrics.
Practical guidance:
- Prefer low-cardinality labels:
service,namespace,pod(sometimes),route(templated),status_class(2xx/4xx/5xx). - Avoid labels like:
user_id,email,ip,request_id, rawpathwith IDs. - Normalize routes: use
/orders/:idrather than/orders/123.
Practical step-by-step: Define a minimal metrics contract for a service
- Step 1: Define service-level metrics:
http_requests_total(counter),http_request_duration_seconds(histogram),http_in_flight_requests(gauge). - Step 2: Choose labels carefully. Example:
method,route,status_class. - Step 3: Add dependency metrics for critical calls (database, external APIs): request duration and error counters per dependency name.
- Step 4: Add a build/info metric (gauge with value 1) to expose version and commit for correlation:
service_build_info{version="1.8.2",commit="abc123"} 1. - Step 5: Validate cardinality by reviewing how many unique label combinations you generate in staging under realistic traffic.
Example metric names and labels (Prometheus-style):
# Counter: total requests by route and status class (2xx/4xx/5xx) http_requests_total{service="checkout",route="/pay",method="POST",status_class="5xx"} 12 # Histogram: request duration buckets http_request_duration_seconds_bucket{service="checkout",route="/pay",le="0.1"} 240 http_request_duration_seconds_bucket{service="checkout",route="/pay",le="0.5"} 420 http_request_duration_seconds_bucket{service="checkout",route="/pay",le="+Inf"} 500Foundational Concepts for Tracing
Trace, span, context propagation
A trace represents a single transaction. Each trace contains spans. Spans have start/end timestamps, attributes (tags), events (logs within the span), and links to parent/child spans. For tracing to work across services, you must propagate context (trace ID and span ID) through request headers or metadata.
Common propagation formats include W3C Trace Context (traceparent header). The key idea is that every downstream call must carry the trace context so the backend can stitch spans into a single trace.
Sampling strategies
Tracing every request can be expensive. Sampling decides which requests produce traces.
- Head-based sampling: decide at the start of the trace. Simple, but may miss rare errors unless you bias sampling.
- Tail-based sampling: decide after seeing the whole trace (e.g., keep slow or error traces). More powerful but requires buffering and more infrastructure.
A practical approach is to sample a small percentage of normal traffic, and keep a higher percentage (or all) of error traces and very slow traces.
Span attributes and cardinality
Just like metrics labels, span attributes can explode in cardinality and cost. Traces are more tolerant of high-cardinality attributes than metrics, but you still need discipline.
- Good attributes: service name, route template, HTTP method, status code, dependency name, region/zone, retry count.
- Risky attributes: full URLs with IDs, raw SQL queries with parameters, user emails, tokens.
Practical step-by-step: Instrument a request path with useful spans
- Step 1: Create a root span at the edge of the service (HTTP/gRPC handler).
- Step 2: Add child spans around key operations: database calls, external HTTP calls, message publishes, cache lookups.
- Step 3: Record errors on spans (set status to error and attach an error message/type).
- Step 4: Propagate context to downstream calls automatically via your HTTP/gRPC client interceptors/middleware.
- Step 5: Add a small set of attributes that help filtering:
http.route(templated),net.peer.name,db.system,rpc.method, and a deployment version attribute.
Conceptual pseudo-code for a handler with spans:
handlePay(request): span = tracer.startSpan("POST /pay") span.setAttr("http.route", "/pay") span.setAttr("service.version", "1.8.2") try: dbSpan = tracer.startSpan("SELECT customer", parent=span) customer = db.query(...) dbSpan.end() gwSpan = tracer.startSpan("POST payment-gateway", parent=span) resp = http.post(gatewayUrl, headers=injectTraceContext()) gwSpan.setAttr("http.status_code", resp.status) gwSpan.end() span.setAttr("http.status_code", 200) return 200 except TimeoutError as e: span.recordError(e) span.setAttr("http.status_code", 502) return 502 finally: span.end()Designing Observability for Kubernetes Workloads
Service identity and consistent metadata
To make signals usable across a cluster, standardize naming and metadata:
- Service name: stable logical name (not pod name).
- Environment: dev/staging/prod (or similar).
- Version: application version or image tag.
- Kubernetes metadata: namespace, workload name, pod, node, container.
Many observability stacks can enrich signals with Kubernetes metadata automatically if the collector/agent has access to the Kubernetes API. Even then, it’s valuable to include service name and version at the application level so the same signals remain meaningful outside Kubernetes too.
Health signals vs. business signals
Platform health signals tell you whether the system is running; business signals tell you whether it is delivering value. Both are necessary.
- Health signals: request success rate, latency, CPU/memory saturation, queue depth, dependency availability.
- Business signals: checkouts completed, payment failures by reason, signups per minute, inventory reservations.
Business metrics should be carefully designed to avoid high cardinality and to reflect meaningful outcomes. For example, count payment failures by a small set of normalized reason codes, not by raw exception messages.
Common failure modes and which signal finds them fastest
- Sudden spike in 5xx errors: metrics alert first; logs explain error details; traces show which dependency or code path fails.
- Latency regression after a change: metrics show p95/p99 increase; traces pinpoint slow spans; logs confirm timeouts/retries.
- Intermittent timeouts: traces help identify tail latency; logs show retry behavior; metrics show saturation or dependency error rates.
- One pod misbehaving: metrics sliced by pod reveal outliers; logs show pod-specific errors; traces may reveal a hot shard or bad node.
Practical Investigation Workflow (Putting It Together)
When an incident occurs, a repeatable workflow reduces time to resolution. This workflow assumes you have all three signals available and correlated.
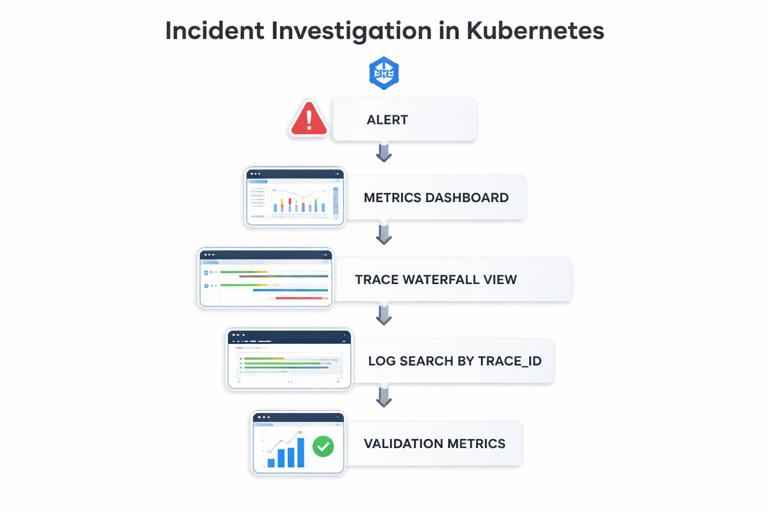
Step-by-step: From alert to root cause using metrics, traces, and logs
- Step 1: Confirm impact with metrics. Check request rate, error rate, and latency. Determine scope: which service, which route, which region/namespace, which version.
- Step 2: Identify the pattern. Is it all traffic or a subset? Is it correlated with a specific route, dependency, or pod?
- Step 3: Pivot to traces for slow/error requests. Filter traces by service and route, then focus on error traces or the slowest percentile. Look for the span with the largest duration or the first error.
- Step 4: Pivot to logs using trace ID. Use the trace ID from a problematic trace to find all logs for that request across services. Confirm error messages, retries, and decision points.
- Step 5: Validate with additional metrics. If traces indicate a dependency issue, check dependency metrics (timeouts, connection pool saturation). If it indicates resource pressure, check CPU throttling, memory pressure, or queue depth.
- Step 6: Narrow to a change or configuration. Compare by version label. If only one version is affected, you likely have a regression. If all versions are affected, suspect dependency or infrastructure.
This workflow is effective because it uses metrics to find “where and how big,” traces to find “which step,” and logs to find “what exactly happened.”
Practical Data Hygiene: What to Avoid
Anti-patterns in logging
- Logging entire request/response bodies by default (costly and risky for sensitive data).
- Using inconsistent field names across services (hard to query).
- Relying on multi-line logs that break parsing and correlation.
- Logging at INFO for high-frequency events (creates noise and cost).
Anti-patterns in metrics
- High-cardinality labels (user IDs, request IDs, raw URLs).
- Too many near-duplicate metrics with unclear meaning.
- Client-side summaries that cannot be aggregated across replicas (when you need cluster-wide percentiles).
Anti-patterns in tracing
- No context propagation (traces stop at service boundaries).
- Over-instrumentation with too many spans per request (high overhead).
- Capturing sensitive attributes (tokens, PII) in span attributes or events.
What “Good” Looks Like: A Minimal Observability Baseline
A practical baseline for a Kubernetes-deployed service is:
- Logs: structured JSON to stdout/stderr; consistent fields; trace ID included; errors are single-event and searchable.
- Metrics: request rate/error rate/latency histogram; saturation metrics; dependency metrics; low-cardinality labels; version exposed.
- Traces: context propagation enabled; key spans around dependencies; error status recorded; sampling configured to keep errors and slow traces.
With this baseline, you can detect issues quickly (metrics), diagnose them efficiently (traces), and confirm details and edge cases (logs) without drowning in data or cost.